. 2022 Sep 2;8(35):eabo1215.
doi: 10.1126/sciadv.abo1215. Epub 2022 Aug 31.

Phosphorylation of FAM134C by CK2 controls starvation-induced ER-phagy

Affiliations

Phosphorylation of FAM134C by CK2 controls starvation-induced ER-phagy

Giorgia Di Lorenzo et al. Sci Adv. .

Abstract

Selective degradation of the endoplasmic reticulum (ER) via autophagy (ER-phagy) is initiated by ER-phagy receptors, which facilitate the incorporation of ER fragments into autophagosomes. FAM134 reticulon family proteins (FAM134A, FAM134B, and FAM134C) are ER-phagy receptors with structural similarities and nonredundant functions. Whether they respond differentially to the stimulation of ER-phagy is unknown. Here, we describe an activation mechanism unique to FAM134C during starvation. In fed conditions, FAM134C is phosphorylated by casein kinase 2 (CK2) at critical residues flanking the LIR domain. Phosphorylation of these residues negatively affects binding affinity to the autophagy proteins LC3. During starvation, mTORC1 inhibition limits FAM134C phosphorylation by CK2, hence promoting receptor activation and ER-phagy. Using a novel tool to study ER-phagy in vivo and FAM134C knockout mice, we demonstrated the physiological relevance of FAM134C phosphorylation during starvation-induced ER-phagy in liver lipid metabolism. These data provide a mechanistic insight into ER-phagy regulation and an example of autophagy selectivity during starvation.


Figures
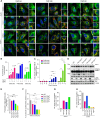
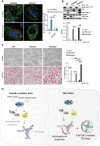
Fig. 1.
Fig. 1.. Regulation of FAM134 protein by mTORC1 inhibition.
(A) Representative images of immunofluorescence staining for HA, LAMP1, and nuclei in HA-FAM134s–expressing U2OS cells cultured with BafA1 (200 nM; 4 hours) and/or Torin1 (150 nM; 8 hours), where indicated. Scale bar, 10 μm. (B) Quantification of HA puncta into LAMP1-positive vesicles. Mean ± SEM. N = 3 biological replicates. n = 15 cells per experiment. Two-way analysis of variance (ANOVA) and Tukey’s multiple comparison test: *P < 0.05 and **P < 0.005. (C) Fluorescence-activated cell sorting (FACS) analysis in human embryonic kidney (HEK) 293T cells expressing ssRFP-GFP-FAM134s. Torin1 (150 nM) was added for the indicated time points. Quantification of red fluorescence shift relative to untreated (0 hours). Mean ± SEM. N = 4 biological replicates. Two-way ANOVA and Tukey’s multiple comparison test: ****P < 0.0001, **P < 0.005, and *P < 0.05. (D) Representative Western blot analysis in RCS cells expressing mKeima-RAMP4 treated with Torin1 (150 nM; 15 hours). β-Actin was used as a loading control. (E) Quantification of mKeima/mKeima-Ramp4 ratio relative to dimethyl sulfoxide (DMSO)–treated cells. Mean ± SEM. N = 4 biological replicates. One-way ANOVA and Tukey’s multiple comparison test: **P < 0.005 and ***P < 0.0005. (F) FACS analysis in RCS cells expressing ssRFP-GFP-KDEL treated with Torin1 (150 nM; 15 hours). Quantification of red fluorescence shift relative to untreated. Mean ± SEM. N = 6 biological replicates. One-way ANOVA and Tukey’s multiple comparison test: ****P < 0.0001, **P < 0.005, and *P < 0.05. (G and H) Proteome of U2OS (G) and RCS cells (H) untreated or treated with Torin1 (150 nM; 12 hours). Bar graphs show the number of ER proteins down-regulated by Torin1 (150 nM; 12 hours) in control [wild type (WT)] and HA-FAM134–overexpressing U2OS cells (G) and in RCS with indicated genotypes (H). N = 3 biological replicates. Adjusted P value < 0.05
Fig. 2.
Fig. 2.. Phosphorylation of FAM134C controls its affinity for LC3B.
(A) Heatmap of the phosphorylation levels of FAM134C at indicated residues in U2OS cells cultured in starved (HBSS medium) versus stimulated (amino acids + 100 nM insulin) medium. Heatmap is color-coded according to the intensity level of the phosphorylated site. N = 3 biological replicates. FDR: **P < 0.005. (B) Structural analysis of the FAM134C_P434-P460/LC3B complex. Projection of the electrostatic potential map of LC3B onto the structure of the centroid associated with the most populated cluster family. The insets display the interactions established by Ser435, Ser436, and Thr440 of FAM134C with LC3B and their frequency of occurrence in the PT-MD principle conformational state. LC3B was represented through its solvent-accessible surface, colored according to the local electrostatic potential map values following the color gradient on the right side. FAM134C_P434-P460 was represented in ribbon and colored in orange. Green boxes highlight the first (F) and the fourth (L) amino acids of the FAM134C LIR domain. (C) Western blot analysis showing immunoprecipitation (IP) experiment of HA-FAM134C-WT and HA-FAM134C-3D overexpressed in U2OS cells. Low and high refers to different exposures of the membrane. BafA1 (200 nM) was supplied where indicated. Arrowheads indicate a nonspecific band. On the right, bar graph shows quantification of LC3B binding of FAM134C-3D relative to WT in the presence of BafA1. Mean ± SEM. N = 3 biological replicates. Student’s paired t test: **P < 0.005.
Fig. 3.
Fig. 3.. FAM134C activity is regulated by phosphorylation.
(A) Representative immunofluorescence staining of Myc, LAMP1, and nuclei in U2OS cells transfected with WT-, 3D-, and 3A-Myc-FAM134C. Cells were treated for 2 hours with BafA1 (100 nM), and where indicated, Torin1 (250 nM) was added for 6 hours. Scale bar, 10 μm. (B) Quantification of Myc-FAM134C lysosomal puncta per cell. Bar graph shows mean ± SEM. N = 3 biological replicates. n = 15 cells per experiment. Two-way ANOVA and Tukey’s multiple comparison test: ****P < 0.0001. (C) Representative immunofluorescence staining for RFP, GFP, and nuclei in WT and Fam134cKO MEF cells, stably expressing the ER-phagy reporter ssRFP-GFP-KDEL, after Torin1 treatment (150 nM; 24 hours). Scale bar, 10 μm. Quantification shows the number of red-only positive puncta (ssRFP+) per cell. Mean ± SEM. N = 3 biological replicates. n = 15 cells per experiment. Two-way ANOVA and Sidak’s and Tukey’s multiple comparison test: ***P < 0.0005 and **P < 0.005. ns, not significant. (D) Quantification of red fluorescent shift performed by FACS analysis in WT and Fam134cKO MEF cells, stably expressing ssRFP-GFP-KDEL, treated with Torin1 (150 nM) or DMSO at the indicated time points. N = 3 biological replicates. Two-way ANOVA and Sidak’s and Tukey’s multiple comparison test: ****P < 0.0001 and *P < 0.05. (E) Representative images of Fam134cKO MEFs cells expressing ssRFP-GFP-KDEL and transfected with WT, 3D, or 3A mutant FAM134C proteins. Cells were kept in complete medium or starved for 8 hours in HBSS. Scale bars, 10 μm. (F) Quantification of red-only puncta (RFP+/GFP) average per cell. Bar graph shows mean ± SEM. N = 3 biological replicates. n = 15 cells per experiment. Two-way ANOVA and Tukey’s multiple comparison test: **P < 0.005 and *P < 0.05.
Fig. 4.
Fig. 4.. CK2 phosphorylates FAM134C.
(A) List of putative residues with CK2 consensus at the C terminus of FAM134C (data obtained from the PhosphositePlus website). (B) U2OS cells expressing doxycycline-inducible HA-tagged FAM134C were subjected to IP. Inputs and immunoprecipitates were analyzed by immunoblotting using the indicated antibodies. (C) Bar graph shows quantification of phosphorylated/total HA-FAM134C ratio relative to (B). Mean ± SEM. N = 3 biological replicates. Student’s paired t test: ***P < 0.0005. CX4945: CK2 inhibitor (4 μM; 6 hours) and BafA1 (200 nM; 6 hours). (D) CK2 α and β subunit interaction with FAM134 proteins based on IP-MS interactome experiment from U2OS FLAG-HA-FAM134A, FLAG-HA-FAM134B, and FLAG-HA-FAM134C doxycycline-inducible cells. NA, not detected. Numeric values represent log2 difference. (E) In vitro CK2 phosphorylation radioactive assay. C-terminal FAM134C WT and phosphomutant (T440A and 3A) peptides and CK2β (control substrate) were incubated with CK2α in the presence of radioactive adenosine triphosphate (ATP). Substrate phosphorylation was detected by autoradiography. Equal amounts of proteins were verified by Coomassie staining. On the bottom, relative quantitation of the bands is performed by analysis with the CyclonePlus Storage Phosphor System (PerkinElmer); the unit amounts of each peptide are indicated, and activity is reported as % of that measured with 5 units of CK2α. Mean ± SEM. N = 3 biological replicates. One-way ANOVA and Tukey’s multiple comparison test: ****P < 0.0001 and *P < 0.05. (F) Western blot analysis of CK2-dependent phosphorylation of WT- and 3A-HA-FAM134C250–466 peptides transfected in Atg7KO MEFs untreated or treated with the CK2 inhibitor CX4945 (4 μM; 6 hours). Vinculin was used as loading control. NT, not transfected.
Fig. 5.
Fig. 5.. Regulation of FAM134C by CK2.
(A) Representative Western blot analysis of IP experiments of doxycycline-inducible HA-FAM134C treated with CX4945 was indicated (4 μM; 4 hours). Vinculin was used as loading control for input. Arrowheads indicate a nonspecific band. On the right, the bar graph shows quantification of immunoprecipitated LC3B relative to untreated samples. Mean ± SEM. N = 3 biological replicates. Student’s paired t test: *P < 0.05. (B) Representative Western blot analysis of HA-FAM134C in U2OS cells overexpressing doxycycline-inducible HA-FAM134C treated with DMSO, Torin1 (250 nM; 6 hours), CK2 inhibitor CX4945 (4 μM; 6 hours), or CK2 inhibitor SGC-CK2-1 (50 nM; 6 hours) in the absence or presence of BafA1 (100 nM). β-Actin was used as a loading control. Bar graph shows quantification of HA-FAM134C/β-actin ratio relative to DMSO-treated samples. Mean ± SEM. N = 3 biological replicates. Sidak’s and Tukey’s multiple comparison test: ****P < 0.0001, ***P < 0.0005, and *P < 0.05. (C) Representative immunofluorescence staining of Myc (green), LAMP1 (red), and nuclei (blue) in U2OS cells transiently transfected with Myc-FAM134C-WT, Myc-FAM134C-3D, and Myc-FAM134C-3A. Cells were pretreated for 2 hours with BafA1 (100 nM), and then DMSO or CK2 inhibitor CX4945 (4 μM) was added for 6 hours. Scale bar, 10 μm. On the right, bar graph shows quantification of Myc-FAM134C in LAMP1-positive vesicles. Mean ± SEM. N = 3 biological replicates. n = 15 cells per experiment. Two-way ANOVA and Tukey’s multiple comparison test: ****P < 0.0001.
Fig. 6.
Fig. 6.. CK2-dependent phosphorylation of FAM134C is modulated by mTORC1.
(A) Western blot analysis of Atg7KO MEF cells transfected with WT- or 3A-HA-FAM134C250–466 peptides and treated with Torin1 (1 μM; 6 hours). (B) Western blot analysis of U2OS cells transfected with GFP-CK2β plasmid treated with DMSO, Torin1 (1 μM), or HBSS (4 hours). Vinculin (A) or β-actin (B) was used as loading controls. Quantification (A and B) of phosphorylated/total protein ratio. N = 6 (A) and N = 4 (B) biological replicates. Mean ± SEM. Two-way ANOVA and Sidak’s multiple comparison test: **P < 0.005 and ***P < 0.0005. (C) Phosphorylation analysis of CK2β in U2OS cells. N = 3 biological replicates. Student’s paired t test: *P < 0.05. (D and E) Radioactive phosphorylation assays using (D) mTOR (200 ng; 20 min) and CK2β [203–215] peptide at the indicated concentrations and (E) mTOR (200 ng) and CK2β [203–215] peptide (1.2 mM) for the indicated times. Mean ± SEM. N = 2. (F) Western blot analysis of MEF cells treated with DMSO or Torin1 (1 μM; 6 hours). N = 3 biological replicates. H3 histone was used as loading control. Bar graphs show quantifications (mean ± SEM) of phosphorylated AKT and CDC37/total protein ratio. Student’s paired t test: *P < 0.05 and **P < 0.005 (G) Western blot analysis of WT, tamoxifen-inducible Raptor KO (Rptor-indKO), or Rictor KO (Rictor-indKO) MEFs. WT MEFs were treated with CX4945 (4 μM; 6 hours) as control. Asterisk (*) denotes bands changing intensity. N = 3 biological replicates. Bar graphs show quantifications (mean ± SEM) of phosphorylated AKT and CDC37/total protein ratio. Two-way ANOVA and Sidak’s multiple comparison test: *P < 0.05, **P < 0.005, ***P < 0.0005, and ****P < 0.0001.
Fig. 7.
Fig. 7.. Starvation and mTOR inhibition regulate Fam134c degradation in vivo.
(A) Representative immunofluorescence staining of RFP, GFP, and nuclei in liver sections isolated from WT, Li-Tsc1KO, and Li-RagAGTP mice injected with AAV ssRFP-GFP-KDEL kept with food at libitum or fasted for 24 hours. Scale bar, 20 μm. Quantification shows red-only positive puncta (RFP+) number per cell. Mean ± SEM. N = 3 biological replicates. n = 15 cells per experiment. Student’s paired t test: **P < 0.005. (B) Representative immunofluorescence staining of RFP, GFP, and nuclei in liver from WT mice injected with AAV ssRFP-GFP-KDEL and treated with WYE-132 (mTOR inhibitor) or vehicle for 24 hours. Scale bar, 20 μm. Quantification of red-only puncta (RFP+/GFP) average per cell. Mean ± SEM. N = 3 biological replicates. n = 15 cells per experiment. Student’s paired t test: ****P < 0.0001. (C) Western blot analysis of liver extracts from WT mice treated with WYE-132 (mTOR inhibitor) or vehicle for 24 hours. β-Actin was used as a loading control. N = 3 biological replicates. Student’s paired t test: ***P < 0.0005. (D and E) Western blot analysis of liver samples isolated from WT, Li-Tsc1KO (D), or Li-RagAGTP (E) mice fasted for 24 hours. β-Actin was used as a loading control. N = 3 biological replicates. Student’s paired t test: *P < 0.05 and **P < 0.005. (F) Representative immunofluorescence staining of RFP, GFP, and nuclei in liver from WT mice injected with AAV mRFP-GFP-FAM134C-WT, mRFP-GFP-FAM134C-3D, or mRFP-GFP-FAM134C-3A and fasted for 24 hours. Scale bar, 20 μm. On the right, quantification shows red-only puncta (RFP+/GFP) average per cell. Mean ± SEM. n = 50 cells. One-way ANOVA and Tukey’s multiple comparison test: ****P < 0.0001.
Fig. 8.
Fig. 8.. Loss of Fam134c in mouse impairs lipid metabolism in liver upon mTOR inhibition.
(A) Representative immunofluorescence staining of RFP (red), GFP (green), and nuclei (blue) in liver from WT and Retreg3−/− mouse after ad libitum feeding or 24 hours of fasting. Scale bar, 20 μm. Quantification shows red-only positive puncta (RFP+) number per cell relative to ad libitum condition. Mean ± SEM. N = 3 biological replicates. n = 15 cells per experiment. Two-way ANOVA and Tukey’s multiple comparison test: ****P < 0.0001. (B) Representative Western blot analysis of indicated proteins in liver from WT, Retreg1−/−, and Retreg3−/− mice treated with WYE-132 (mTOR inhibitor) or vehicle for 24 hours. Vinculin was used as a loading control. On the bottom, quantification shows phosphorylated/total protein ratio. Mean ± SEM. N = 5 biological replicates. Two-way ANOVA and Tukey’s multiple comparison test: ****P < 0.0001. (C) Representative images of Oil Red O staining in WT, Retreg1−/−, and Retreg3−/− mouse liver sections. Mice were treated with WYE-132 (mTOR inhibitor) or vehicle for 24 hours. On the right, quantification of red area was reported as percentage (%) of total area. Mean ± SEM. N = 5 biological replicates. Two-way ANOVA and Tukey’s multiple comparison test: ****P < 0.0001. (D) Proposed model of FAM134C activation during starvation. The inhibition of mTORC1 concomitantly induces autophagosome biogenesis and reduction of FAM134C phosphorylation that favors autophagy of FAM134C-decorated ER fragments.

Similar articles

Cited by

References

    1. Mizushima N., Autophagy in protein and organelle turnover. Cold Spring Harb. Symp. Quant. Biol. 76, 397–402 (2011). - PubMed
    1. Kim Y. C., Guan K.-L., mTOR: A pharmacologic target for autophagy regulation. J. Clin. Invest. 125, 25–32 (2015). - PMC - PubMed
    1. Liu G. Y., Sabatini D. M., mTOR at the nexus of nutrition, growth, ageing and disease. Nat. Rev. Mol. Cell Biol. 21, 183–203 (2020). - PMC - PubMed
    1. Hosokawa N., Hara T., Kaizuka T., Kishi C., Takamura A., Miura Y., Iemura S., Natsume T., Takehana K., Yamada N., Guan J.-L., Oshiro N., Mizushima N., Nutrient-dependent mTORC1 association with the ULK1-Atg13-FIP200 complex required for autophagy. Mol. Biol. Cell 20, 1981–1991 (2009). - PMC - PubMed
    1. Ganley I. G., Lam D. H., Wang J., Ding X., Chen S., Jiang X., ULK1.ATG13.FIP200 complex mediates mTOR signaling and is essential for autophagy. J. Biol. Chem. 284, 12297–12305 (2009). - PMC - PubMed