. 2022 Aug 31;14(660):eabo6135.
doi: 10.1126/scitranslmed.abo6135. Epub 2022 Aug 31.

Quantitative immunopeptidomics reveals a tumor stroma-specific target for T cell therapy

Affiliations

Quantitative immunopeptidomics reveals a tumor stroma-specific target for T cell therapy

Gloria B Kim et al. Sci Transl Med. .

Erratum in

Abstract

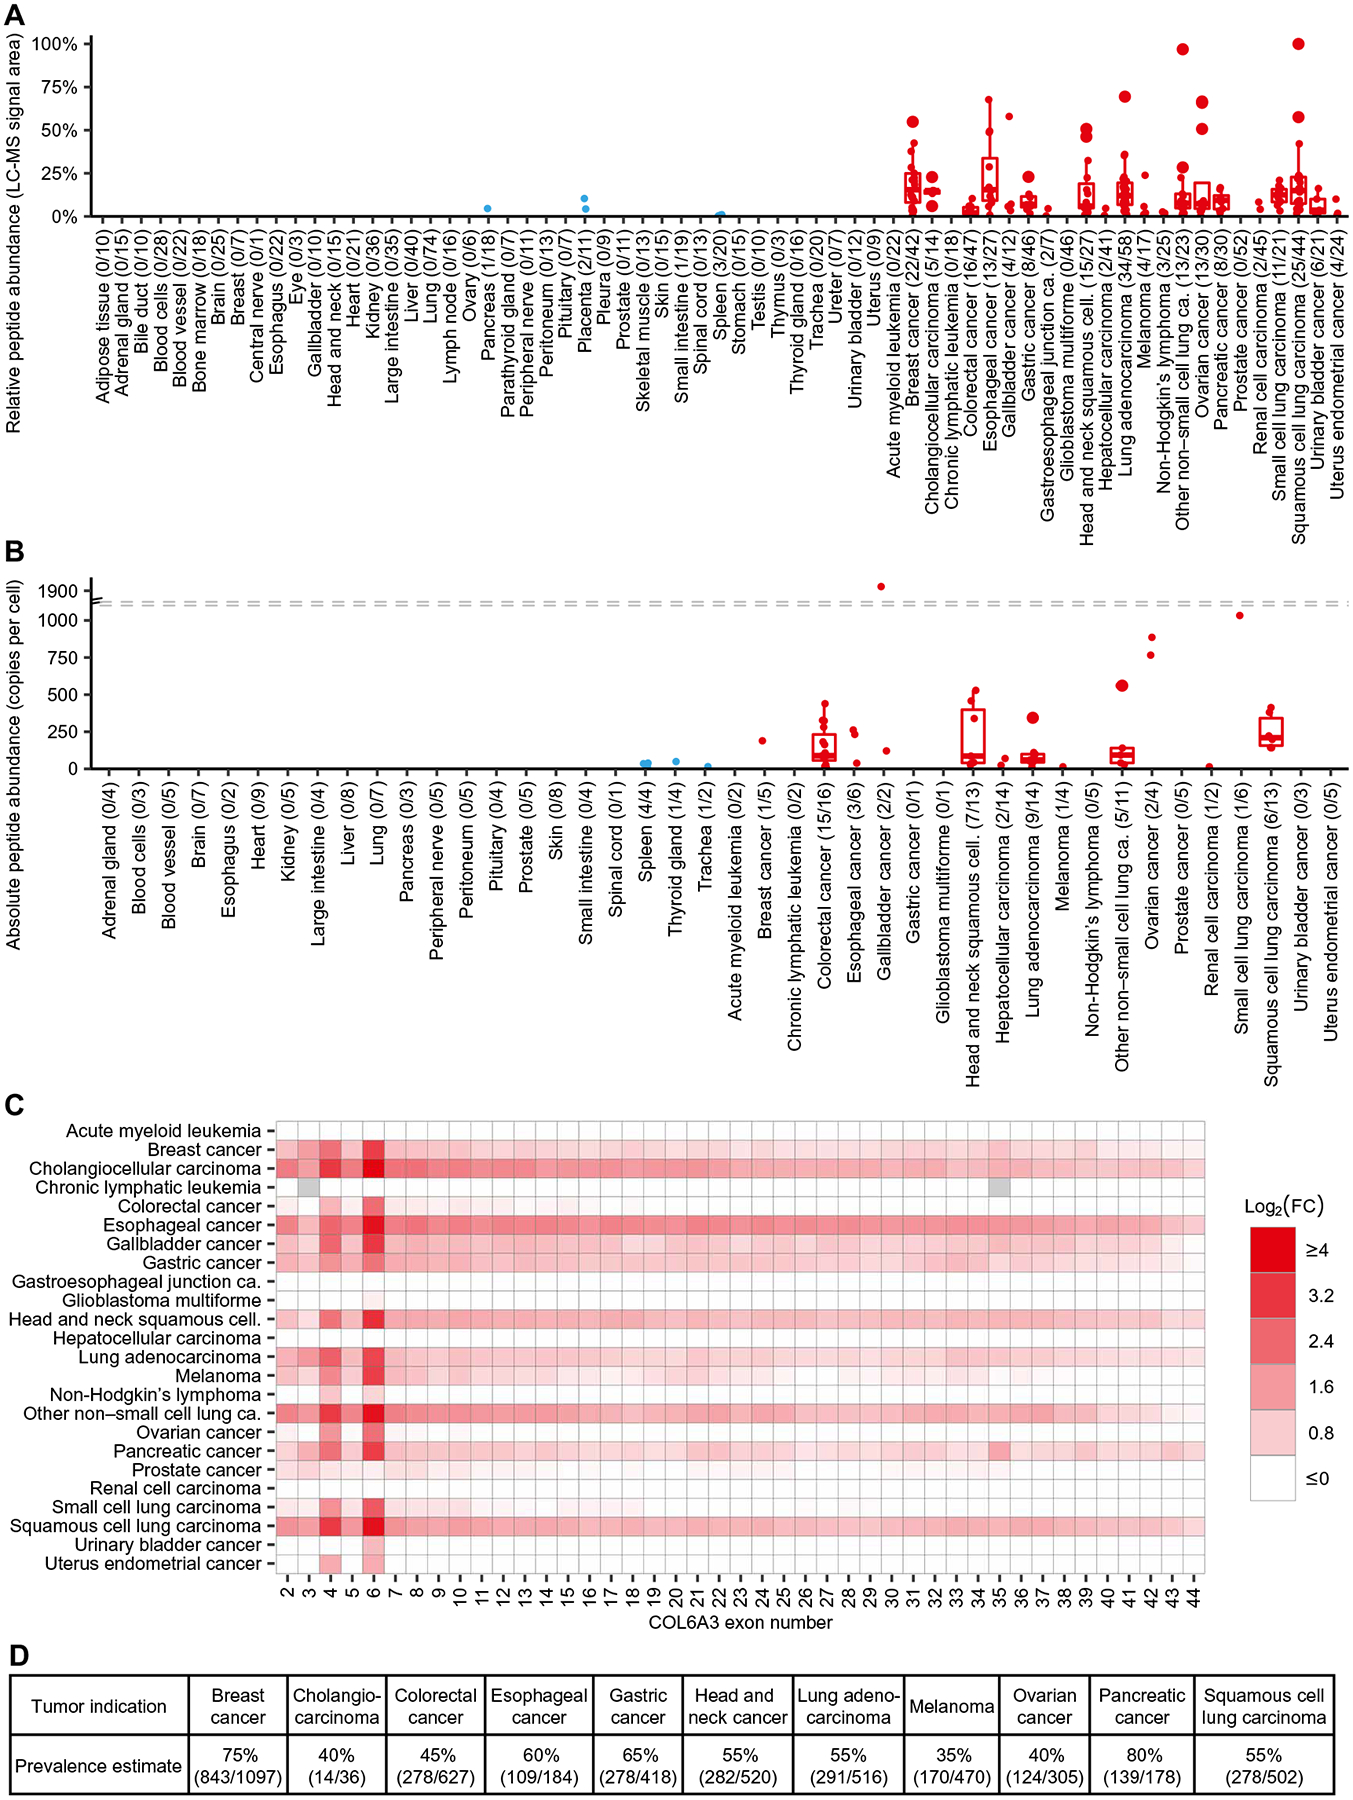
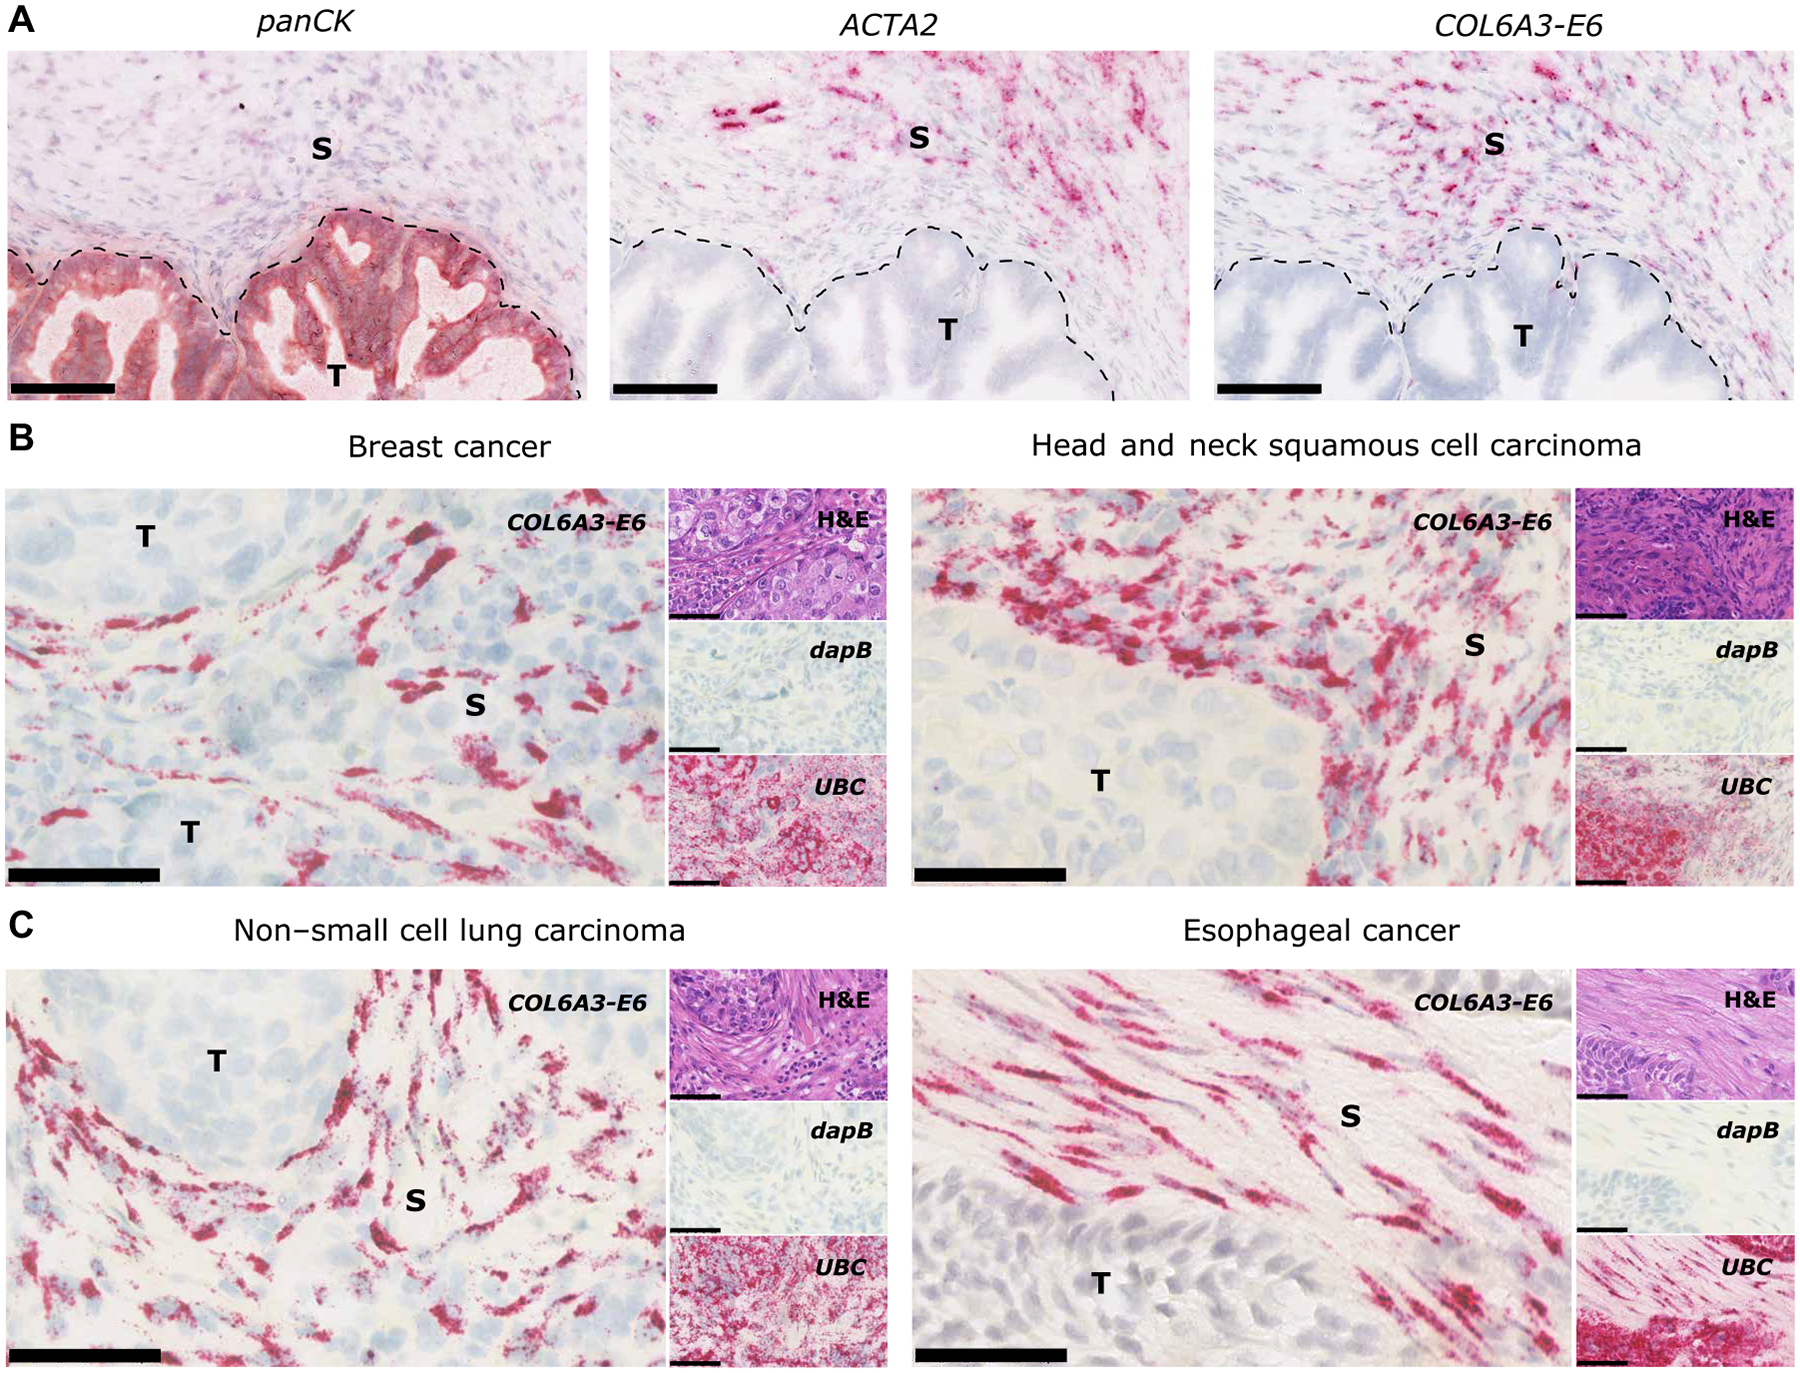
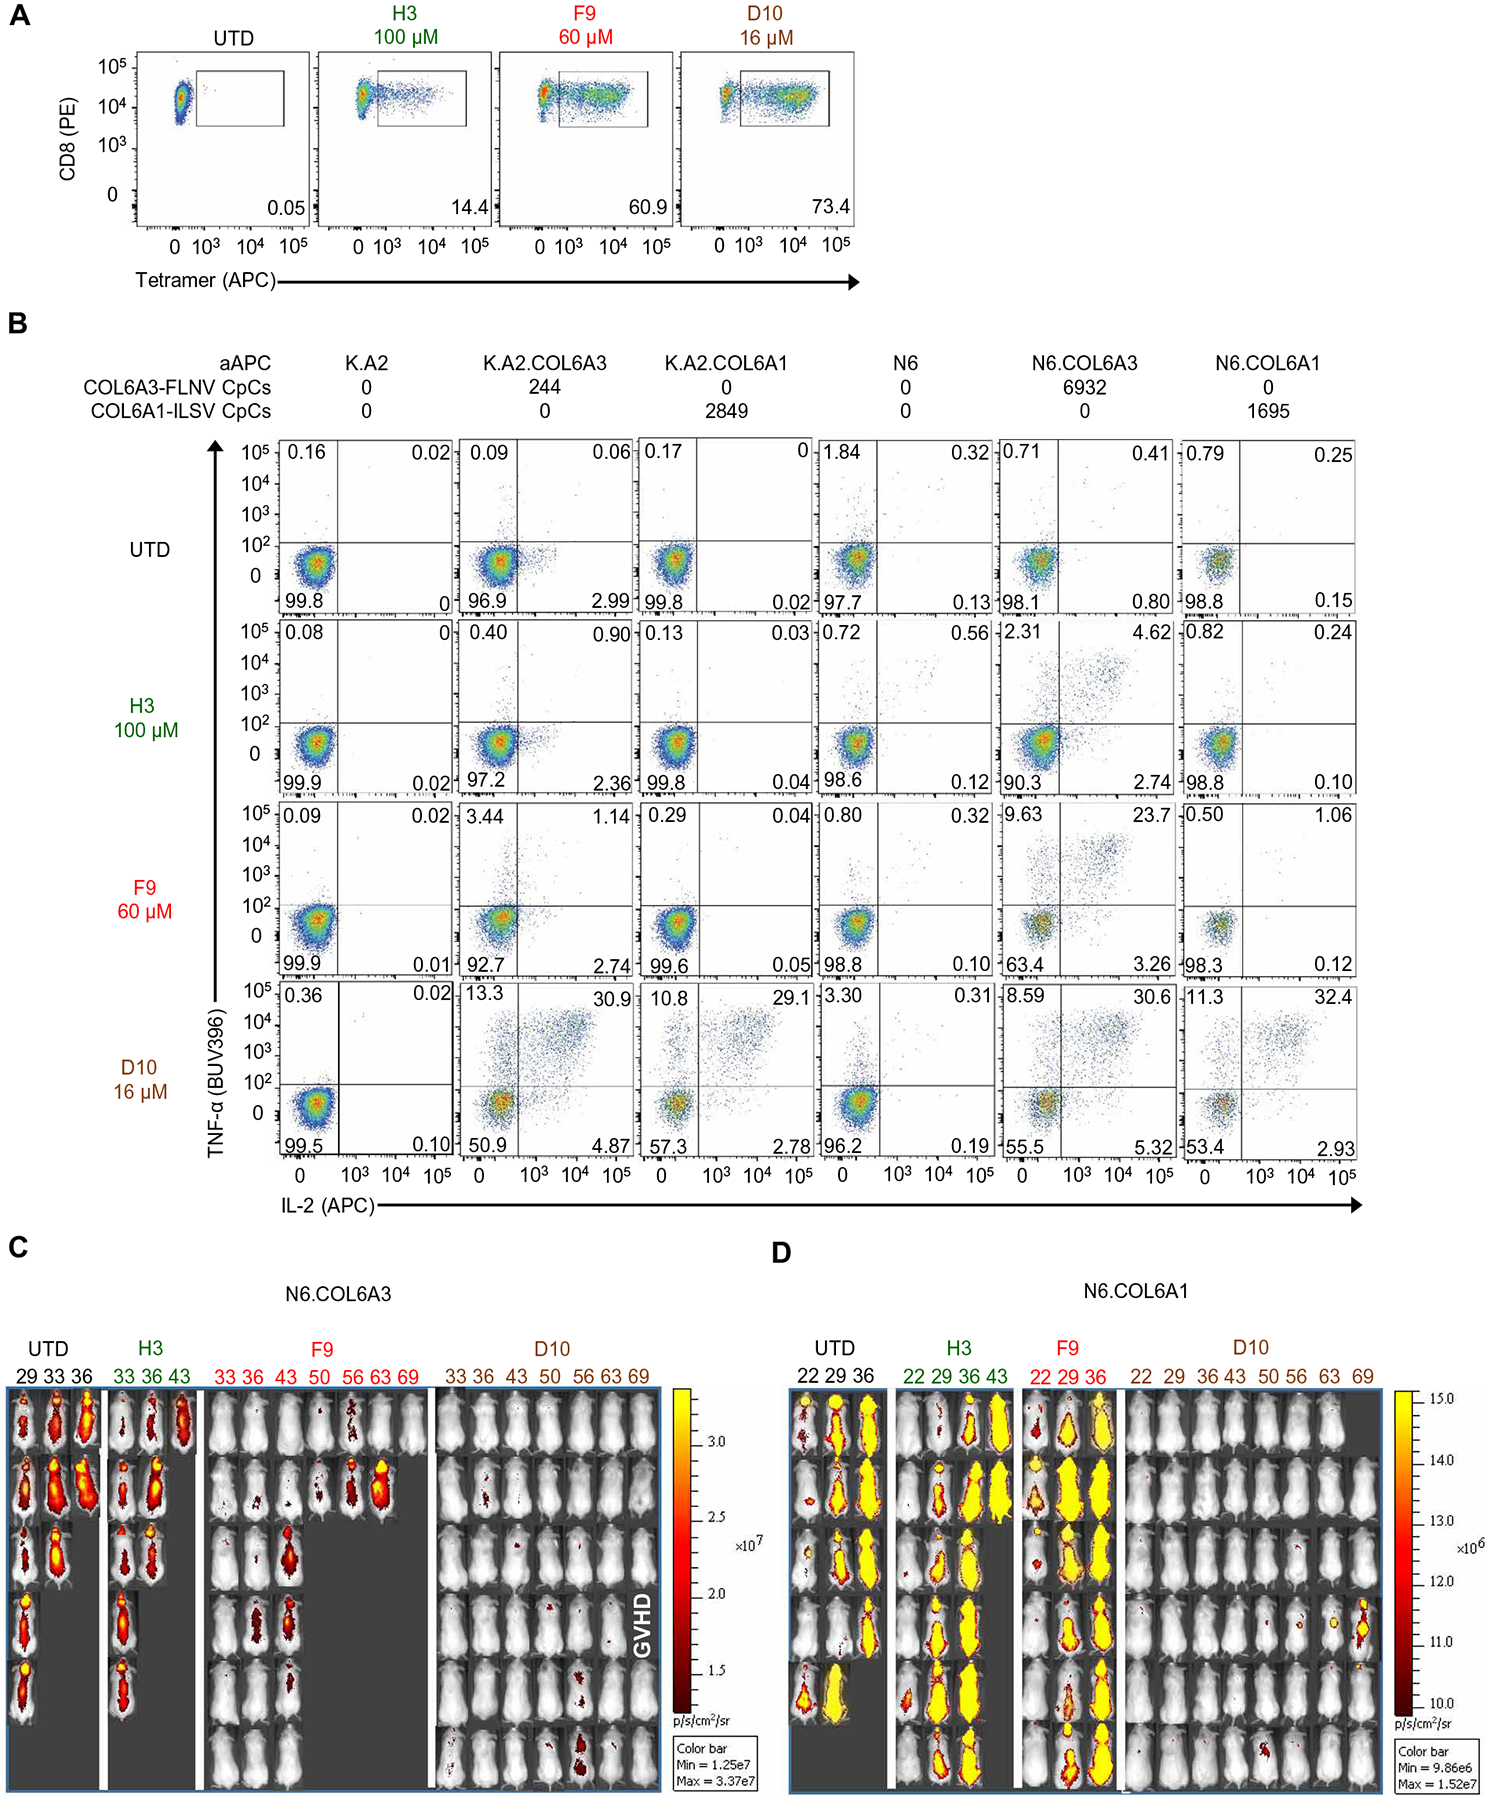
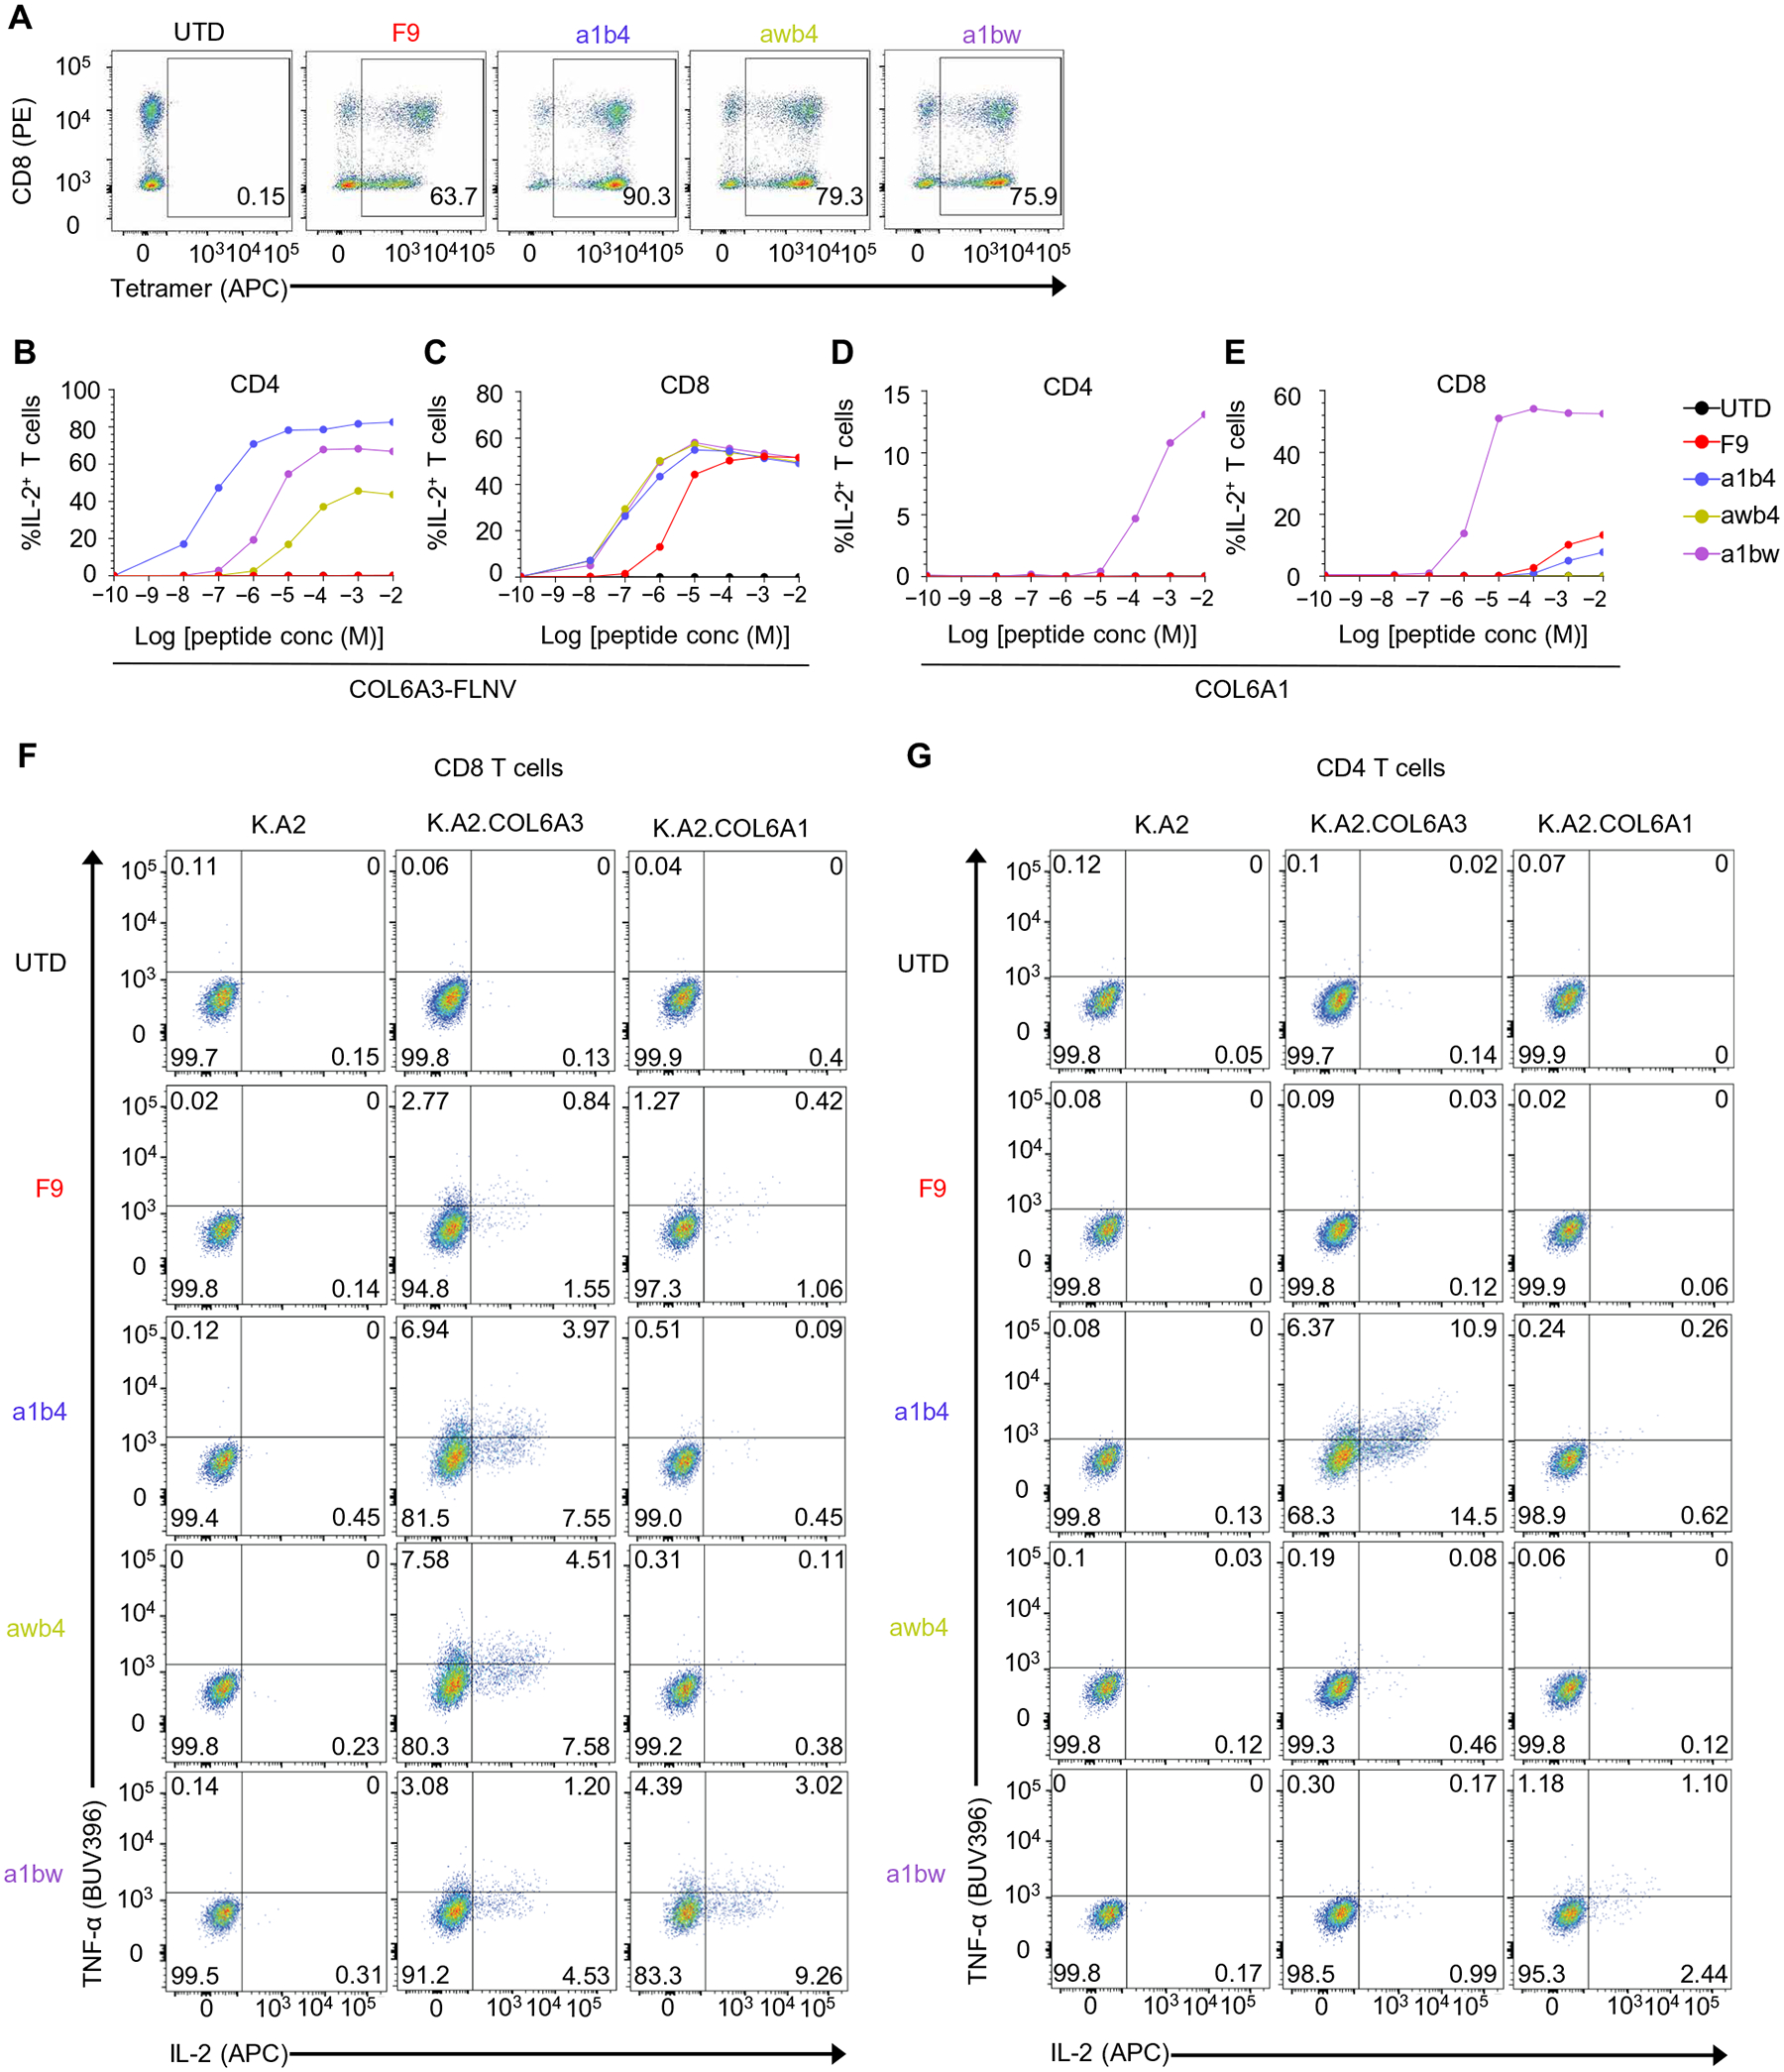
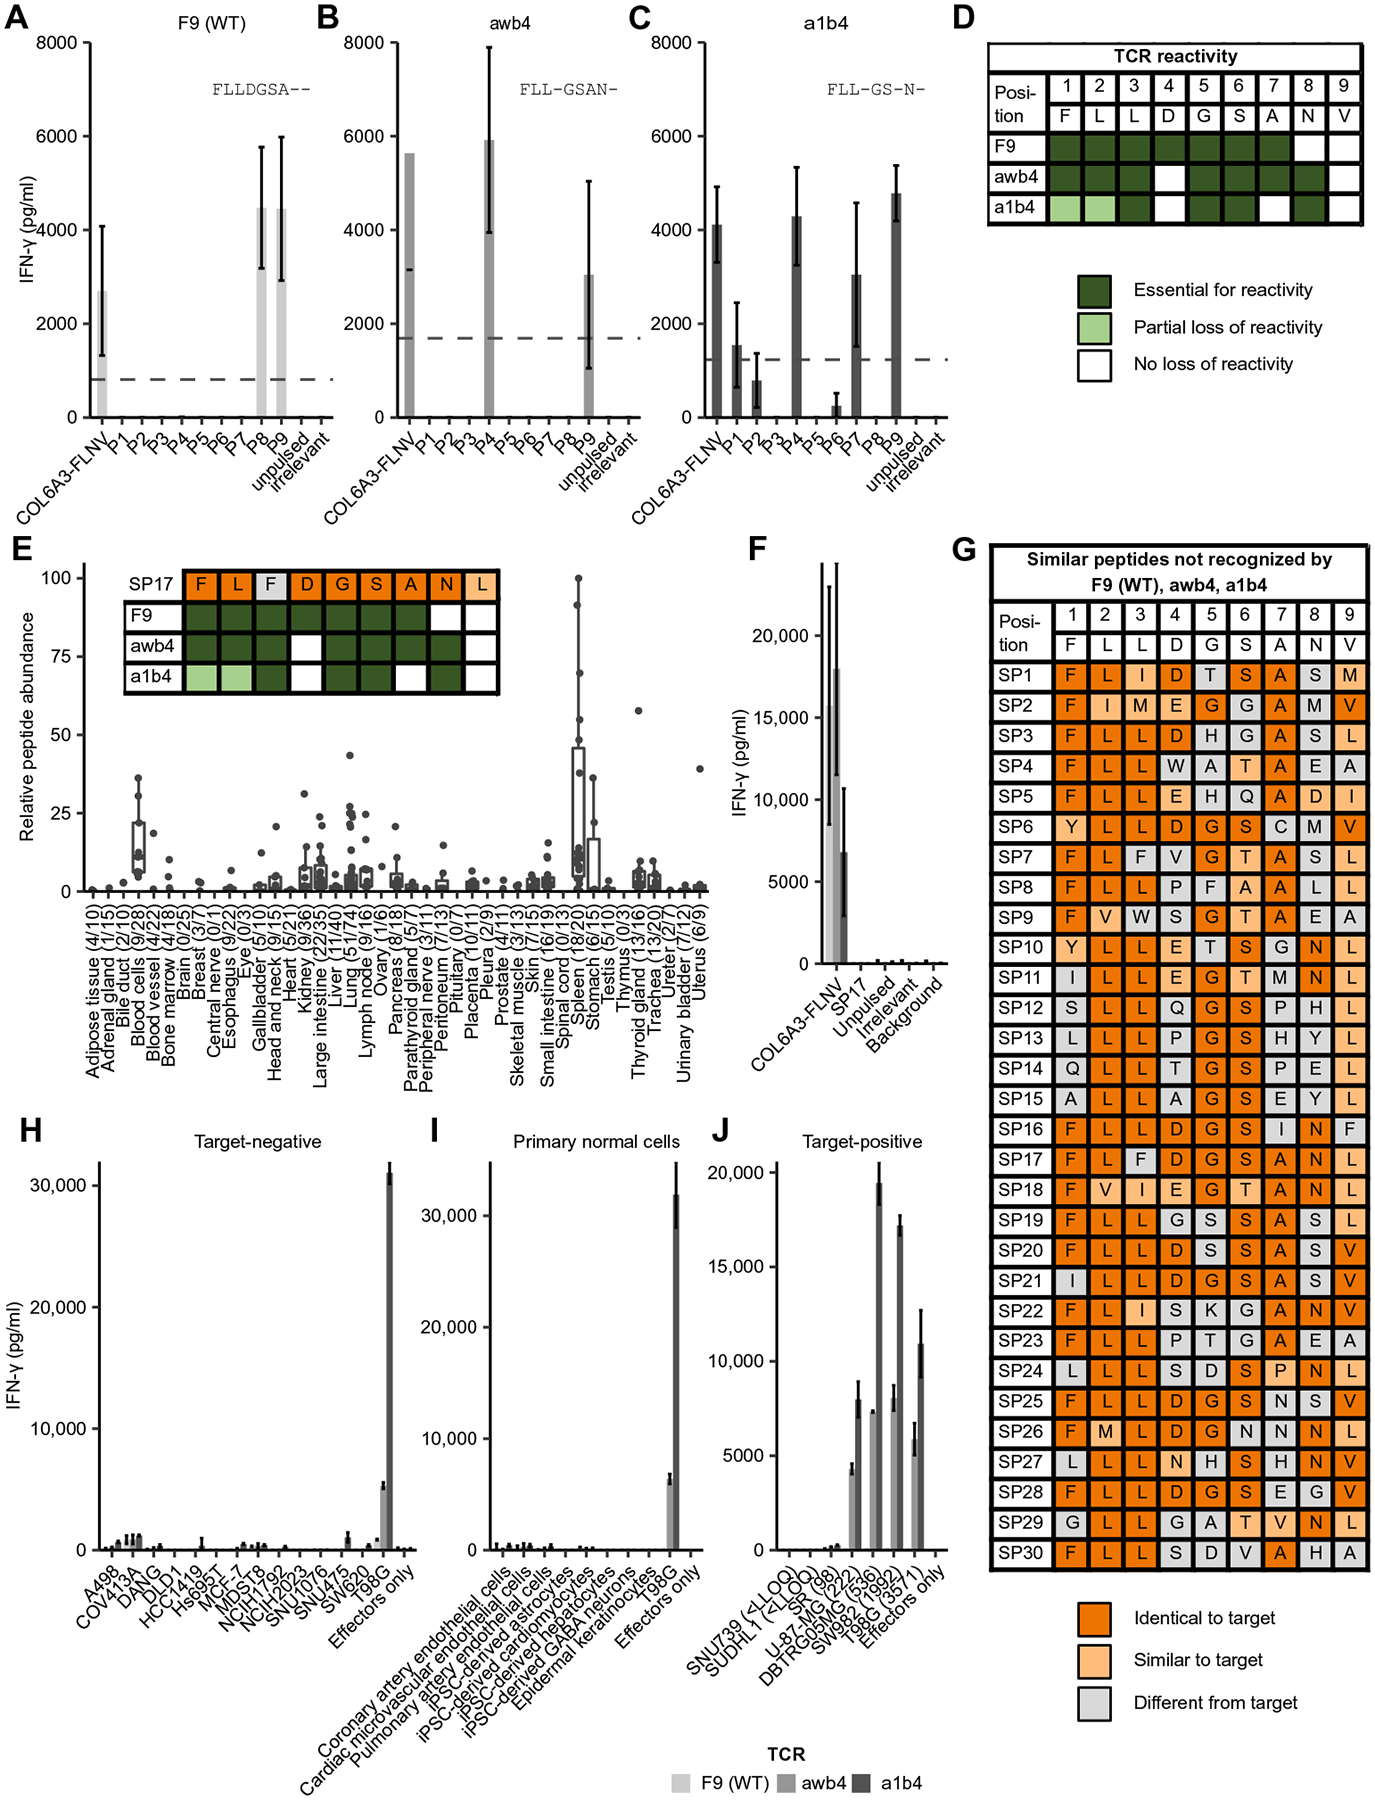
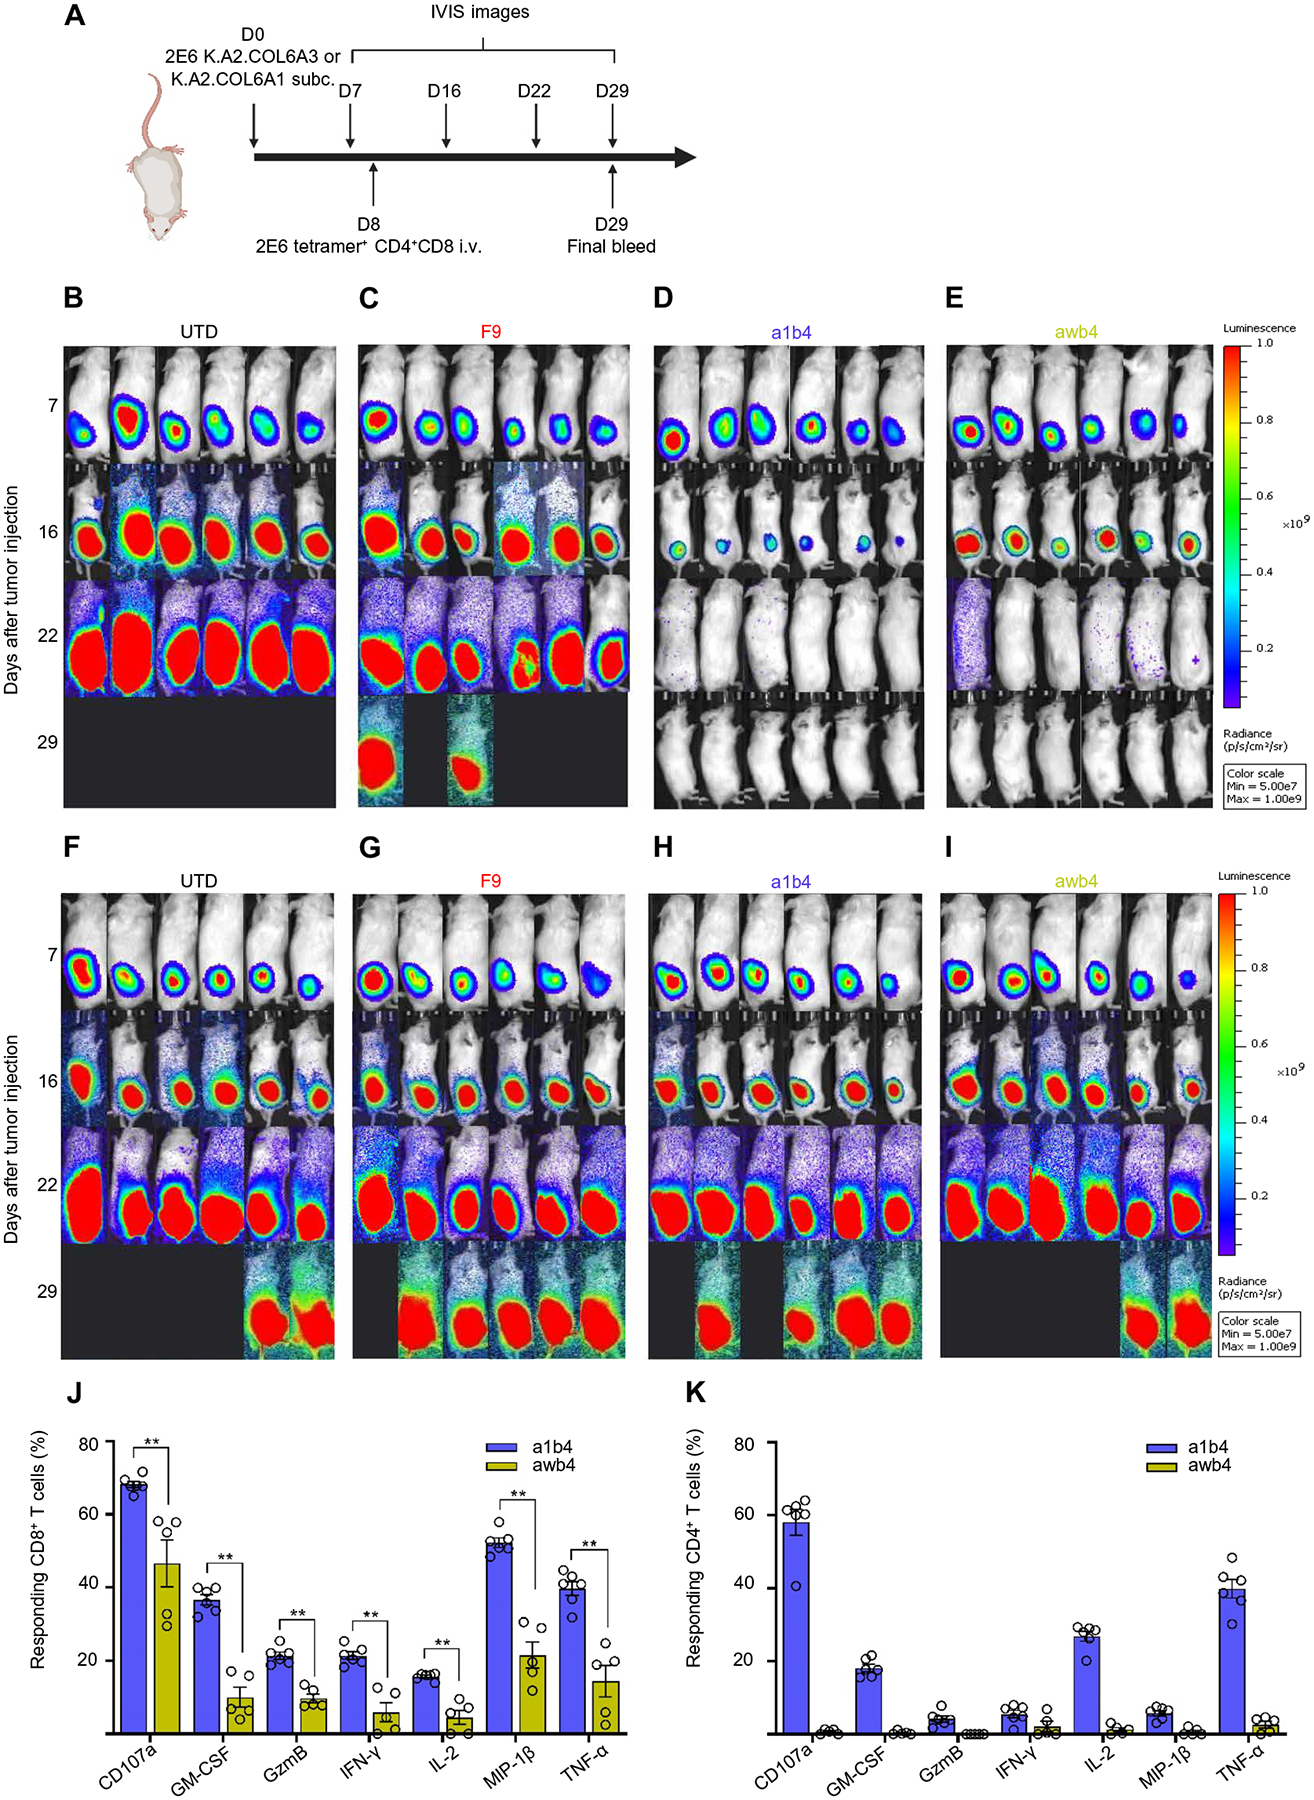
T cell receptor (TCR)-based immunotherapy has emerged as a promising therapeutic approach for the treatment of patients with solid cancers. Identifying peptide-human leukocyte antigen (pHLA) complexes highly presented on tumors and rarely expressed on healthy tissue in combination with high-affinity TCRs that when introduced into T cells can redirect T cells to eliminate tumor but not healthy tissue is a key requirement for safe and efficacious TCR-based therapies. To discover promising shared tumor antigens that could be targeted via TCR-based adoptive T cell therapy, we employed population-scale immunopeptidomics using quantitative mass spectrometry across ~1500 tumor and normal tissue samples. We identified an HLA-A*02:01-restricted pan-cancer epitope within the collagen type VI α-3 (COL6A3) gene that is highly presented on tumor stroma across multiple solid cancers due to a tumor-specific alternative splicing event that rarely occurs outside the tumor microenvironment. T cells expressing natural COL6A3-specific TCRs demonstrated only modest activity against cells presenting high copy numbers of COL6A3 pHLAs. One of these TCRs was affinity-enhanced, enabling transduced T cells to specifically eliminate tumors in vivo that expressed similar copy numbers of pHLAs as primary tumor specimens. The enhanced TCR variants exhibited a favorable safety profile with no detectable off-target reactivity, paving the way to initiate clinical trials using COL6A3-specific TCRs to target an array of solid tumors.


Conflict of interest statement

Competing interests: J.F., S.B., A.M., F.U., H. Schuster, D.J.K., V.G., M.O., D.F., M.B., C. Song, G.S., C. Schraeder, F.H., M.R., C.-C.T., M. Hofmann, T.T., M. Hutt, L.A., M.J., A.A., S.M., O.S., H. Singh, C.R., S.W., C.W., D.M., and T.W. were employees of Immatics in the course of this work and may have securities from Immatics. J.L.R. is a cofounder and holds an equity interest in Tmunity Therapeutics. C.R., H. Singh, S.W., and T.W. are management board members of Immatics. All other authors have no competing interests. The following patent applications relate to subject matter in this paper: PCT/EP2011/053863 (entitled “Novel Immunotherapy against several tumors including gastrointestinal and gastric cancer”), disclosing subject matter coinvented by J.F., H. Singh, S.W., and T.W.; PCT/EP2017/066630 (entitled “T cell receptors and immune therapy using the same”), disclosing subject matter coinvented by S.B., S.W., D.M., and L.A.; PCT/EP2018/080176 (entitled “Novel engineered T cell receptors and immune therapy using the same”), disclosing subject matter coinvented by S.B., F.U., M. Hofmann, M. Hutt, C.W., D.M., and L.A.; PCT/EP2014/066755 (entitled “Novel immunotherapy against several tumors, such as lung cancer, including NSCLC”), disclosing subject matter coinvented by J.F., C. Song, H. Singh, S.W., and T.W.; PCT/EP2016/055817 (entitled “Novel peptides and combination of peptides for use in immunotherapy against pancreatic cancer and other cancers”), disclosing subject matter coinvented by J.F., A.M., M.O., H. Singh, O.S., C.W., and T.W.; PCT/EP2016/059053 (entitled “Novel peptides and combination of peptides for use in immunotherapy against lung cancer, including NSCLC and other cancers”), disclosing subject matter coinvented by J.F., A.M., C. Song, H. Singh, O.S., C.W., and T.W.; PCT/EP2016/060007 [entitled “Novel peptides and combination of peptides and scaffolds thereof for use in immunotherapy against colorectal carcinoma (CRC) and other cancers”], disclosing subject matter coinvented by J.F., A.M., H. Singh, O.S., and T.W.; and PCT/EP2016/079059 (entitled “Peptides and combination of peptides for use in immunotherapy against breast cancer and other cancers”), disclosing subject matter coinvented by J.F., A.M., H. Singh, O.S., and T.W.

Figures

Fig. 1.
Fig. 1.. Population-scale immunopeptidomics and transcriptomics identify a shared pan-cancer epitope from a tumor-specific splice variant of COL6A3.
(A) Relative abundance of HLA-bound COL6A3-FLNV peptide isolated from tumor (red) and normal samples (blue). Each dot represents the median from five technical replicates of samples for which the peptide was detected and quantified. The number of donors with peptide detection, as well as the total number per group, is indicated in parentheses. (B) Absolute peptide copy numbers per cell were determined in a subset of samples. Each dot represents the mean across triplicates of each sample. (C) Heatmap of average log fold changes (FC) between tumor and average normal tissue samples for all protein-coding COL6A3 exons as determined by RNA sequencing. Missing log fold changes due to zero expression were indicated in gray. (D) Estimates for prevalence of patients positive for COL6A3-FLNV in selected tumor indications with exon 6 overexpression based on TCGA patient cohorts.
Fig. 2.
Fig. 2.. COL6A3-E6 expression is enriched within the tumor stroma.
(A) Representative images of serial sections of a gastric cancer FFPE sample with a tumor (T) marker probe set [pancytokeratin (panCK)], a stromal (S) marker probe set [smooth muscle actin α2 (ACTA2)], and a COL6A3-E6 probe set. Scale bars, 100 μm. Representative images of COL6A3-E6 ISH in (B) breast cancer (left) and head and neck squamous cell carcinoma (right) and (C) non–small cell lung carcinoma (left) and esophageal cancer (right). Insets on the right side of each picture show the same region on consecutive sections stained with H&E or reference negative and positive control probe sets for the bacterial gene locus of dihydrodipicolinate reductase (dapB) or human ubiquitin C (UBC), respectively. Probe set hybridization is visualized as punctate red dots or clusters of red dots using Fast Red. Chromogenic color detection varies between red and russet depending on the target signal intensity and the used kits. Nuclei are stained in violet blue by means of hematoxylin. In case of the H&E section, eosin stains the extracellular matrix and cytoplasm pink. Scale bars, 60 μm.
Fig. 3.
Fig. 3.. Natural COL6A3-FLNV–specific TCRs confer limited antitumor immunity in vivo.
(A) CD8 T cells were activated with anti-CD3/CD28 beads, transduced with the indicated TCR or left UTD, and stained with COL6A3-specific tetramer after 6 days of culture. Results are representative of three independent experiments with different donors performed in triplicate. (B) T cells from (A) after 11 days of culture were incubated with indicated artificial APCs (aAPCs) for 4 hours, and intracellular cytokine staining was performed. The average number of relevant pHLA copies per cell (pHLA-CpC) was determined by MS-based quantitation. Results are representative of three independent experiments with different donors performed in triplicate. Bioluminescence imaging of N6.COL6A3 (C) and N6.COL6A1 (D) tumors on the indicated days. Experimental schematic for in vivo study and survival curves of each on-target tumor group and off-target tumor groups can be found in fig. S5.
Fig. 4.
Fig. 4.. Affinity enhancement of a COL6A3-specific TCR imparts increased pHLA sensitivity and HLA class I recognition to CD4 T cells and maintained specificity to the target pHLA.
(A) A mixture of CD4 and CD8 T cells was activated with CD3/28-coated beads and left UTD or transduced with the indicated COL6A3-specific TCR. After 6 to 9 days of culture, a COL6A3-specific tetramer was used to stain the T cell populations. Results are representative of three independent experiments with different donors performed in triplicate. (B to E) K.A2 cells were loaded with indicated concentrations of (B and C) COL6A3-FLNV or (D and E) COL6A1-ILSV peptide and mixed with either (B and D) CD4 or (C and E) CD8 T cells expressing the indicated COL6A3-specific TCR. After 4 hours, intracellular IL-2 expression was measured by flow cytometry. (F and G) T cells from (A) were mixed with the indicated aAPCs for 4 hours, and TNF-α and IL-2 intracellular cytokine staining is shown for CD8 T cells (F) and for CD4 T cells (G). Results are representative of three independent experiments with different donors performed in triplicate.
Fig. 5.
Fig. 5.. T cells expressing affinity-enhanced COL6A3-specific TCRs recognize endogenously processed target and show no signs of off-target reactivity.
(A to C) Peptides containing a substitution at each position of the COL6A3-FLNV epitope were loaded on T2 cells and mixed with an equal number of T cells transduced with the parental COL6A3-FLNV–specific TCR F9 (A) or the COL6A3-FLNV–specific affinity-enhanced TCRs awb4 (B) or a1b4 (C). Bars show mean IFN-γ measured by enzyme-linked immunosorbent assay (ELISA), with error bars indicating the SD across four T cell donors. The dotted line indicates 30% of the COL6A3-FLNV IFN-γ secretion. Positions were defined as essential for T cell reactivity if responses for all donors were below this threshold. (D) Summary data highlighting TCR contact residues for each of the COL6A3-specific TCRs. Dark green indicates that the residue is essential for TCR recognition, light green indicates partial loss of activity due to mutation, and white indicates residues not important for TCR recognition. (E) Relative peptide abundance of HLA-A*02 peptide SP17 across 673 healthy tissue samples. The number of biological replicates is listed in parentheses for each group. Each dot represents the median of the quantified signals from five technical replicates. SP17 is identical to the target peptide COL6A3-FLNV in seven of nine residues and identical in six of seven residues that are essential for the target recognition of the awb4 TCR. Inset shows TCR recognition motif for each TCR overlaid with SP17. (F) SP17, COL6A3-FLNV, and control peptides were loaded on T2 cells, and the indicated TCR-transduced T cells were interrogated for IFN-γ secretion as above. (G) In total, 30 similar peptides based on the a1b4 and awb4 motifs were screened in IFN-γ secretion assays as described above, showing no recognition for any of the three COL6A3-specific TCRs. Identical and similar residues were indicated in dark and light orange shadings, respectively. Similarity was based on positive BLOSUM80 substitution matrix scores. (H to J) The indicated COL6A3-FLNV TCR-transduced primary human T cells were mixed with target-negative tumor cells (H), primary normal cells (I), or target-positive cells (J) at a 3:1 effector to target cell ratio for 48 hours. Bars show mean IFN-γ secretion measured by ELISA, and error bars indicate SD across three T cell donors. The number of COL6A3-FLNV CpC is listed in parenthesis. LLOQ, lower limit of quantitation; WT, wild type.
Fig. 6.
Fig. 6.. Adoptive transfer of T cells expressing affinity-enhanced COL6A3-specific TCRs are able to recognize and eliminate cells expressing pHLAs in a physiologic copy number range.
(A) Timeline and schematic of in vivo study. i.v., intravenous. (B to E) IVIS images of the K.A2.COL6A3-bearing NSG mice injected with UTD T cells (B), or T cells transduced with F9 TCR (C), a1b4 TCR (D), or awb4 TCR (E), respectively. (F to I) IVIS images of the K.A2.COL6A1-bearing NSG mice injected with UTD T cells (F), or T cells transduced with F9 TCR (G), a1b4 TCR (H), or awb4 TCR (I), respectively. Two million T cells expressing the indicated TCR were injected on day 8 after tumor injection. (J and K) At the study’s conclusion, splenocytes from non–tumor-bearing mice were isolated and incubated with K.A2.COL6A3 for 6 hours and percent of CD8 T cells (J) and percent of CD4 T cells (K) making the indicated cytokines are shown. Each dot represents T cells from an individual mouse. Wilcoxon rank sum test, two tailed was performed. *P < 0.05. Data are representative of three independent experiments. GM-CSF, granulocyte-macrophage colony-stimulating factor; GzmB, granzyme B.

References

    1. Schuster SJ, Svoboda J, Chong EA, Nasta SD, Mato AR, Anak O, Brogdon JL, Pruteanu-Malinici I, Bhoj V, Landsburg D, Wasik M, Levine BL, Lacey SF, Melenhorst JJ, Porter DL, June CH, Chimeric antigen receptor T cells in refractory B-cell lymphomas. N. Engl. J. Med 377, 2545–2554 (2017). - PMC - PubMed
    1. Guedan S, Ruella M, June CH, Emerging cellular therapies for cancer. Annu. Rev. Immunol 37, 145–171 (2019). - PMC - PubMed
    1. Majzner RG, Mackall CL, Tumor antigen escape from CAR T-cell therapy. Cancer Discov. 8, 1219–1226 (2018). - PubMed
    1. Schietinger A, Philip M, Schreiber H, Specificity in cancer immunotherapy. Semin. Immunol 20, 276–285 (2008). - PMC - PubMed
    1. Anderson KG, Stromnes IM, Greenberg PD, Obstacles posed by the tumor microenvironment to T cell activity: A case for synergistic therapies. Cancer Cell 31, 311–325 (2017). - PMC - PubMed

Publication types

Substances