. 2022 Oct 11;55(10):1891-1908.e12.
doi: 10.1016/j.immuni.2022.08.001. Epub 2022 Aug 30.

Innate type 2 immunity controls hair follicle commensalism by Demodex mites

Affiliations

Innate type 2 immunity controls hair follicle commensalism by Demodex mites

Roberto R Ricardo-Gonzalez et al. Immunity. .

Abstract

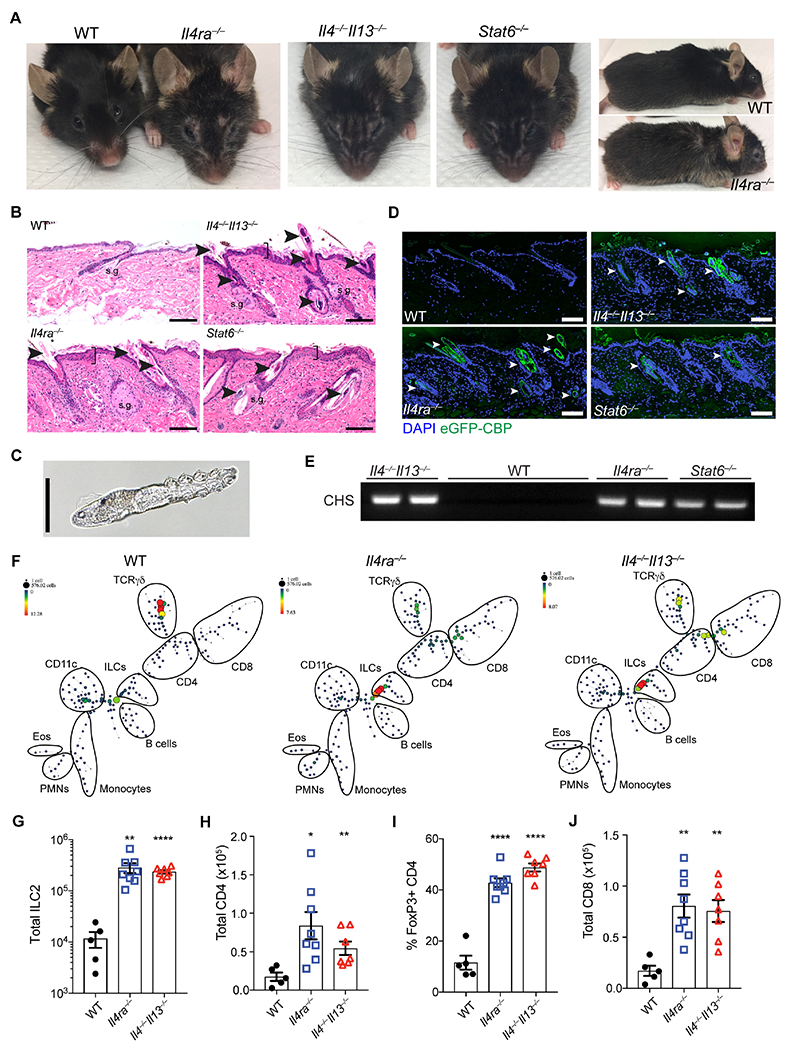
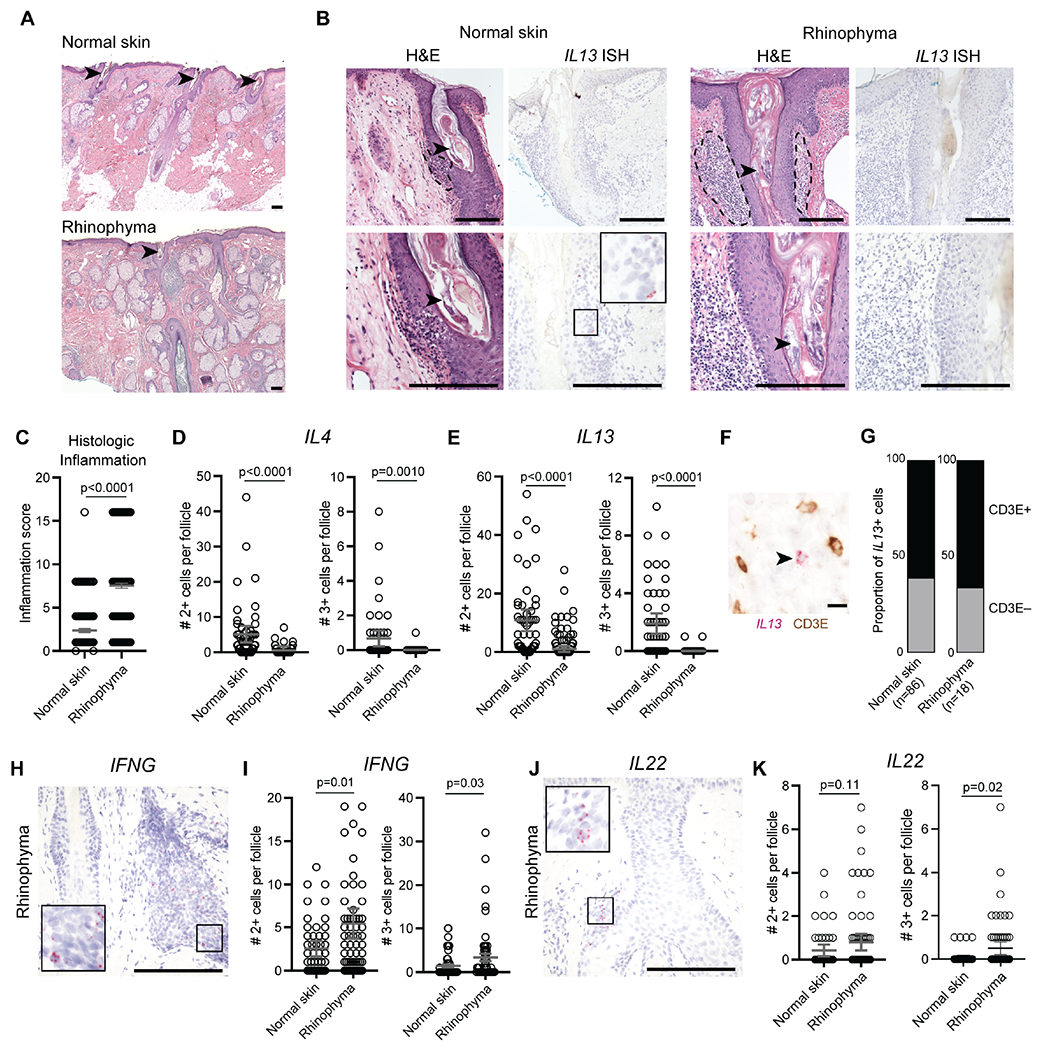
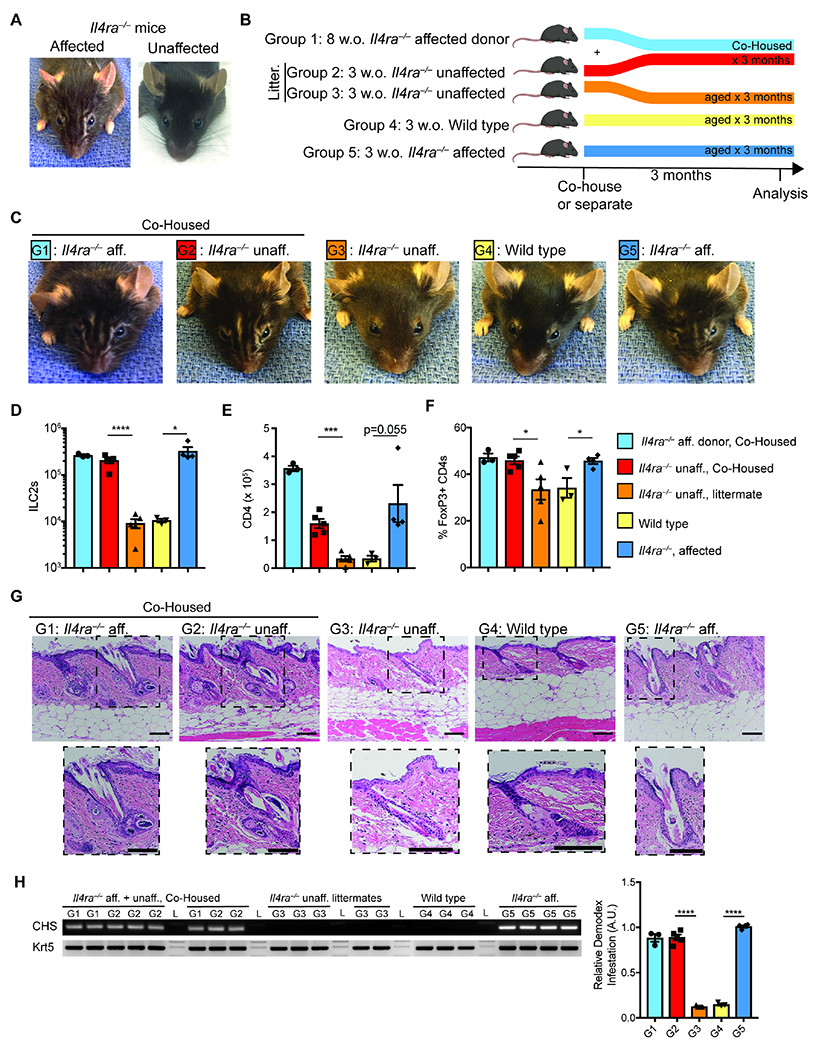
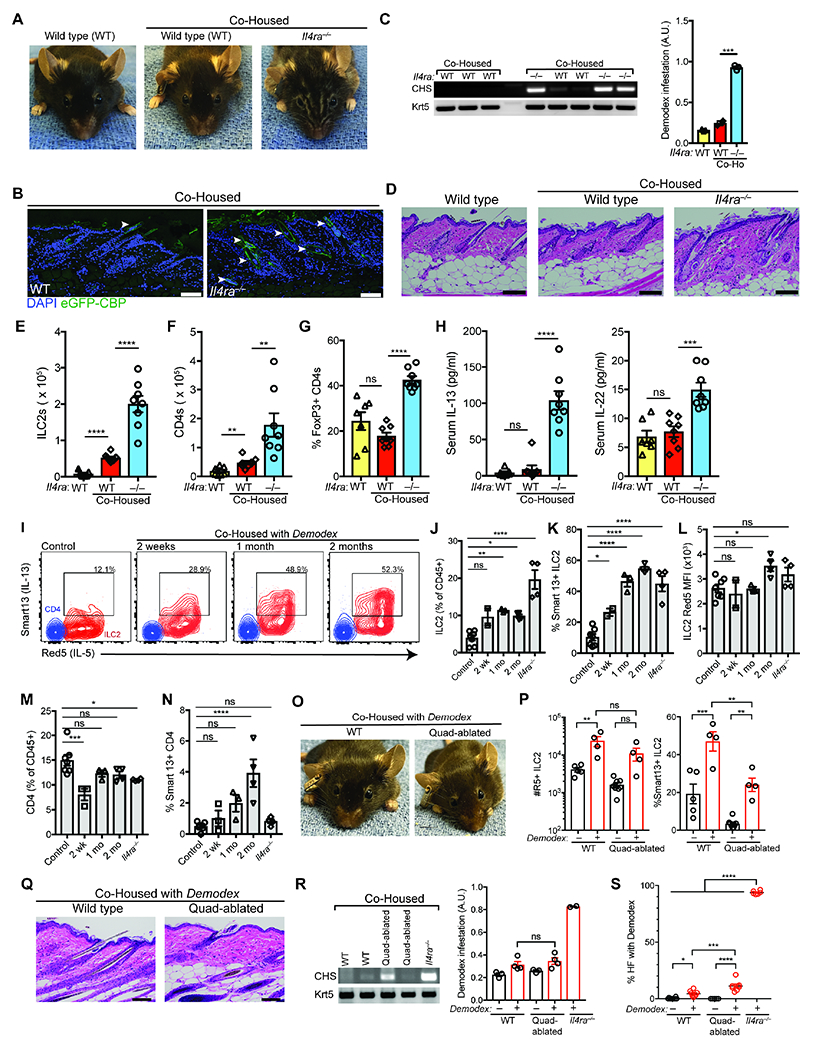
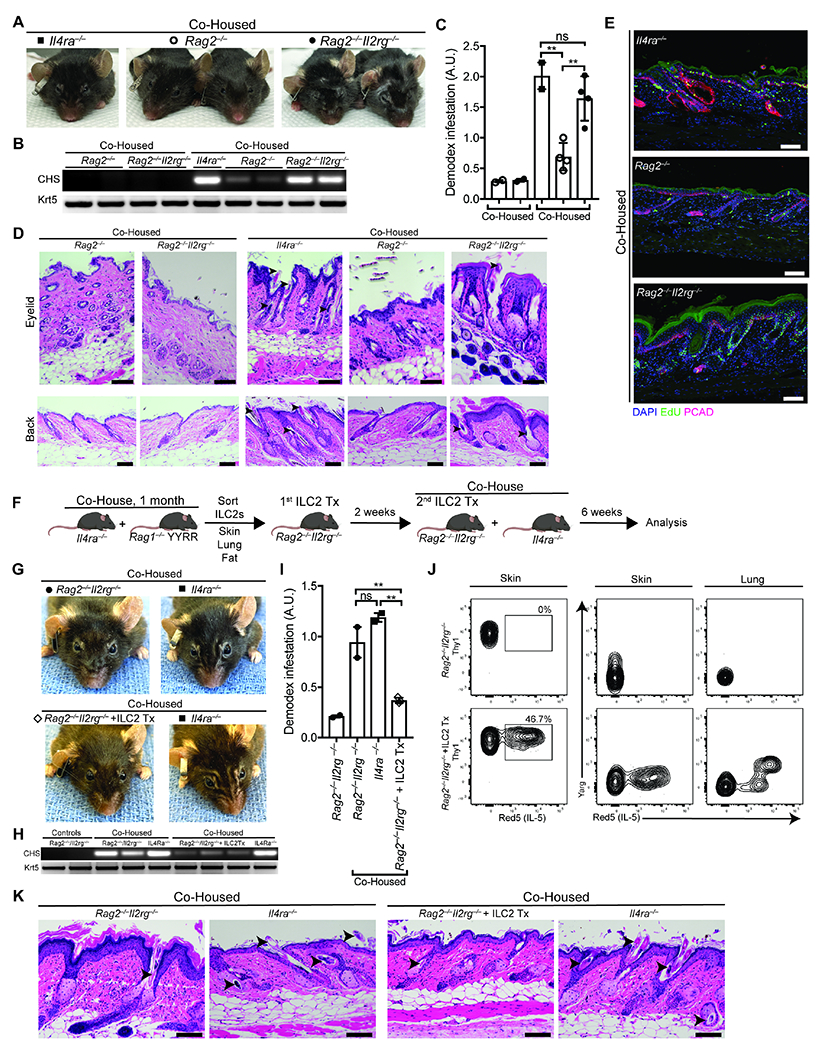
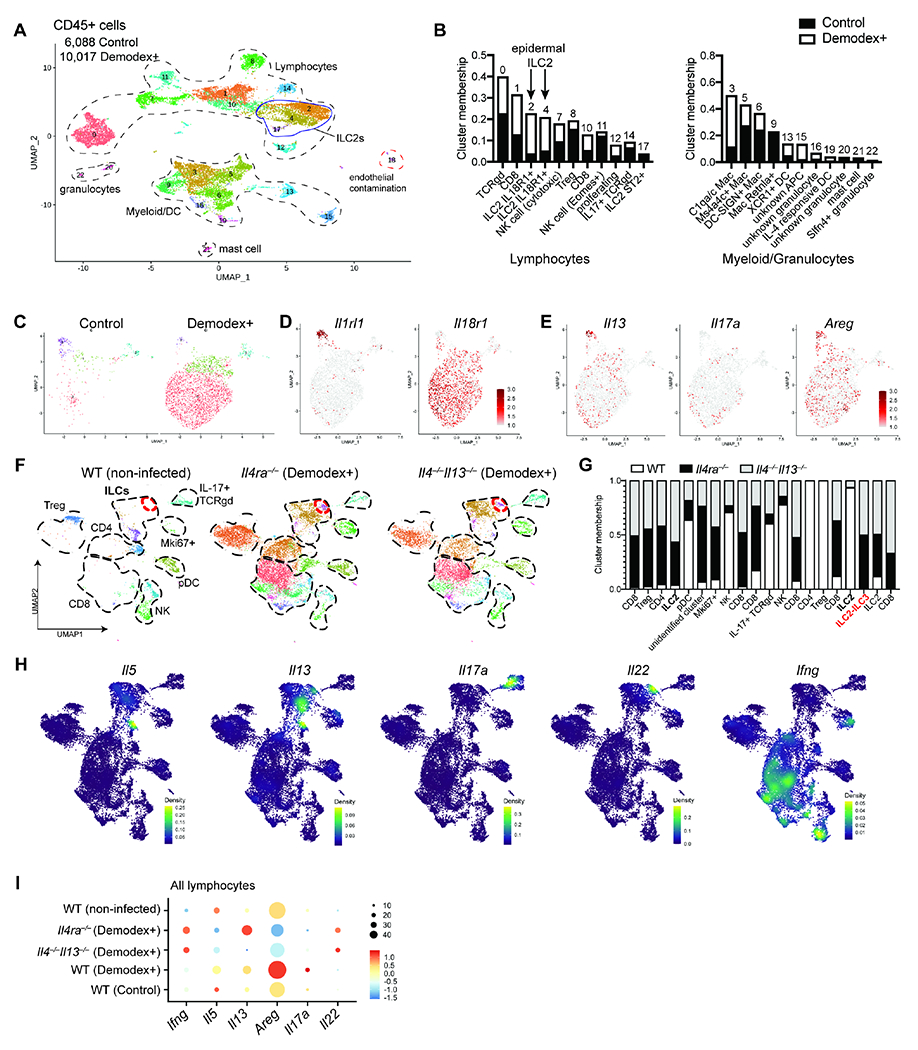
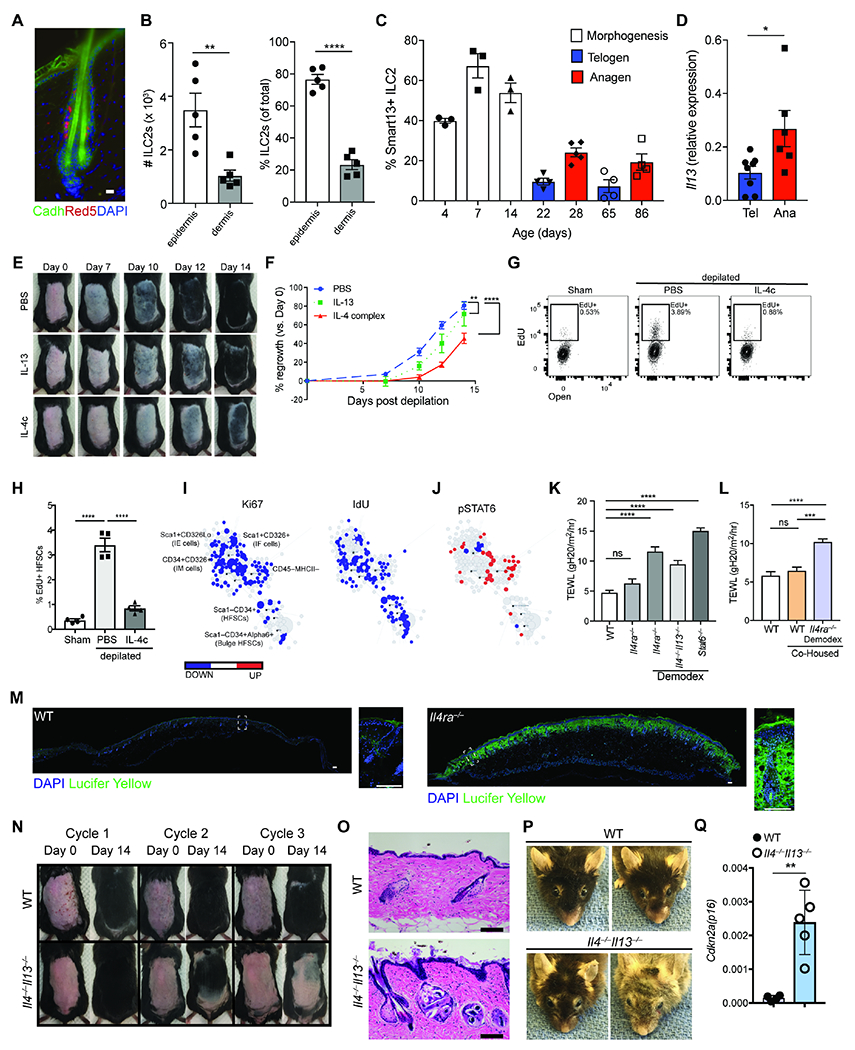
Demodex mites are commensal parasites of hair follicles (HFs). Normally asymptomatic, inflammatory outgrowth of mites can accompany malnutrition, immune dysfunction, and aging, but mechanisms restricting Demodex outgrowth are not defined. Here, we show that control of mite HF colonization in mice required group 2 innate lymphoid cells (ILC2s), interleukin-13 (IL-13), and its receptor, IL-4Ra-IL-13Ra1. HF-associated ILC2s elaborated IL-13 that attenuated HFs and epithelial proliferation at anagen onset; in their absence, Demodex colonization led to increased epithelial proliferation and replacement of gene programs for repair by aberrant inflammation, leading to the loss of barrier function and HF exhaustion. Humans with rhinophymatous acne rosacea, an inflammatory condition associated with Demodex, had increased HF inflammation with decreased type 2 cytokines, consistent with the inverse relationship seen in mice. Our studies uncover a key role for skin ILC2s and IL-13, which comprise an immune checkpoint that sustains cutaneous integrity and restricts pathologic infestation by colonizing HF mites.

Keywords: Demodex mites; IL-13; ILC2; barrier function; hair follicle stem cell; innate immunity; rhinophyma; skin homeostasis; tissue immunity; type 2 immunity.


Conflict of interest statement

Declaration of interests R.M.L. is a member of the Scientific Resource Board at Genentech and serves on the Advisory Board at Immunity.

Figures

Figure 1.
Figure 1.. Loss of type 2 immunity results in dermatitis associated with Demodex infestation.
(A) Representative facial and fur phenotype of wild type (WT), Il4ra−/−, Il4−/−,Il13−/− and Stat6−/− mice at homeostasis. Mice shown are retired male breeders at 18-20 months of age. (B) Skin sections from WT, Il4−/−,Il13−/−, Il4ra−/− or Stat6−/− mice stained with H&E. Arrowheads highlight infestation by Demodex mites in hair follicles and sebaceous glands. Brackets emphasize epidermal acanthosis, s.g., sebaceous gland. Scale bar, 100 μm. (C) Brightfield image of a Demodex mite from a fur pluck of Il4ra−/− mice. Scale bar, 50 μm. (D) Skin sections from WT, Il4−/−,Il13−/−, Il4ra−/− or Stat6−/− were stained for chitin (green) using an enhanced GFP chitin-binding domain fusion (eGFP-CBP) and DAPI (blue). Arrowheads highlight the Demodex mites. Scale bar, 100 μm. (E) PCR for Demodex chitin synthase (CHS) from fur plucks. Images are representative of n ≥ 5 mice of both sexes for each genotype. (F) SPADE representation of CD45+ cells from epidermal fraction of 8-10 weeks old WT, Il4ra−/−, and Il4−/−,Il13−/− mice. One representative plot shown, n = 4 individual mice per genotype. (G) Number of ILC2s in skin from WT, Il4ra−−, and Il4−/−,Il13−/− mice. (H) Total CD4 in skin from WT, Il4ra−−, and Il4−/−,Il13−/− mice. (I) Frequencies of skin Treg cells (CD3+CD4+FoxP3+, as a percentage of total CD4) in skin from WT, Il4ra−/−, and Il4−/−,Il13−/− mice at homeostasis. (J) Total CD8 in skin from WT, Il4ra−/−, and Il4−/−,Il13−/− mice. Data are from one representative experiment (F), or pooled from multiple independent experiments (G–J). * P < 0.05, ** P < 0.01, *** P < 0.001, **** P < 0.0001 by two-tailed Student’s t test (vs. WT). Please also see Figure S1.
Figure 2.
Figure 2.. Type 2 cytokines expression is associated with healthy Demodex commensalism in humans.
(A) Low power H&E stained sections of normal skin (top) and rhinophyma (bottom). (B) H&E stained sections (left panels) and corresponding IL13 mRNA in situ hybridization (ISH, right panels) in hair follicles infected with Demodex in representative cases of normal skin and rhinophyma. Arrowheads highlight Demodex infection of the hair follicle. Dashed lines highlight perifollicular inflammation. Scale bars, 250 μm. (C to E) Scoring of hair follicle inflammation (C) and quantification of IL4 (D) and IL13 (E) expression by ISH. (F and G) Representative co-stained section for IL13 by ISH and CD3ε by immunohistochemistry (F) and quantification of proportion of CD3+ or CD3 IL13-expressing cells (G). Arrowhead highlights IL13+CD3 cell. Scale bar, 10 μm. (H and I). Representative IFNG mRNA ISH (H) and quantification of IFNG expression (I) in hair follicles infected with Demodex. (J and K). Representative IL22 mRNA ISH (J) and quantification of IL22 expression (K) in hair follicles infected with Demodex. Scale bars, 250 μm. Statistical significance shown by * P < 0.05, ** P < 0.01, *** P < 0.001, **** P < 0.0001 by two-tailed Student’s t test.
Figure 3.
Figure 3.. Co-housing Demodex-infected with non-infected Il4ra−/− mice transfers the phenotype.
(A) Facial appearance of Il4ra−/− mice infected (affected) or uninfected (unaffected) with Demodex musculi. (B) Schematic of the co-housing experiment. 8 week-old (w.o.) Il4ra−/− mice infected with Demodex (Group 1) were co-housed with unaffected 3 w.o. Il4ra−/− mice (Group 2). Unaffected littermates of co-housed mice (Group 3) were allowed to age concurrently. WT (Group 4) and Il4ra−/− from known Demodex infected parents (Group 5) were aged as independent controls. (C) Representative mice at 3 months after the co-housing experiment. G1-G5 indicate experimental groups as outlined in (B). (D and E) Number of skin ILC2 (D) and CD4+ (E) cells in back skin. (F) Frequency of Treg cells (as percentage of total CD4) in back skin. (G) Sections from back skin were stained with H&E. Inset highlights Demodex infestation of the hair follicle and sebaceous glands. Scale bar, 100 μm. (H) PCR for Demodex chitin synthase gene (CHS, top) or genomic DNA for the keratin 5 gene (Krt5, bottom) from 2mm punches of back skin. Quantification of relative band intensity (CHS/Krt5) is shown on the right. Data are from one representative experiment of two independent experiments. Statistical significance shown by * P < 0.05, ** P < 0.01, *** P < 0.001, **** P < 0.0001 by two-tailed Student’s t test. Please also see Figures S2, S3 and S4.
Figure 4.
Figure 4.. Type 2 immunity sustains non-pathologic Demodex colonization.
(A) Representative wild type (WT), and co-housed WT with Demodex infested Il4ra−/− mice. Three week old WT and infested Il4ra−/− mice were co-housed for 12 weeks. (B) Skin sections from co-housed WT or Demodex infected Il4ra−/− were stained for chitin (eGFP-CBP, green) and DAPI (blue). Scale bar, 100 μm. (C) PCR for Demodex chitinase synthase gene (CHS, top) or genomic DNA for the keratin 5 gene (Krt5, bottom) from back skin. Quantification of relative Demodex infestation (CHS/Krt5) is shown on the right. (D) H&E-stained sections of back skin from WT, or co-housed WT and Il4ra−/− mice. Scale bar, 100 μm. (E–G) Number of skin ILC2s (E), total CD4 (F), and frequency of Treg cells (CD3+CD4+FoxP3+ T cells) as a percentage of total CD4 (G). (H) Quantification of serum IL-13 and IL-22. (I) IL-5 and IL-13 expression by ILC2s in Demodex infection. WT Il5tdTomato(Red5)/+, I13hCD4(Smart13)/+ littermates were separated (Control) or co-housed with infested Il4ra−/− mice (Co-housed) for 2 weeks (wk), 1 month (mo) or 2 mo. Flow cytometry plots show IL-5 and IL-13 expression by skin ILC2 (Red) or CD4 (blue). (J–L) Quantification of ILC2s (J), and their expression of IL-13 (hCD4, Smart13, (K)), and IL-5 (L). (M–N) Quantification of total CD4 (M) and their expression of IL-13 (hCD4, Smart13, (N)). (O) Representative wild type (WT), and Crlf2−/−,Il1rl1−/−,Il18−/−,Il25−/− (Quadablated) mice co-housed with Demodex infested Il4ra−/− mice. (P) Number of skin ILC2s and IL-13 expressing (Smart13) ILC2s. (Q) H&E-stained sections of back skin from WT, and Quadablated mice co-housed with Demodex-infected Il4ra−/− mice. Scale bar, 100 μm. (R) PCR for Demodex chitinase synthase gene (CHS, top) or genomic DNA for the keratin 5 gene (Krt5, bottom). (S) Quantification of percentage of hair follicles infected with Demodex. Data presented as mean ± s.e.m. Statistical significance shown by * P < 0.05, ** P < 0.01, *** P < 0.001, **** P < 0.0001 by one-way ANOVA. Please also see Figure S5.
Figure 5.
Figure 5.. ILC2s are sufficient to restrain Demodex infection.
(A) Representative Rag2−/− and Rag2−/−,Il2rg−/− co-housed with Demodex infested Il4ra−/− mice. 5-week old Rag2−/− and Rag2−/−,Il2rg−/− were co-housed with Demodex infested Il4ra−/− for 6 weeks. n = 3 to 5 mice per group, representative of two independent experiments. (B) PCR for Demodex chitinase synthase gene (CHS, top) or genomic DNA for the keratin 5 gene (Krt5, bottom) from back skin. (C) Quantification of relative Demodex infestation (CHS/Krt5) for the PCR in (B). (D) H&E-stained sections of eyelid (top) and back (bottom) skin from unaffected Rag2−/− and Rag2−/−,Il2rg−/− with or without co-housing with a Demodex infested Il4ra−/−. (E) Sections from back skin of co-housed Il4ra−/−, Rag2−/− and Rag2−/−, Il2rg−/− were stained for EdU (green), P-Cadherin (red) and DAPI (blue). (F) Schematic of the adoptive transfer experiment. Il4ra−/− mice infected with Demodex were co-housed with unaffected 4-8 w.o. Rag1−/− ArgYFP/YFP, Il5tdTomato(Red5)/tdTomato(Red5) (Ragl−/− YYRR) mice for 1 month. ILC2s (CD45+Lin Thy1+Red5+) were sorted from skin, lung, and fat, pooled, and transferred to Rag2−/−,Il2rg−/− mice two weeks prior and at the start of co-housing (see methods). (G) Representative Rag2−/−,Il2rg−/− treated with PBS (top) or with transferred ILC2s (bottom) after 6 weeks of co-housing with Demodex infected Il4ra−/−. (H) PCR for Demodex chitinase synthase gene (CHS, top) or genomic DNA for the keratin 5 gene (Krt5, bottom) from back skin. (I) Quantification of relative Demodex infestation (CHS/Krt5) for the PCR in (H). (J) Flow cytometry plots of ILCs (pre-gated on Live CD45+LinThy1+) showing IL-5 expression (left panels) or Arginase (middle and right panels) on skin and lung as indicated. (K) H&E-stained sections of back skin from Rag2−/−,Il2rg−/− treated with PBS or ILC2 adoptive transfer and co-housed with Demodex infested Il4ra−/−. n = 3 to 5 mice per condition. Arrowheads highlight Demodex mites. Scale bars, 100 μm. For the ILC2 transfer experiments, a representative mouse is shown from 2 independent experiments with n = 2-3 mice per group. Please also see Figure S6.
Figure 6.
Figure 6.. scRNA-seq of CD45+ cells from Demodex-infected WT and type 2 immunodeficient mice reveal divergent responses.
(A) UMAP projection of CD45+ cells from skin of WT uninfected and Demodex-infected mice. (B) Bar plot showing the percentage of cells in each cluster for all lymphocyte (left) and myeloid and granulocyte (right) populations by experimental condition. (C) UMAP projection of ILC subclustering analyses showing experimental condition. (D) Feature plot of ILC subclusters showing expression of genes associated with ILC2 subset identity in skin. (E) Feature plots showing expression of genes for Il13, Il17a, and Areg. (F) UMAP projection of the skin lymphocyte fraction of WT (uninfected), and Il4ra−/− or Il4−/−,Il13−/− (Demodex-infected) mice showing subset of lymphocytes. Red circle denotes ILC2-ILC3 population present only in Il4ra−/− or Il4−/−,Il13−/− samples. (G) Bar plot showing the percentage of cells in each cluster for the samples in (F). (H) Density plots from the combined object as in F, showing the expression for selected cytokines. (H) Dot plot of a combined analysis for all lymphocytes in all samples. Please also see Figure S7.
Figure 7.
Figure 7.. Type 2 immunity sustains skin barrier and HF regeneration after perturbation.
(A) Localization of IL-5 producing ILC2s (red) within the skin epithelium. E-cadherin (green) is used to highlight hair follicles. DAPI is represented in blue. Scale bar, 20 μm. (B) Quantification (left) or percentage (right) of ILC2s (CD45+LinThy1+Red5+) in the epidermis and dermis of adult Il5Red5/+ mice. (C) Quantification of expression of IL-13 by ILC2s throughout the various stages of the hair follicle cycle. (D) Quantitative PCR for Il13 expression by ILC2s (CD45+Lin Thy1+Red5+) sorted from mice back skin in telogen or anagen stage of the hair cycle. (E) Effect of IL-4 and IL-13 subcutaneous injection in hair growth. Wild type C57BL/6 mice were treated with PBS, IL-13 or IL-4 complex (IL-4c) on the first 2 days after depilation (Days 0 and 1) and their hair regrowth pattern was tracked over 2 weeks. One representative mouse per treatment arm is shown. (F) Quantification of hair regrowth from PBS, IL-4c, or IL-13 treated mice as in (E). (G) Representative flow cytometry panel of hair follicle stem cells (HFSCs, pre-gated as CD45MHCIICD34+Alpha6+) incorporation of EdU. Mice were depilated and treated with IL-4 complex (IL-4c) on the first two days after depilation. Mice were harvested on day 4 after depilation. (H) Percent EdU+ HFSCs four days after depilation as in (G). (I) Scaffold maps of Ki67 and IdU for the CD45 epidermal cell fraction as analyzed by CyTOF (see methods). Black nodes represent canonical cell populations identified manually as noted in the top left scaffold map. Blue denotes the population has significant lower expression frequency of the marker (Ki67, or IdU, as denoted in the columns) in the experimental arm (IL-4 complex treated WT mice) vs. WT controls; red denotes significantly higher frequency. n = 4 individual mice per group. (J) Scaffold maps for phospho(p)STAT6 in IL-4 complex treated mice compared to WT controls. Blue and red colors denote statistically significant decrease or increase in expression frequency, respectively, in each cluster compared to the control group (q < 0.05 by SAM). (K) Transepidermal water loss at homeostasis in WT, Il4ra−/− and Demodex-infested Ilra4−/−, Il4−/−Il13−/−, and Stat6−/− mice. (L) Transepidermal water loss at homeostasis in WT or WT mice co-housed with Demodex-infested Il4ra−/− mice. (M) Lucifer yellow barrier assay. WT or Il4ra−/− were shaved and depilated. Two days post-depilation, the epidermal surface was exposed to Lucifer Yellow overnight at 37 °C. Lucifer yellow in green, DAPI in blue. Scale bar, 100 μm. (N) Repeated depilation of wild type (WT) and Il4−/−Il13−/− mice. A representative animal from n = 4 individual mice shown. (O) Sections from back skin of WT and Il4−/−,Il13−/− mice after 3 cycles of depilation were stained with H&E. Scale bar, 100 μm. (P) Representative images of 2 year-old (yo) WT and Il4−/−Il13−/− mice. (Q) qPCR for Cdkn2a(p16) from sorted HFSCs from age-matched 2 yo WT and Il4−/−Il13−/− mice. Data presented as mean ± s.e.m and are representative of at least two independent experiments with n ≥ 3 mice per individual group/time point, pooled from two independent cohorts with n=5-10/group (K, L) or representative from an experiment with n ≥ 4 per group (P, Q). *P < 0.05, **P < 0.01, ***P < 0.001, and ****P < 0.0001 as calculated with two-tailed Student’s t test (A to D, Q) or ANOVA (F, H, K, L).

Comment in

  • A hairy situation for ILC2s.
    Kobayashi T, Moro K. Kobayashi T, et al. Immunity. 2022 Oct 11;55(10):1756-1758. doi: 10.1016/j.immuni.2022.09.009. Immunity. 2022. PMID: 36223723

References

    1. Ali N, Zirak B, Rodriguez RS, Pauli ML, Truong HA, Lai K, Ahn R, Corbin K, Lowe MM, Scharschmidt TC, et al. (2017). Regulatory T Cells in Skin Facilitate Epithelial Stem Cell Differentiation. Cell 169, 1119–1129 e1111. - PMC - PubMed
    1. Anderson MJ (2001). A new method for non-parametric multivariate analysis of variance. Austral Ecology 26, 32–46.
    1. Bair E, and Tibshirani R (2004). Semi-supervised methods to predict patient survival from gene expression data. PLoS Biol 2, E108. - PMC - PubMed
    1. Bando JK, Liang HE, and Locksley RM (2015). Identification and distribution of developing innate lymphoid cells in the fetal mouse intestine. Nat Immunol 16, 153–160. - PMC - PubMed
    1. Bando JK, Nussbaum JC, Liang HE, and Locksley RM (2013). Type 2 innate lymphoid cells constitutively express arginase-I in the naive and inflamed lung. J Leukoc Biol 94, 877–884. - PMC - PubMed

Publication types