. 2022 Nov;611(7934):139-147.
doi: 10.1038/s41586-022-05273-0. Epub 2022 Aug 31.

Dysregulated naive B cells and de novo autoreactivity in severe COVID-19

Affiliations

Dysregulated naive B cells and de novo autoreactivity in severe COVID-19

Matthew C Woodruff et al. Nature. 2022 Nov.

Abstract

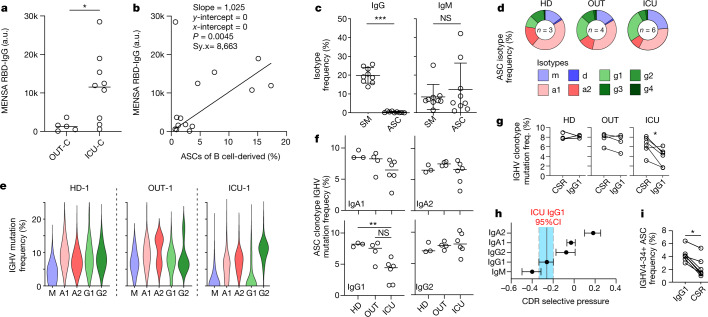
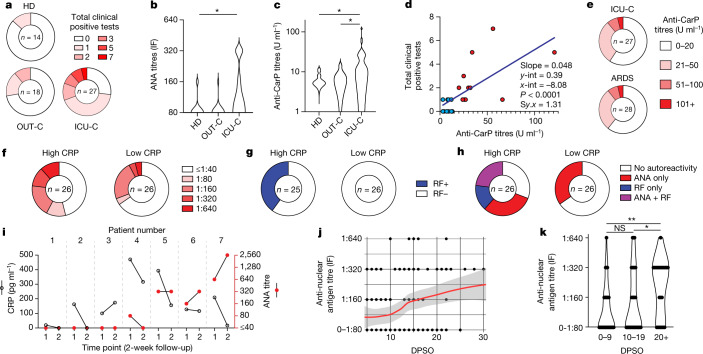
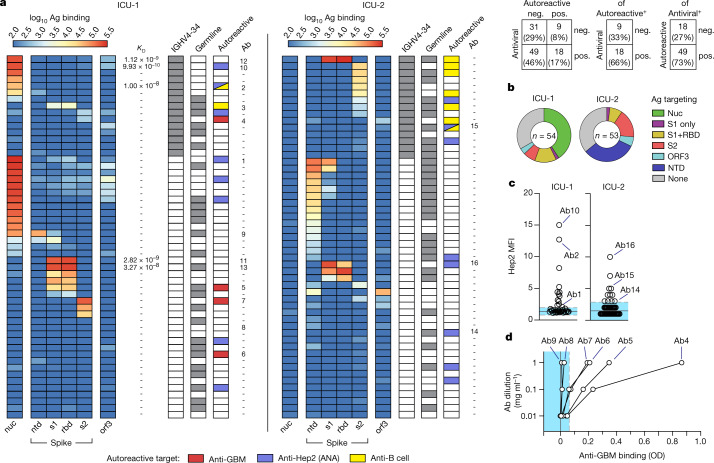
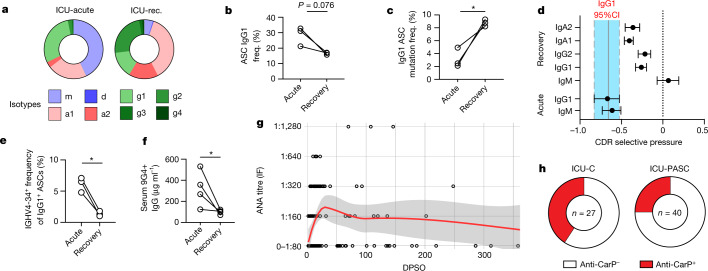
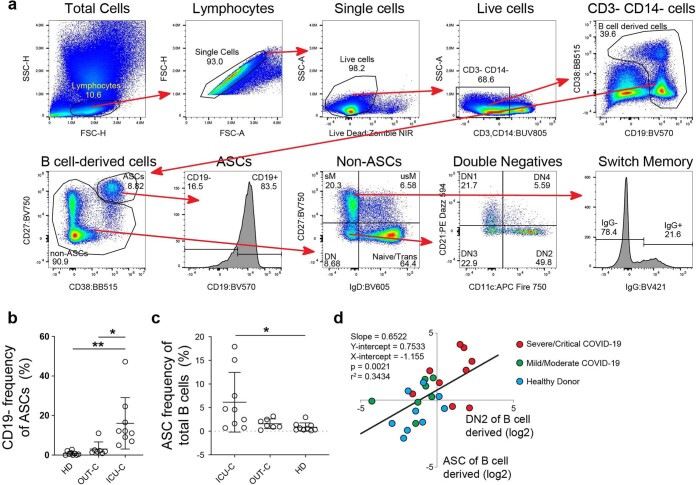
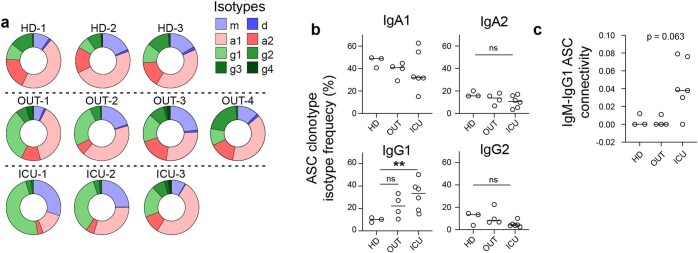
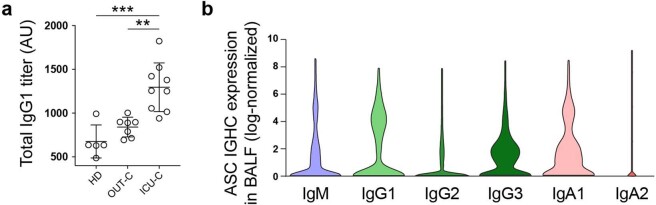
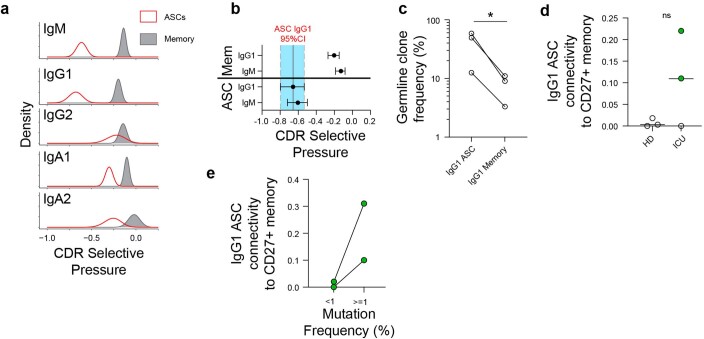
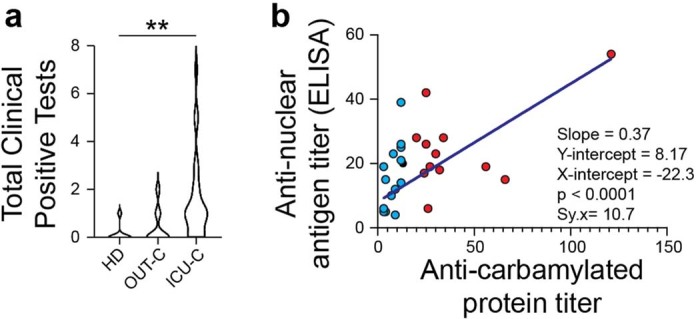
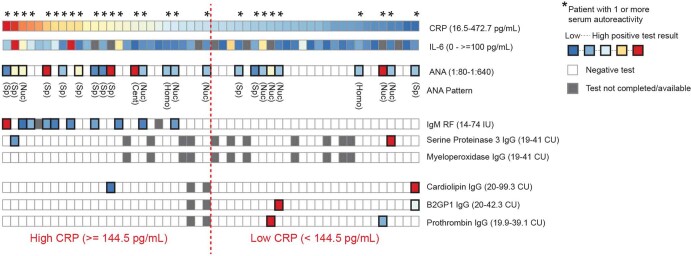
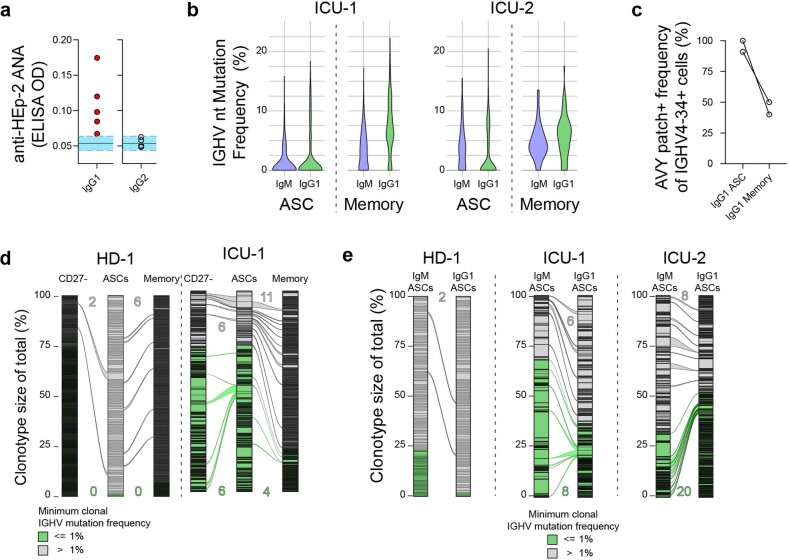
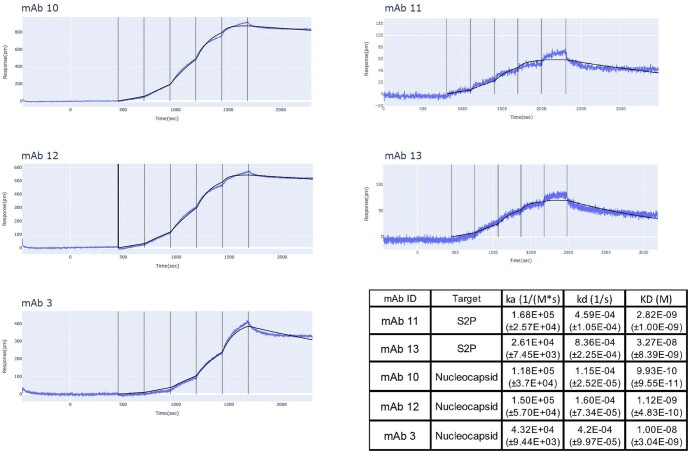
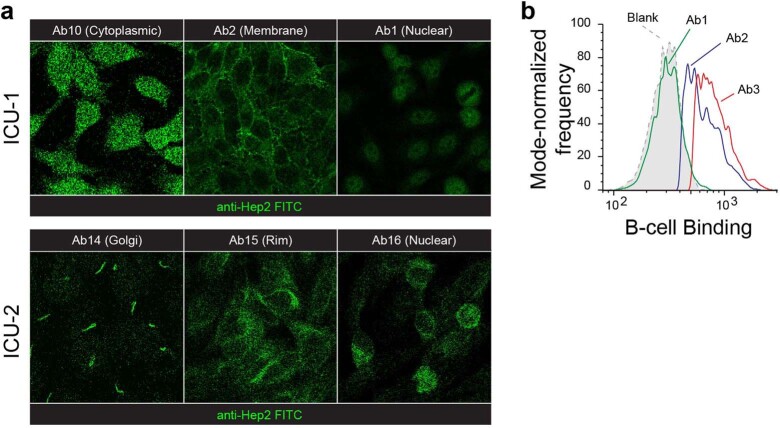
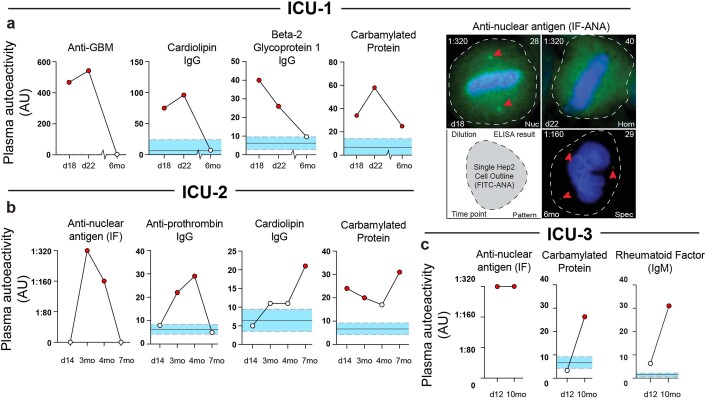
Severe SARS-CoV-2 infection1 has been associated with highly inflammatory immune activation since the earliest days of the COVID-19 pandemic2-5. More recently, these responses have been associated with the emergence of self-reactive antibodies with pathologic potential6-10, although their origins and resolution have remained unclear11. Previously, we and others have identified extrafollicular B cell activation, a pathway associated with the formation of new autoreactive antibodies in chronic autoimmunity12,13, as a dominant feature of severe and critical COVID-19 (refs. 14-18). Here, using single-cell B cell repertoire analysis of patients with mild and severe disease, we identify the expansion of a naive-derived, low-mutation IgG1 population of antibody-secreting cells (ASCs) reflecting features of low selective pressure. These features correlate with progressive, broad, clinically relevant autoreactivity, particularly directed against nuclear antigens and carbamylated proteins, emerging 10-15 days after the onset of symptoms. Detailed analysis of the low-selection compartment shows a high frequency of clonotypes specific for both SARS-CoV-2 and autoantigens, including pathogenic autoantibodies against the glomerular basement membrane. We further identify the contraction of this pathway on recovery, re-establishment of tolerance standards and concomitant loss of acute-derived ASCs irrespective of antigen specificity. However, serological autoreactivity persists in a subset of patients with postacute sequelae, raising important questions as to the contribution of emerging autoreactivity to continuing symptomology on recovery. In summary, this study demonstrates the origins, breadth and resolution of autoreactivity in severe COVID-19, with implications for early intervention and the treatment of patients with post-COVID sequelae.


Conflict of interest statement

F.E.L. is the founder of MicroB-plex, Inc., and has research grants with Genentech. M.E.R. is employed by Exagen, Inc. M.P. is employed by Nicoya.

Figures

Fig. 1
Fig. 1. Expansion of low-selection IgG1 ASC compartment is a hallmark of severe COVID-19.
a,b, MENSA samples from OUT-C (n = 7) or ICU-C (n = 9) patients were analysed for IgG reactivity against the SARS-CoV-2 RBD. RBD-specific IgG antibody in MENSA samples collected from OUT-C and ICU-C patients (a). Linear correlation of RBD-specific IgG antibody in MENSA samples versus ASC frequency of B cell-derived cells in OUT-C and ICU-C patients (b). IgG+ and IgM+ frequency of total switch memory (SM) or ASC populations from the ICU-C cohort (c). di, ASCs from the HD (n = 3), OUT-C (n = 4) and ICU-C (n = 6) cohorts were sorted for single B cell repertoire sequencing and subsequent analysis. Average ASC isotype compositions of HD, OUT-C and ICU-C individuals (d). Representative ASC mutation frequency distributions by isotype in HD-1, OUT-1 and ICU-1 individuals (e). IGHV gene nucleotide mutation frequencies of the indicated ASC isotypes in HD, OUT-C and ICU-C individuals (f). IGHV gene nucleotide mutation frequencies of IgG1 versus other class-switched ASCs from the indicated cohort (g). BASELINe selection analysis of CDR selection in ICU-C ASCs, grouped by isotype. Bars represent 95% confidence intervals (CI) in the group (h). IGHV4-34+ ASC frequency in IgG1 versus other class-switched ASCs (i). In a, c, g and i, statistical significance was determined using two-tailed t-test between the indicated groups. In g and i, paired analyses were used. In f, statistical significance was determined using analysis of variance with Tukey’s multiple-comparisons testing between all groups. In ai, *P ≤ 0.05; **P ≤ 0.01; ***P ≤ 0.001. In a, c, and f, summary statistics are mean ± s.d. In h, summary statistics are mean ± 95% CI. a.u., arbitrary units; freq., frequency; NS, not significant. Source data
Fig. 2
Fig. 2. Characterizing clinical autoreactivity profiles in COVID-19.
ae, HD, OUT-C, ICU-C and ARDS patient frozen plasma was tested against a variety of autoantigens in Exagen’s clinical laboratory. Frequency of total positive clinical tests across the HD, OUT-C and ICU-C cohorts (a). Distribution of ANA titres across the HD, OUT-C and ICU-C cohorts (b). Distribution of anti-CarP titres across the HD, OUT-C and ICU-C cohorts (c). Linear regression of anticarbamylated protein titres versus total number of patient autoreactive breaks across the ICU-C cohort. Patients with positive anti-CarP titres are highlighted in red (d). Frequency of anti-CarP responses, broken down by titre in HD, OUT-C, ICU-C and bacterially induced ARDS cohorts (e). f, Frequency of ANA titres in high versus low CRP patients in the independent ICU cohort. g, Frequency of RF-positive tests in high versus low CRP patients in the independent ICU cohort. h, Frequency of ANA- and RF-positive tests in high versus low CRP patients in the independent ICU cohort. i, Two-week follow-up testing of seven patients from the independent ICU cohort. CRP and ANA titres are shown. j, k, Immunofluorescence (IF) ANA titres were assessed for the combined patient cohorts (Fig. 2a,f), alongside a further 50 ICU patients (total n = 129). ANA reactivity as a function of time after symptom onset. Red line indicates LOESS regression with 95% CI (j). Time-point-binned assessment of IF ANA reactivity (k). In b, c and k, statistical significance was determined using analysis of variance with Tukey’s multiple-comparisons testing between all groups. *P ≤ 0.05; **P ≤ 0.01; ***P ≤ 0.001. Source data
Fig. 3
Fig. 3. IgG1 clonotypes are both antiviral and autoreactive.
a, Overview of clonotype (mAb) testing from patients ICU-1 and ICU-2 (total n = 107). Clonotypes were selected from the IgG1+ low-selection compartment described in Figs. 1,2. Left: heatmaps of mAb (rows) binding to indicated antigens (columns). Middle: KD, antibody affinities confirmed through HT-SPR; IGHV4-34, clonotype encodes IGHV4-34 receptor; germline, clonotype shows germline heavy and light chain configurations; autoreactive, clonotype shows autoreactivity against indicated autoantigen. Right: Ab designation to aid tracking throughout Fig. 4. b, SARS-CoV-2 antigen targeting across all 107 mAbs. c, MFI measurements of Hep2 cell line reactivity by synthesized mABs using immunofluorescence. Selected mAb designations are indicated (Fig. 4a). d, Anti-GBM ELISA testing of isolated mAbs (optical density, OD). Selected clonotype designations are indicated (Fig. 4a). In c and d, summary statistics are mean negative test value ±3 s.d. pos., positive; neg., negative.
Fig. 4
Fig. 4. Relaxed peripheral tolerance resolves in the repertoire on recovery.
a, Average isotype frequencies at acute and recovery time points from ICU-C patient cohort (180–300 days post symptom onset (DPSO), n = 3). b, IgG1 ASC isotype frequency in acute and recovery ICU-C cohorts. c, IGHV nucleotide mutation frequency in IgG1 ASCs in acute versus recovery samples in ICU-C cohort. d, ASC selective pressure comparisons of selected isotypes from acute or recovery ICU-C cohort. Bars represent 95% CI in the group. e, IGHV4-34+ ASC frequency in IgG1 ASCs in acute versus recovery samples in acute and recovery ICU-C cohorts. f, ELISA assessment of IGHV4-34+ IgG plasma antibody concentration in acute and recovery ICU-C cohorts (n = 4). g, IF ANA titres were assessed for the combined acute patient cohorts (Fig. 2j), alongside 45 ICU patients at the indicated recovery time points (total n = 174). ANA reactivity was assessed as a function of time after symptom onset. Red line indicates LOESS regression with 95% CI. h, Frequency of anti-CarP positive reactivity in acute (n = 27) versus recovery (n = 40) ICU-C cohorts. In b, c, e and f, statistical significance was determined using paired two-tailed t-test between the indicated groups. *P ≤ 0.05; **P ≤ 0.01. rec., recovery. Source data
Extended Data Fig. 1
Extended Data Fig. 1. EF B cell activation in COVID-19.
(a–d) PBMCs were isolated from HD (n = 9), OUT-C (n = 7), or ICU-C (n = 10) patients and analyzed by spectral flow cytometry. (a) Progressive gating strategy for flow cytometry. Label above plot indicated pre-gating population from previous plot. (b) CD19- ASC frequency of total ASCs. (c) ASC frequency of total B cell-derived cells. (d) Linear regression analysis of log2-transformed DN2 vs ASC frequencies of total B cell-derived cells. (b, c) Statistical significance was determined using ANOVA with Tukey’s multiple-comparisons testing between all groups. *P ≤ 0.05; **P ≤ 0.01; ***P ≤ 0.001.
Extended Data Fig. 2
Extended Data Fig. 2. IgM-connected IgG1 ASC expansion in severe/critical COVID-19.
(a–c) ASCs from HD (n = 3), OUT-C (n = 4), or ICU-C (n = 6) patient cohorts were sorted for single B cell repertoire sequencing and subsequent analysis. (a) Isotype frequencies of individual patients within the ICU-C, OUT-C, and HD cohorts (b) ASC subclass frequencies by indicated isotype in HD, OUT-C, and ICU-C cohorts. (c) Clonotype connectivity between IgM and IgG1 ASCs in HD, OUT-C and ICU-C cohorts. (b, c) Statistical significance was determined using ANOVA with Tukey’s multiple-comparisons testing between all groups. *P ≤ 0.05; **P ≤ 0.01; ***P ≤ 0.001.
Extended Data Fig. 3
Extended Data Fig. 3. IgG1 ASCs are present in the BAL.
(a) Statistical significance was determined using ANOVA with Tukey’s multiple-comparisons testing between all groups. *P ≤ 0.05; **P ≤ 0.01; ***P ≤ 0.001. (a) Bulk IgG1 assessment in HD, OUT-C, or ICU-C cohorts. (b) Gene expression of indicated constant region in ASCs identified in the bronchoalveolar fluid from 10 ICU patients. Retrospective analysis of data collected by Grant et. al.
Extended Data Fig. 4
Extended Data Fig. 4. Low-mutation IgG1 ASCs are uncoupled from the contemporaneous memory.
(a-e) Single cell VDJ analysis of ASCs and memory compartments from ICU-C patients (n = 3) (a,b) BASELINe selection analysis of CDR selection in ASC vs. memory B cell populations, grouped by isotype (n = 4). (b) Statistical selective pressure comparisons of selected isotypes. Bars = 95% CI (c) Frequency of clonotypes whose most expanded member maintains germline heavy and light chain BCR configuration from IgG1+ ASC or CD27+ memory compartments. (d) Clonotype connectivity between IgG1+ ASCs and the contemporaneous CD27+ memory compartment. Patients displaying any connectivity highlighted in green. (e) Relative clonal connectivity between mutated (>=1% mutation) versus unmutated (<1%) IgG1+ ASCs and the contemporaneous memory. Only two patients showing active connection between the compartments [2d] are evaluated. (c) Statistical significance was determined using paired two-tailed t-testing between indicated groups. *P ≤ 0.05; **P ≤ 0.01.
Extended Data Fig. 5
Extended Data Fig. 5. Severe COVID-19 correlates with increased autoreactivity against multiple autoantigens.
(a, b) HD, OUT-C, and ICU-C patient frozen plasma was tested against a variety of autoantigens in Exagen’s clinical laboratory. (a) Distribution of total positive clinical tests across the HD, OUT-C, and ICU-C cohorts. (b) Linear regression of anti-carbamylated protein titers vs. anti-nuclear antigen titers across the ICU-C cohort. Patients with positive anti-CarP titers are highlighted in red.
Extended Data Fig. 6
Extended Data Fig. 6. Autoreactivity against clinical autoantigens correlates with inflammation.
Heatmap display of Emory pathology-confirmed clinical results of 52 SARS-CoV-2 ICU patients with US NIH “severe” or “critical” clinical designations. Patients are organized by ascending CRP values (range 16.5-472.7). Individual testing scale values are indicated following the test name.
Extended Data Fig. 7
Extended Data Fig. 7. Phenotypes of patients selected for antibody screening.
(a) ANA ELISA testing of 5 ICU-C patients with positive clinical testing as determined by Exagen, Inc. [Fig. 2a]. ELISAs were developed with isotype specific IgG1 and IgG2 secondary probes. Red dots indicate positive tests (b) Mutation frequency distributions of ICU-1 and ICU-2 ASC and CD27+ memory compartments of indicated isotypes. (c) Frequency of autoreactivity-mediating ‘AVY’ patch integrity in IgG1 ASCs versus IgG1 memory in patients ICU-1 and ICU-2. (d) Alluvial plots showing clonotype connectivity between IgG1 ASCs to the CD27- or memory compartments. Individual clonotypes represented by vertical banding, with the height of the band reflective by the number of cells incorporated into the clonotype. Clonotypes with minimum mutation frequencies <= 1% are highlighted in green. (e) Alluvial plots showing clonotype connectivity between IgG1 ASCs to the IgM ASC compartment. Clonotypes with minimum mutation frequencies <= 1% are highlighted in green.
Extended Data Fig. 8
Extended Data Fig. 8. SPR-based affinity testing of naïve-derived, low mutation monoclonal antibodies.
Representative raw data (blue), and model fitting (black) are displayed for each of the 5 antibodies tested for affinity via HT-SPR. Summary table displays the target, on rate (Ka), off rate (Kd), and affinity (KD), with associated standard deviations in parentheses.
Extended Data Fig. 9
Extended Data Fig. 9. Autoantigen reactivity screening of naïve-derived, low mutation monoclonal antibodies.
(a) Representative staining patterns from select mAbs with reactivity against the Hep2 cell line as identified in [Fig. 2c]. Select clonotype designations indicated [Fig. 2a] (b) Naive B cell binding of two monoclonal antibodies as identified in [Fig. 2a].
Extended Data Fig. 10
Extended Data Fig. 10. Longitudinal clinical autoreactivity profiles of patients ICU1-3.
(a–c) Samples obtained at all time points from patients ICU-1:3 were sent to Exagen, Inc. for broad autoreactivity testing in their clinical laboratory. All clinical positive tests for each patient are displayed. Red dots indicate a positive clinical value. (a) Clinical positive tests for patient ICU-1 at indicated time points. (b) Clinical positive tests for patient ICU-2 at indicated time points. (c) Clinical positive tests for patient ICU-3 at indicated time points.

Update of

References

    1. Andersen KG, Rambaut A, Lipkin WI, Holmes EC, Garry RF. The proximal origin of SARS-CoV-2. Nat. Med. 2020;26:450–452. doi: 10.1038/s41591-020-0820-9. - DOI - PMC - PubMed
    1. Chen X, et al. Detectable serum severe acute respiratory syndrome coronavirus 2 viral load (RNAemia) is closely correlated with drastically elevated interleukin 6 level in critically ill patients with coronavirus disease 2019. Clin. Infect. Dis. 2020;71:1937–1942. doi: 10.1093/cid/ciaa449. - DOI - PMC - PubMed
    1. Henderson LA, et al. On the alert for cytokine storm: immunopathology in COVID-19. Arthritis Rheumatol. 2020;72:1059–1063. doi: 10.1002/art.41285. - DOI - PMC - PubMed
    1. Group RC, et al. Dexamethasone in hospitalized patients with Covid-19. N. Engl. J. Med. 2021;384:693–704. doi: 10.1056/NEJMoa2021436. - DOI - PMC - PubMed
    1. Cao X. COVID-19: immunopathology and its implications for therapy. Nat. Rev. Immunol. 2020;20:269–270. doi: 10.1038/s41577-020-0308-3. - DOI - PMC - PubMed

Publication types