

Model misspecification and bias for inverse probability weighting estimators of average causal effects
- PMID: 36045099
- PMCID: PMC10087564
- DOI: 10.1002/bimj.202100118
Model misspecification and bias for inverse probability weighting estimators of average causal effects
Abstract
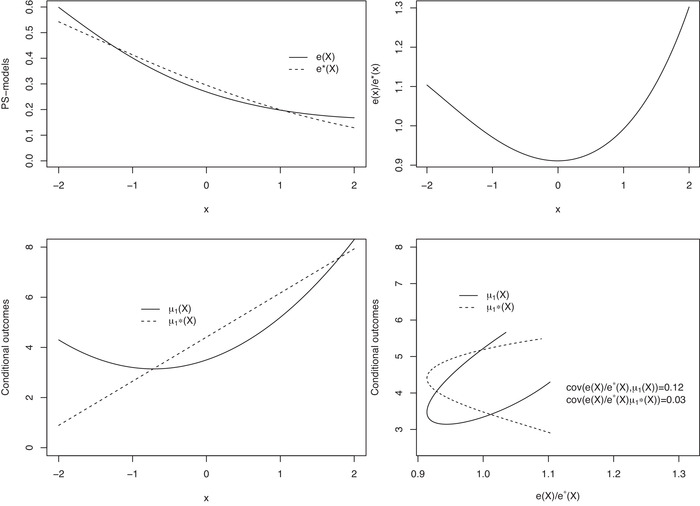
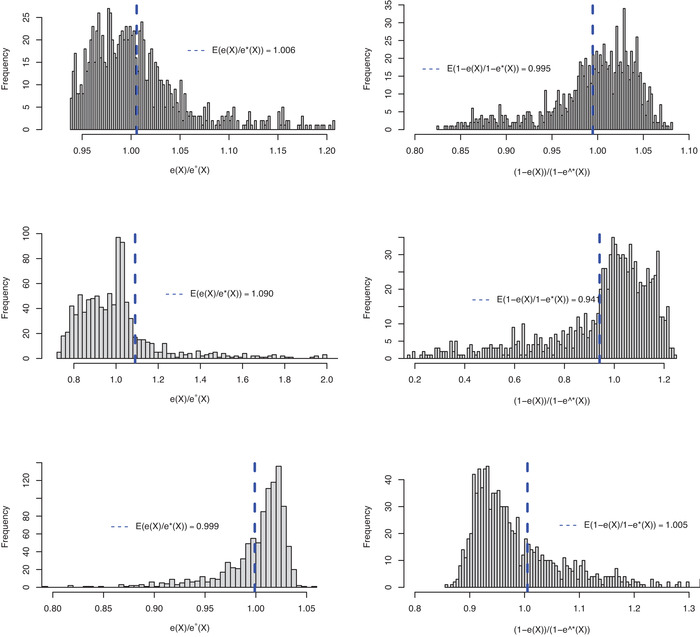
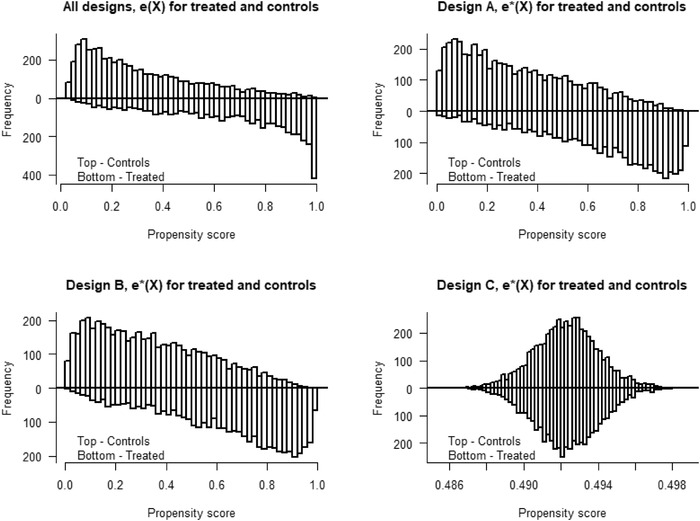
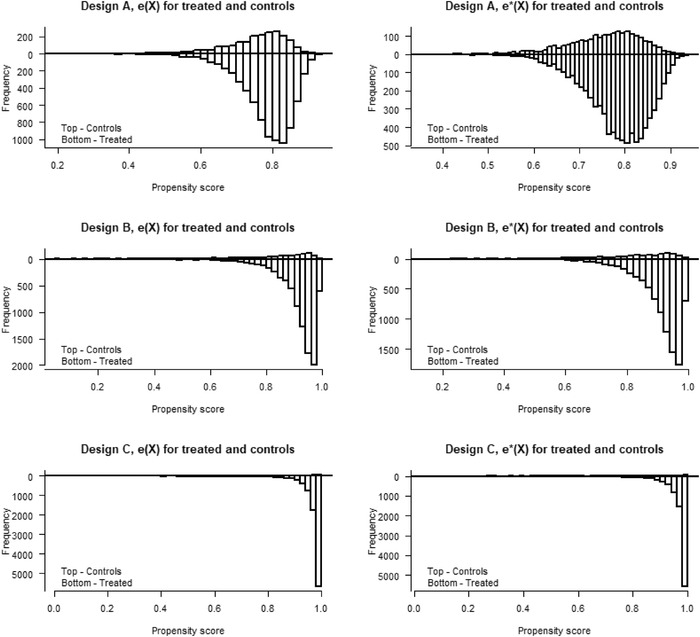
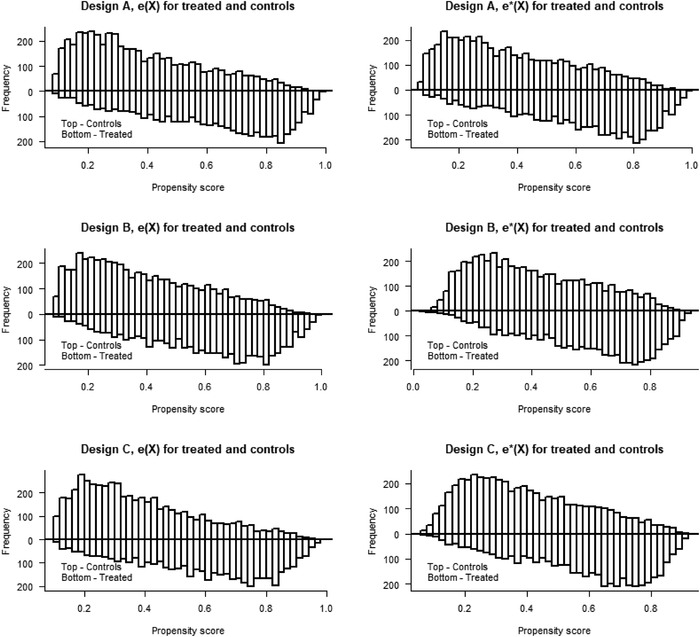
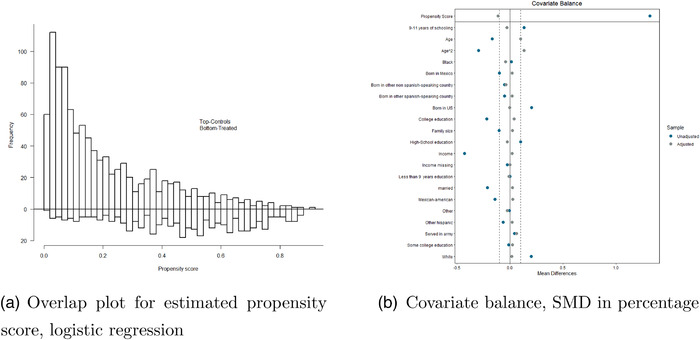
Commonly used semiparametric estimators of causal effects specify parametric models for the propensity score (PS) and the conditional outcome. An example is an augmented inverse probability weighting (IPW) estimator, frequently referred to as a doubly robust estimator, because it is consistent if at least one of the two models is correctly specified. However, in many observational studies, the role of the parametric models is often not to provide a representation of the data-generating process but rather to facilitate the adjustment for confounding, making the assumption of at least one true model unlikely to hold. In this paper, we propose a crude analytical approach to study the large-sample bias of estimators when the models are assumed to be approximations of the data-generating process, namely, when all models are misspecified. We apply our approach to three prototypical estimators of the average causal effect, two IPW estimators, using a misspecified PS model, and an augmented IPW (AIPW) estimator, using misspecified models for the outcome regression (OR) and the PS. For the two IPW estimators, we show that normalization, in addition to having a smaller variance, also offers some protection against bias due to model misspecification. To analyze the question of when the use of two misspecified models is better than one we derive necessary and sufficient conditions for when the AIPW estimator has a smaller bias than a simple IPW estimator and when it has a smaller bias than an IPW estimator with normalized weights. If the misspecification of the outcome model is moderate, the comparisons of the biases of the IPW and AIPW estimators show that the AIPW estimator has a smaller bias than the IPW estimators. However, all biases include a scaling with the PS-model error and we suggest caution in modeling the PS whenever such a model is involved. For numerical and finite sample illustrations, we include three simulation studies and corresponding approximations of the large-sample biases. In a dataset from the National Health and Nutrition Examination Survey, we estimate the effect of smoking on blood lead levels.
Keywords: average causal effects; comparing biases; outcome model; propensity score.
© 2022 The Authors. Biometrical Journal published by Wiley-VCH GmbH.
Figures
References
-
- Bang, H. , & Robins, J. M. (2005). Doubly robust estimation in missing data and causal inference models. Biometrics, 61(4), 962–973. - PubMed
-
- Boos, D. D. , & Stefanski, L. (2013). M‐estimation (estimating equations). In Boos D. D. & Stefanski L. A. (Eds.), Essential statistical inference (Vol. 120, pp. 297–337). Springer.
-
- Busso, M. , DiNardo, J. , & McCrary, J. (2014). New evidence on the finite sample properties of propensity score reweighting and matching estimators. Review of Economics and Statistics, 96(5), 885–897.
-
- Chang, S.‐H. , Chou, I.‐J. , Yeh, Y.‐H. , Chiou, M.‐J. , Wen, M.‐S. , Kuo, C.‐T. , See, L.‐C. , & Kuo, C.‐F. (2017). Association between use of non‐vitamin k oral anticoagulants with and without concurrent medications and risk of major bleeding in nonvalvular atrial fibrillation. JAMA, 318(13), 1250–1259. - PMC - PubMed
Publication types
MeSH terms
Substances
Grants and funding
LinkOut - more resources
Full Text Sources
