. 2022 Aug 31;13(1):5124.
doi: 10.1038/s41467-022-32787-y.

OXTRHigh stroma fibroblasts control the invasion pattern of oral squamous cell carcinoma via ERK5 signaling

Affiliations

OXTRHigh stroma fibroblasts control the invasion pattern of oral squamous cell carcinoma via ERK5 signaling

Liang Ding et al. Nat Commun. .

Abstract

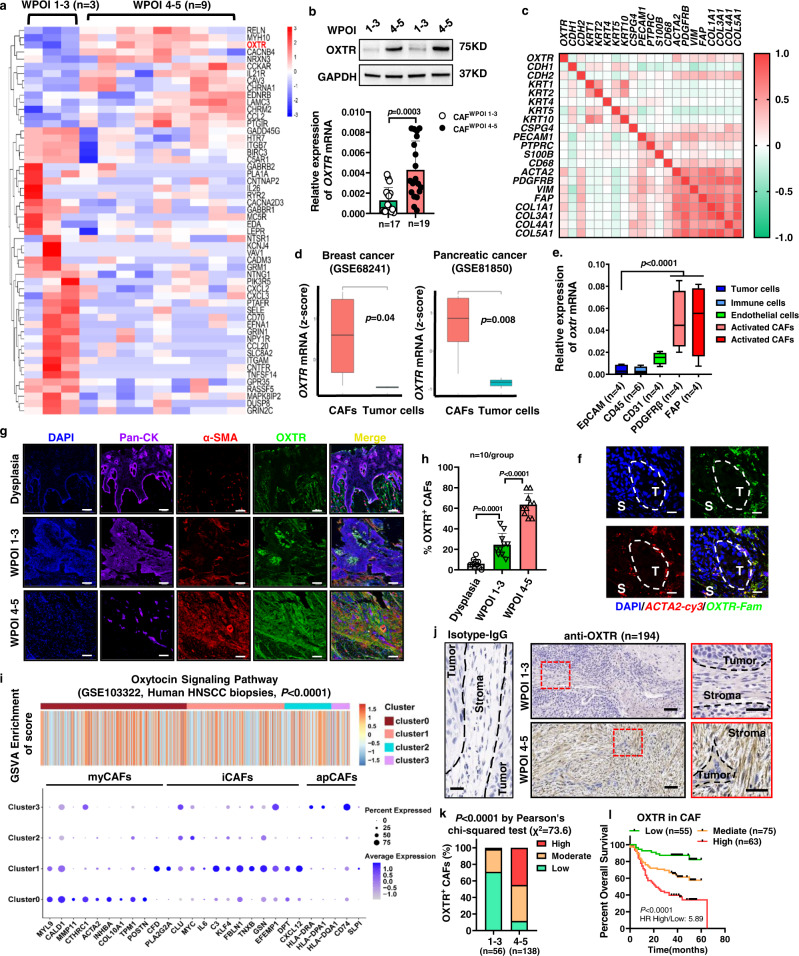
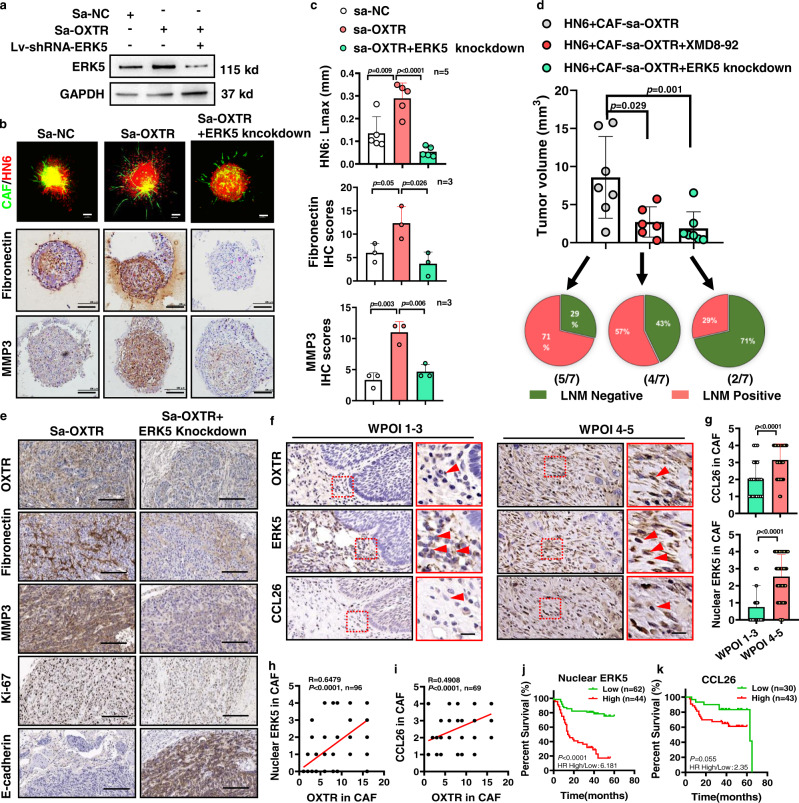
The Pattern Of Invasion (POI) of tumor cells into adjacent normal tissues clinically predicts postoperative tumor metastasis/recurrence of early oral squamous cell carcinoma (OSCC), but the mechanisms underlying the development of these subtypes remain unclear. Focusing on the highest score of POIs (Worst POI, WPOI) present within each tumor, we observe a disease progression-driven shift of WPOI towards the high-risk type 4/5, associated with a mesenchymal phenotype in advanced OSCC. WPOI 4-5-derived cancer-associated fibroblasts (CAFsWPOI4-5), characterized by high oxytocin receptor expression (OXTRHigh), contribute to local-regional metastasis. OXTRHigh CAFs induce a desmoplastic stroma and CCL26 is required for the invasive phenotype of CCR3+ tumors. Mechanistically, OXTR activates nuclear ERK5 transcription signaling via Gαq and CDC37 to maintain high levels of OXTR and CCL26. ERK5 ablation reprograms the pro-invasive phenotype of OXTRHigh CAFs. Therefore, targeting ERK5 signaling in OXTRHigh CAFs is a potential therapeutic strategy for OSCC patients with WPOI 4-5.


Conflict of interest statement

The authors declare no competing interests.

Figures

Fig. 1
Fig. 1. Switch to WPOI 4–5 type is associated with OSCC progression.
a Representative images in OSCC patients of the five types of POI stained with pan-cytokeratin (CK). Scale bar: 100 μm for type 1–4, 1000 μm for type 5. Representative of n = 200 total. b Pie chart showing the distribution of WPOI types in early- or late-stage OSCC patients. c Bar graph showing the gradual increasing ratio of WPOI 4–5 in late-stage OSCC. P = Pearson’s correlation test. d Immunofluorescence staining of EMT-related markers from OSCC tumor samples of WPOI 1–3 and 4–5 types (n = 8/WPOI type). P = multiple t test. Scale bar: 100 μm. e, f Graphical depiction of the distribution ratio of postoperative recurrence in early stage (WPOI 1–3: n = 298 and WPOI 4–5: n = 220) or advanced stage (WPOI 1–3: n = 59 and WPOI 4–5: n = 64) of OSCC patients, classified by WPOI type. P = Pearson's correlation test. g, h Graphical depiction of relapse-free survival from early-stage (WPOI 1–3: n = 298 and WPOI 4–5: n = 220) and late-stage-stage (WPOI 1–3: n = 59 and WPOI 4–5: n = 64) OSCC patients classified as WPOI types 1–3 or 4–5. P = Log-rank (Mantel–Cox) test. i Graphical depiction of the independent prognostic significance of WPOI as determined by multivariable analysis (Cox proportional hazards model) (n = 784). j Schematic representation of the predicted heterogeneous tumor microenvironments within OSCC tissues for varying POI types. CAF cancer-associated fibroblasts, TIL tumor-infiltrated lymphocytes. Results are shown as mean and standard deviation (SD). Source data are provided as a Source data file.
Fig. 2
Fig. 2. CAFWPOI 4-5 enhances the invasiveness of OSCC.
Stromal components were estimated in WPOI 1–3 (n = 10) and 4–5 (n = 10) type OSCC samples by (a) IHC analysis and (b) graphically summarized. Scale bars, 200 μm and 50 μm. P = two-tailed t test. Graphical summary from IHC analysis of α-SMA+ stained stromal fibroblasts from c tumor centers or (d) at the invasion front of OSCC (WPOI 1–3: n = 80 and 4–5: n = 70). P = two-tailed t test. e Schematic of the protocol used to isolate, culture, and establish primary human CAFWPOI 1-3 and CAFWPOI 4-5 types, based on patient pathology. f, g CAF markers and the ability of ECM remodeling were analyzed by flow cytometry (n = 4) and Matrix gel contraction assay (n = 3). P = multiple t tests and two-tailed t test. h Setup of 3D Organotypic cultures of CAFs/tumor cells and (i) graphical summaries of estimates of the ability of tumor invasion and (j) proliferation. Tumor HSC3 cells were stained with a green fluorescent dye. n = 3/group. Scale bar: 50 μm, P = two-tailed t test. k In all, 1 × 106 HSC3 tumor cells were mixed with 2 × 106 CAFWPOI 1–3 or CAFWPOI 4–5 and injected subcutaneously into male NCG mice, with the graphical representation of tumor volume, measured using slide calipers and (l) frequency of micrometastatic foci. n = 5/group, P = two-tailed t test. m In total, 2 × 105 HN6 OSCC tumor cells were mixed with 1 × 106 CAFWPOI 1-3 or CAFWPOI 4-5 and injected into the anterior portion of the tongue of NCG mice, HN6/CAFWPOI 4-5-derived tumor induce LNM (LNM + ) by CK staining with (n) tumor volume and (o) LNM percentage graphically represented. n = 6. Scale bar: 200 μm, P = two-tailed t test. p Representative photomicrographic images showing increased desmoplastic stroma components and micrometastatic foci (arrows) in mice injected with CAFWPOI 4-5 and HN6 cells, compared to CAFWPOI 1-3. Scale bars, 500 μm. Results are shown as mean and standard deviation (SD). Source data are provided as a Source data file.
Fig. 3
Fig. 3. CAFWPOI 4-5 type is characterized by high OXTR expression.
a Differential gene analysis on enriched KEGG pathway from RNA sequencing of CAFWPOI 1-3 (n = 3 independent CAFs) and CAFWPOI 4-5 (n = 9 independent CAFs). Individual gene expression is shown as in a heatmap. b OXTR protein and mRNA expression in primary CAFs. P = Student’s t test. The experiments were performed three times with similar results. c Correlative analysis between OXTR gene expression and other stromal cell markers in HNSCC, n = 530 (TCGA dataset, Firehose Legacy). d Graphical representation of OXTR mRNA expression in CAFs or tumor cells from breast cancer (CAF: n = 3, tumor cell: n = 4) and PDAC (CAFs: n = 3, tumor cells: n = 2), P = two-tailed t test. e Graphical representation of OXTR mRNA expression from flow cytometry-sorted EpCAM+ tumor cells, CD45+ leukocytes, CD31+ endothelial cells, PDGFR-β+ or FAP+ stroma fibroblasts. P = two-tailed t test. f Representative fluorescence in situ hybridization in ACTA2-cy3 and OXTR-fam-labeled stroma fibroblasts (scale bar: 20 μm) and (g) IF staining of OSCC tissues with WPOI 1–3 or 4–5 type indicated the localization of OXTR+ CAFs (scale bar: 100 μm) and (h) relative quantitation (n = 10 independent samples for each group), P = two-tailed t test. i Representation of GSVA gene set analysis of the oxytocin signaling pathway performed on human HNSCC scRNA-seq datasets (GSE103322). The similarities between different fibroblasts subtypes and myCAFs, iCAFs and apCAFs were analyzed in the lower bubble plots. j Representative IHC analysis of staining for OXTR+ CAFs from OSCC patients with WPOI 1–3 (n = 56) or 4–5 (n = 138) and (k) their graphical quantification, n = 194. Scale bar: 20 μm (left), 100 μm (middle), 50 μm (right). l Graph representing the correlation between OXTR+ CAFs and OSCC patient postoperative recurrence and survival. P = Pearson’s correlation test and Log-rank (Mantel–Cox). n = 193, scale bars, 50 μm. Results are shown as mean and standard deviation (SD). Boxes indicate the first and third quartiles, bands indicate medians, and whiskers indicate ±1.5 interquartile range. Source data are provided as a Source data file.
Fig. 4
Fig. 4. Loss of OXTR in CAFs attenuates pro-invasion function in a ligand-independent manner.
a Top ECM-remodeling pathways hits from a GSEA analysis of OXTRHigh versus OXTRLow HNSCC patient samples, n = 522, using compilations H and C5 (MSigDB). b Flow cytometry gating used to sort OXTRHigh and OXTRLow CAFs from CAFWPOI4-5 cell lines, and c estimated qPCR expression patterns of eight fibroblast markers. OXTRLow CAF was used as normalized control (Green wire, value = 1). The red wire is OXTRHigh CAF, scale of the coordinate axis is also labeled in red. d Setup of co-culture of HN6 with OXTRlow or OXTRhigh CAFs to form heterotypic spheroids and graphical representation of organoid diameter. Pan-CK-blue—tumor cells, α-SMA-red—CAFs, green—OXTR. n = 3/group, P = two-tailed t test. Scale bars, 50 μm or 100 μm. e Setup of heterotypic organoid formation from CAFs (red) or mixed with HN6 (green) cultured in Matrigel gels mixed with collagen I. The matrix invasion of CAF/HN6 heterotypic organoid was determined estimating the maximal distance of invasion from the spheroid border (Lmax). n = 5/group, P = two-tailed t test. Scale bars, 100 μm. f CRISPR-Cas9 editing human OXTR, PDGFR-β, N-cadherin, and OXTR expression were validated by Weston blot. The experiments were performed three times with similar results. g OXTR knockdown by lentivirus-sgRNA in OXTRHigh CAFs and established heterotypic organoid. Graphical representation of the Lmax of tumor cell invasion into matrix gel. P = two-tailed t test. h Graphical representation of the tumor volume, micrometastatic foci, and (i) pie chart representation of LNM percentage in an orthotopic model. Two-tailed t test and Pearson’s correlation test (n = 6/group). j Representative images of OXTR knockdown in fibroblasts validated by double-staining IHC analysis in wild-type or CKO (Oxtrfl/fl S100a4cre) mice. k The tumor volume, l LNM percentage and (m) desmoplastic stroma components were measured and summarized graphically. P = two-tailed t test. Scale bars, 50 μm (j) and 200 μm (l). Results are shown as mean and standard deviation (SD). Source data are provided as a Source data file.
Fig. 5
Fig. 5. CCL26 is required for OXTRHigh CAFs function.
a Cytokines secreted from OXTRLow and OXTRHigh CAFs sorted from three individual CAF cell lines (CAF1-3), displayed as a venn diagram, with the numbers of overlapping cytokines indicated (left image). The numbers of shared cytokines elevated in all OXTRHigh CAFs are indicated (n = 23). b The scan map of Human Cytokine array (middle) (n = 3 independent samples for each group). Table (right) displays seven cytokines/chemokines which were significantly differently upregulated (fold change >2) in the media of OXTRHigh CAFs. c Relative expression (RT-PCR) of seven cytokines/chemokines after OXTR knockdown in OXTRHigh CAFs. P = multiple t test. n = 4 for each group. d, e Representative images of DiI-labeled conditional CAFs (red) co-cultured with CMFDA-labeled HN6 (green) to form heterotypic spheroids for organoid invasion studies. Cultured cells were supplemented with recombinant human CXCL6, CCL26, CCL18, IL-1β, CCL7, CCL5, or LIGHT or stable knockdown of each of seven cytokines/chemokines. Scale bar: 100 μm. f, g Graphical representation of maximal distance of spheroid invasion from the spheroid border (Lmax) in (d, e) and quantification using ImageJ software, n = 5/group. P = two-tailed t test. h, i Representative H&E images of 3D organotypic cultures of CAFs/tumor cells under the conditions indicated and used to estimate the ability of tumor invasion, displayed graphically. Scale bar: 100 μm. j, k The invasive index was calculated using ImageJ software. n = 3/group, P = two-tailed t test. l Graphical presentation of the invasion index of HN6 OSCC cells with CCR3 knockdown co-cultured in the 3D Organotypic system used in (h) with OXTRLow CAFs and CCL26, n = 4/group. P = two-tailed t test. m IHC analysis for CCR3 expression in OSCC tumor microenvironment. Scale bars, 200 μm (n = 10). Scale bar: 100 μm. n Graphical representation of the correlation between EMT pathways from a GSEA analysis of CCR3High versus CCR3Low HNSCC patients, n = 522 (TCGA, Firehose Legacy). o The correlation between CCR3 expression and recurrence-free survival in HNSCC patients (n = 124) using Kaplan–Meier plotter (http://kmplot.com/analysis/). Results are shown as mean and standard deviation (SD) of three independent experiments. Source data are provided as a Source data file.
Fig. 6
Fig. 6. OXTR/ERK5 signaling maintains OXTR and CCL26 expression levels in OXTRHigh CAF.
a saRNAs targeting the human OXTR gene promoter activate CAF markers and OXTR levels, and (b) graphical representation of OXTR promoter transcriptional activity. P = two-tailed t test. n = 3. c Results of ATAC–seq assay to assess chromatin accessibility of CAF activation and OXTR signaling-related genes in sa-NC and sa-OXTR groups of CAF1 for three independent experiments. d Representative IF staining and (e) quantification for four p-MAPK kinases in situ in Sa-NC or Sa-OXTR CAFs. Scale bar: 50 μm. P = multiple t test. n = 4. f Representative western blots of cytoplasmic and nuclear fractions of Sa-OXTR CAFs. n = 3 biologically independent experiments. g Graphical analyses of the promoter activity of OXTR/CCL26 of CAFs with sa-NC or sa-OXTR. P = two-tailed t test. n = 3. h Representative western blots of CAFs with sa-NC or sa-OXTR for endogenous ERK5 in in whole-cell lysates (WCL) or after immunoprecipitation with anti-ERK5 antibody for the proteins indicated. Four TFs in whole-cell lysates and IP were analyzed. il Mutations of potential binding sites of c-fos, c-myc on OXTR and CCL26 promoter and its transcription activity were analyzed by a dual-luciferase reporter assay system. P = multiple t test. n = 3. m Representative western blots and (n) quantification for the indicated proteins from CAFs lysates with or without sa-NC or sa-OXTR in WC) or immunoprecipitation with ERK5 for the CDC37/HSP90/ERK5 complex. P = multiple t test. n = 3. o Representative western blots and (p) quantification for the PKC/MEK5 signal complex for endogenous Gαq or β-arrestin in WCL or immunoprecipitation with Gαq or β-arrestin antibodies. n = 3. q Representative western blots and r quantification for knockdown of Gαq or β-arrestin by siRNA and determined the p-ERK5/OXTR/CCL26 levels. P = multiple t test. n = 3. s Representative (n = 3) IF images (scale bar: 50 μm) and (t) quantification of nuclear ERK5, MEK5 or CDC37 in sorted OXTRHigh or OXTRLow CAFs. P = two-tailed t test. u The OXTR signaling pathway diagram. Results are shown as mean and standard deviation (SD). All immunoblotting results are representative of three independent experiments. Source data are provided as a Source data file.
Fig. 7
Fig. 7. ERK5 inhibition in CAFs is capable of suppressing OSCC tumor progression.
a Stable knockdown of ERK5 in CAFs overexpressing OXTR (representative of n = 3 biologically independent experiments) and (b, c) its impacts on tumor invasion, fibronectin, and MMP3 levels. Representative images of conditional CAFs (green) co-cultured with HN6 (red) to form heterotypic spheroids embedded in conditional 3D collagen matrix for organoid invasion studies (n = 5 biologically independent samples). Spheroids were then embedded in paraffin for histochemistry analyses by two-tailed t test (n = 3 biologically independent samples). Scale bar: 100 μm. d Graphical analysis of tongue tumor volume or LMN percentage after 2 × 105 HN6 OSCC cells were mixed with 1 × 106 sa-OXTR CAFs and injected into the tongue of 4- to 5-week-old NCG mice with either XMD8-92 treatment (50 mg/kg, twice a week) or CAFs with ERK5 knockdown. n = 7/group, P = two-tailed t test or Pearson’s correlation test. e Representative IHC images from OSCC tumor tissues of CAFs with sa-OXTR or sa-OXTR with ERK5 knockdown stained with antibodies for OXTR, fibronectin, MMP3, Ki-67, or E-cadherin in tumor tissues. n = 3. Scale bars, 200 μm. f Representative IHC images showing nuclear ERK5 (n = 107) or CCL26 (n = 74) expression in OSCC patient tissue and g their graphical quantification. ERK5 (WPOI 1–3: n = 32 and WPOI 4–5: n = 71) and CCL26 (WPOI 1–3: n = 21 and WPOI 4–5: n = 48). P = two-tailed t test. Tumors were categorized according to WPOI stage. P = Student’s t test. Scale bars, 20 μm. h, i Graphical representation of correlative indexes between nuclear ERK5 (n = 96) or CCL26 (n = 69) and OXTR analyzed by spearman rank correlation test. j, k Graphs of OSCC patient postoperative survival and their correlation with nuclear ERK5 (n = 106) or CCL26 (n = 73). P = Log-rank (Mantel–Cox) test. Results are shown as mean and standard deviation (SD). Source data are provided as a Source data file.
Fig. 8
Fig. 8. WPOI progression is not associated with the serum levels of the OXTR ligand.
Graphical representation of analysis of serum (a) OXT and (b) AVP levels from healthy, leukoplakia and (c, d) OSCC patients with WPOI 1–3 (n = 64) and 4–5 (n = 45) types as indicated and as determined by ELISA (n = 180). P = two-tailed t test. e, f Graphical representation of analysis of serum OXT and AVP levels from patients with WPOI 1–3 (n = 28) and 4–5 (n = 68) types in a validation group. P = two-tailed t test. g, h Graphical representation of analysis of OXT/AVP levels from patients with/without LNM (n = 85) and postoperative metastasis (n = 93). P = two-tailed t test. i Graphical representation of survival data from WPOI 4–5 OSCC patients stratified according to OXT level (low: n = 34 and high: n = 34). j Correlative index of OXTR, nuclear ERK5 and serum OXT levels from OSCC patient tissue (n = 96) by IHC and ELISA analysis using Pearson’s correlation test. k, l Graphical analysis of Lmax (invasion in 3D collagen matrix) of HN6 in heterotypic spheroids treated with OXT or AVP. n = 4/group, P = two-tailed t test. m Proposed working model depicting the mechanism of OXTR autoactivation-mediated ERK5 nucleus translocation for maintaining the function and phenotype of OXTRHigh CAFs in WPOI 4–5 type stroma. Results are shown as mean and standard deviation (SD). Source data are provided as a Source data file.

Similar articles

Cited by

References

    1. Shrestha AD, Vedsted P, Kallestrup P, Neupane D. Prevalence and incidence of oral cancer in low- and middle-income countries: a scoping review. Eur. J. Cancer Care. 2020;29:e13207. doi: 10.1111/ecc.13207. - DOI - PubMed
    1. Brandwein-Gensler M, et al. Validation of the histologic risk model in a new cohort of patients with head and neck squamous cell carcinoma. Am. J. Surg. Pathol. 2010;34:676–688. doi: 10.1097/PAS.0b013e3181d95c37. - DOI - PubMed
    1. Bryne M, et al. New malignancy grading is a better prognostic indicator than Broders’ grading in oral squamous cell carcinomas. J. Oral. Pathol. Med. 1989;18:432–437. doi: 10.1111/j.1600-0714.1989.tb01339.x. - DOI - PubMed
    1. Brandwein-Gensler M, et al. Oral squamous cell carcinoma: histologic risk assessment, but not margin status, is strongly predictive of local disease-free and overall survival. Am. J. Surg. Pathol. 2005;29:167–178. doi: 10.1097/01.pas.0000149687.90710.21. - DOI - PubMed
    1. Rivera-Colon G, et al. Cervical adenocarcinoma: histopathologic features from biopsies to predict tumor behavior. Am. J. Surg. Pathol. 2020;44:247–254. doi: 10.1097/PAS.0000000000001379. - DOI - PubMed

Publication types

MeSH terms