

Design and evaluation of short-term monitoring campaigns for long-term air pollution exposure assessment
- PMID: 36045136
- PMCID: PMC9971335
- DOI: 10.1038/s41370-022-00470-5
Design and evaluation of short-term monitoring campaigns for long-term air pollution exposure assessment
Abstract
Background: Short-term mobile monitoring campaigns to estimate long-term air pollution levels are becoming increasingly common. Still, many campaigns have not conducted temporally-balanced sampling, and few have looked at the implications of such study designs for epidemiologic exposure assessment.
Objective: We carried out a simulation study using fixed-site air quality monitors to better understand how different short-term monitoring designs impact the resulting exposure surfaces.
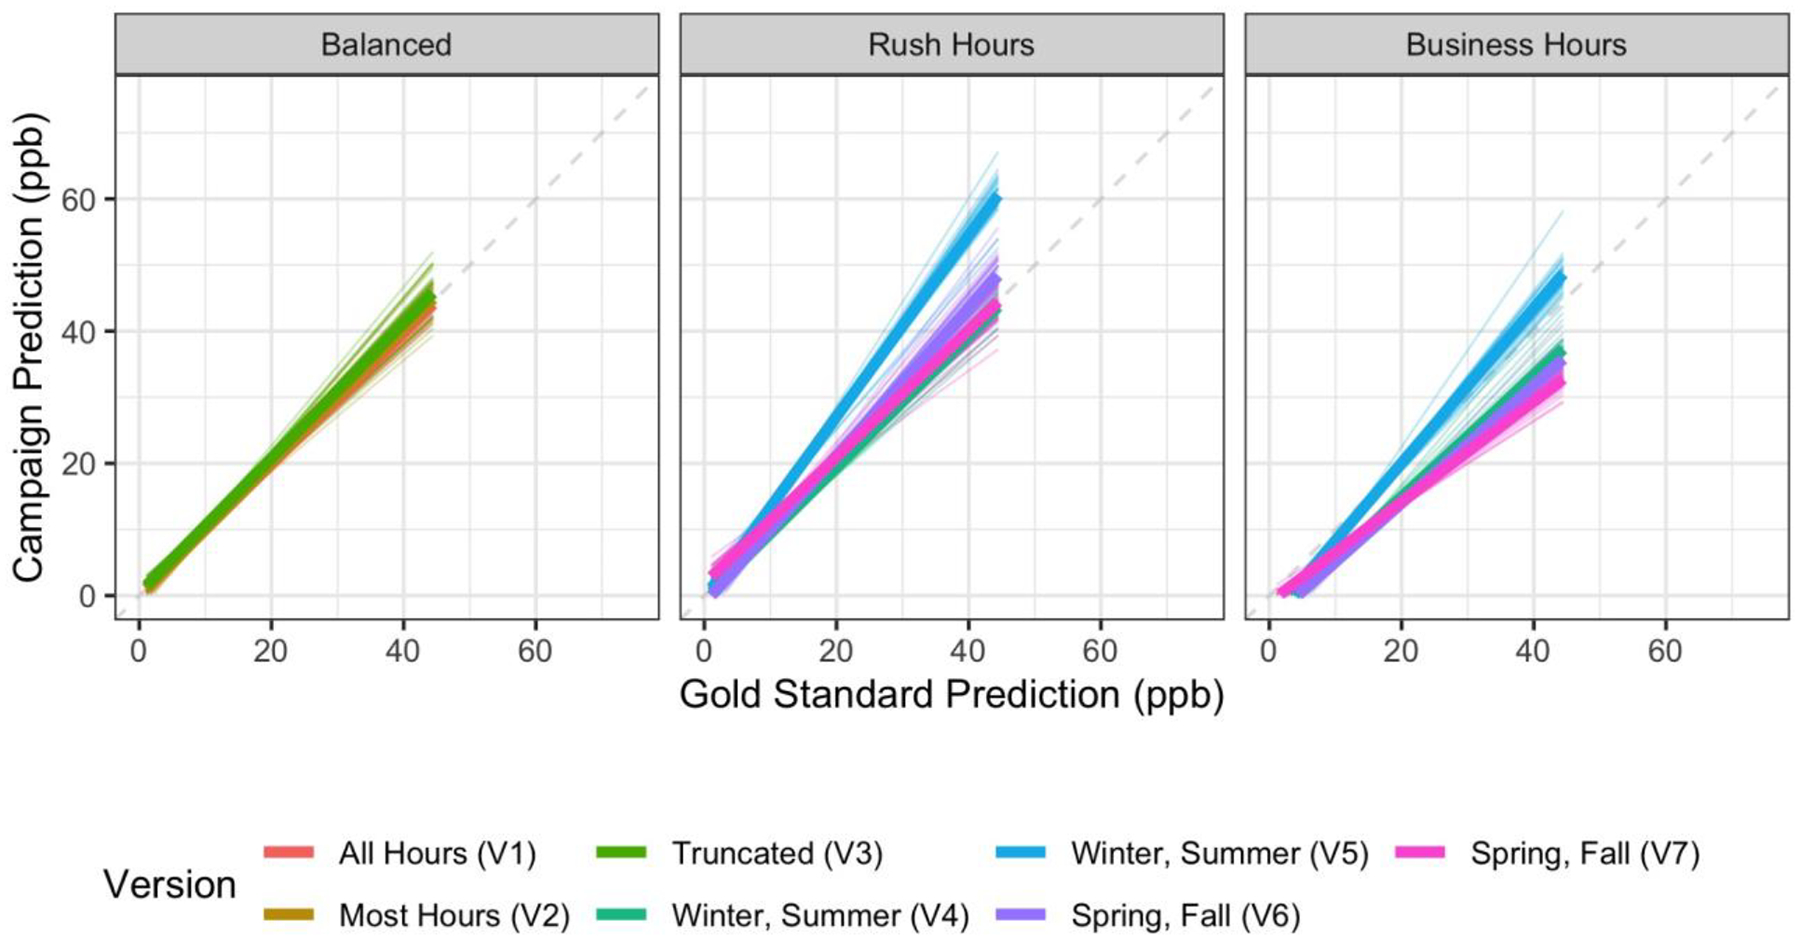
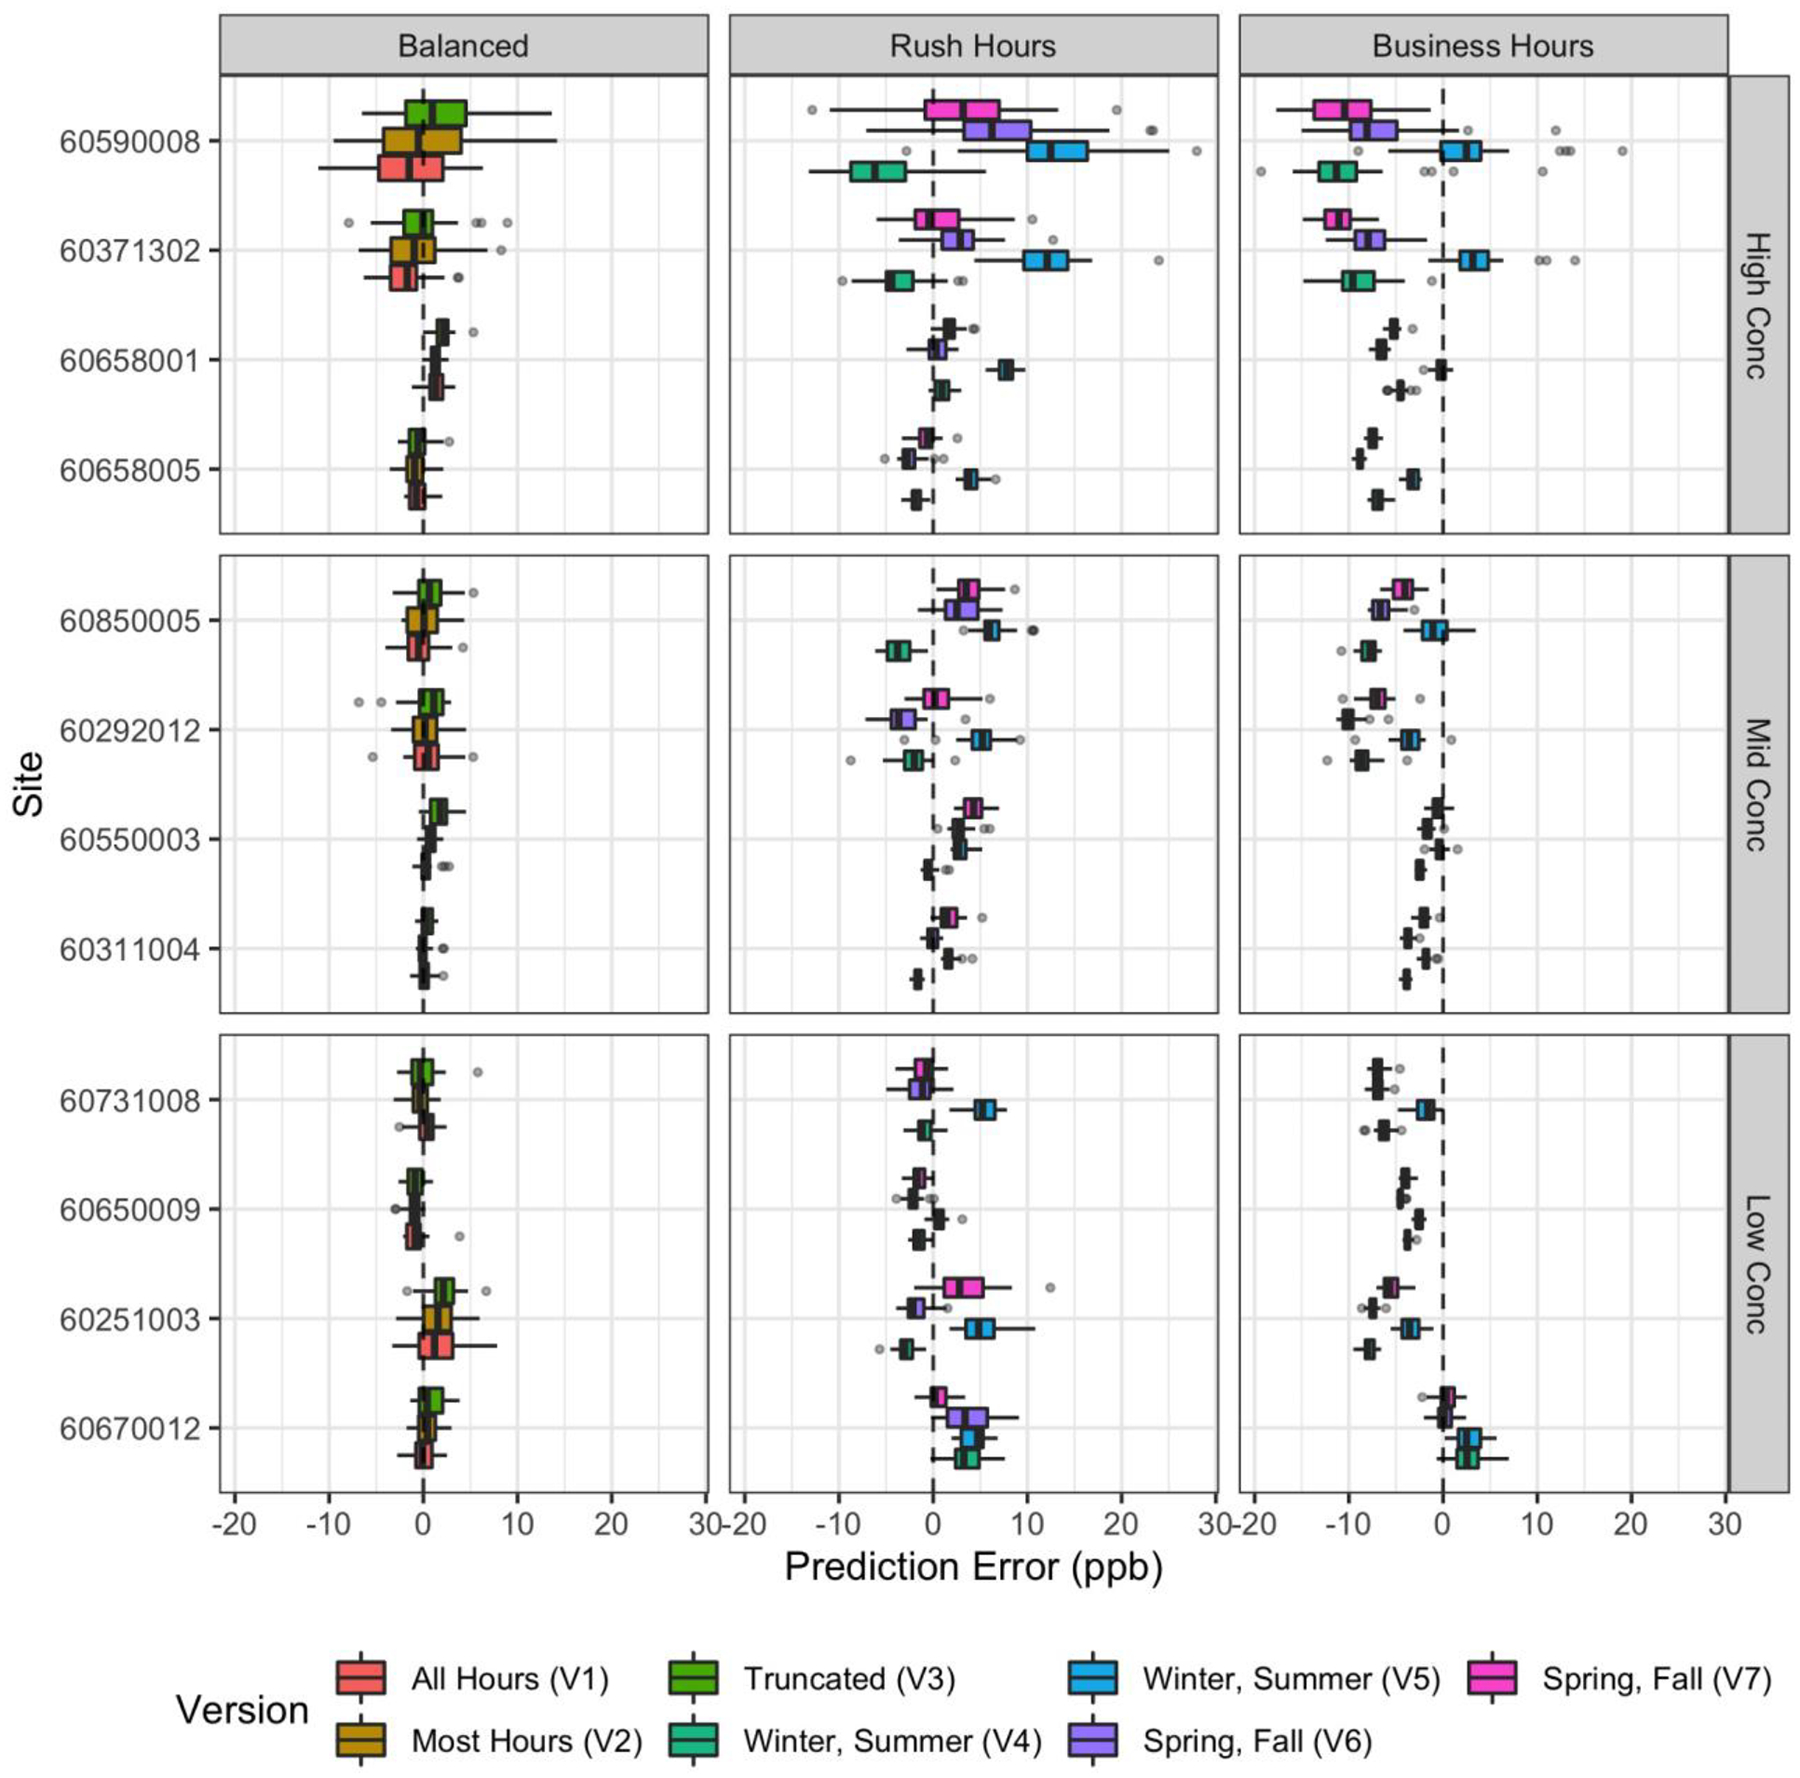
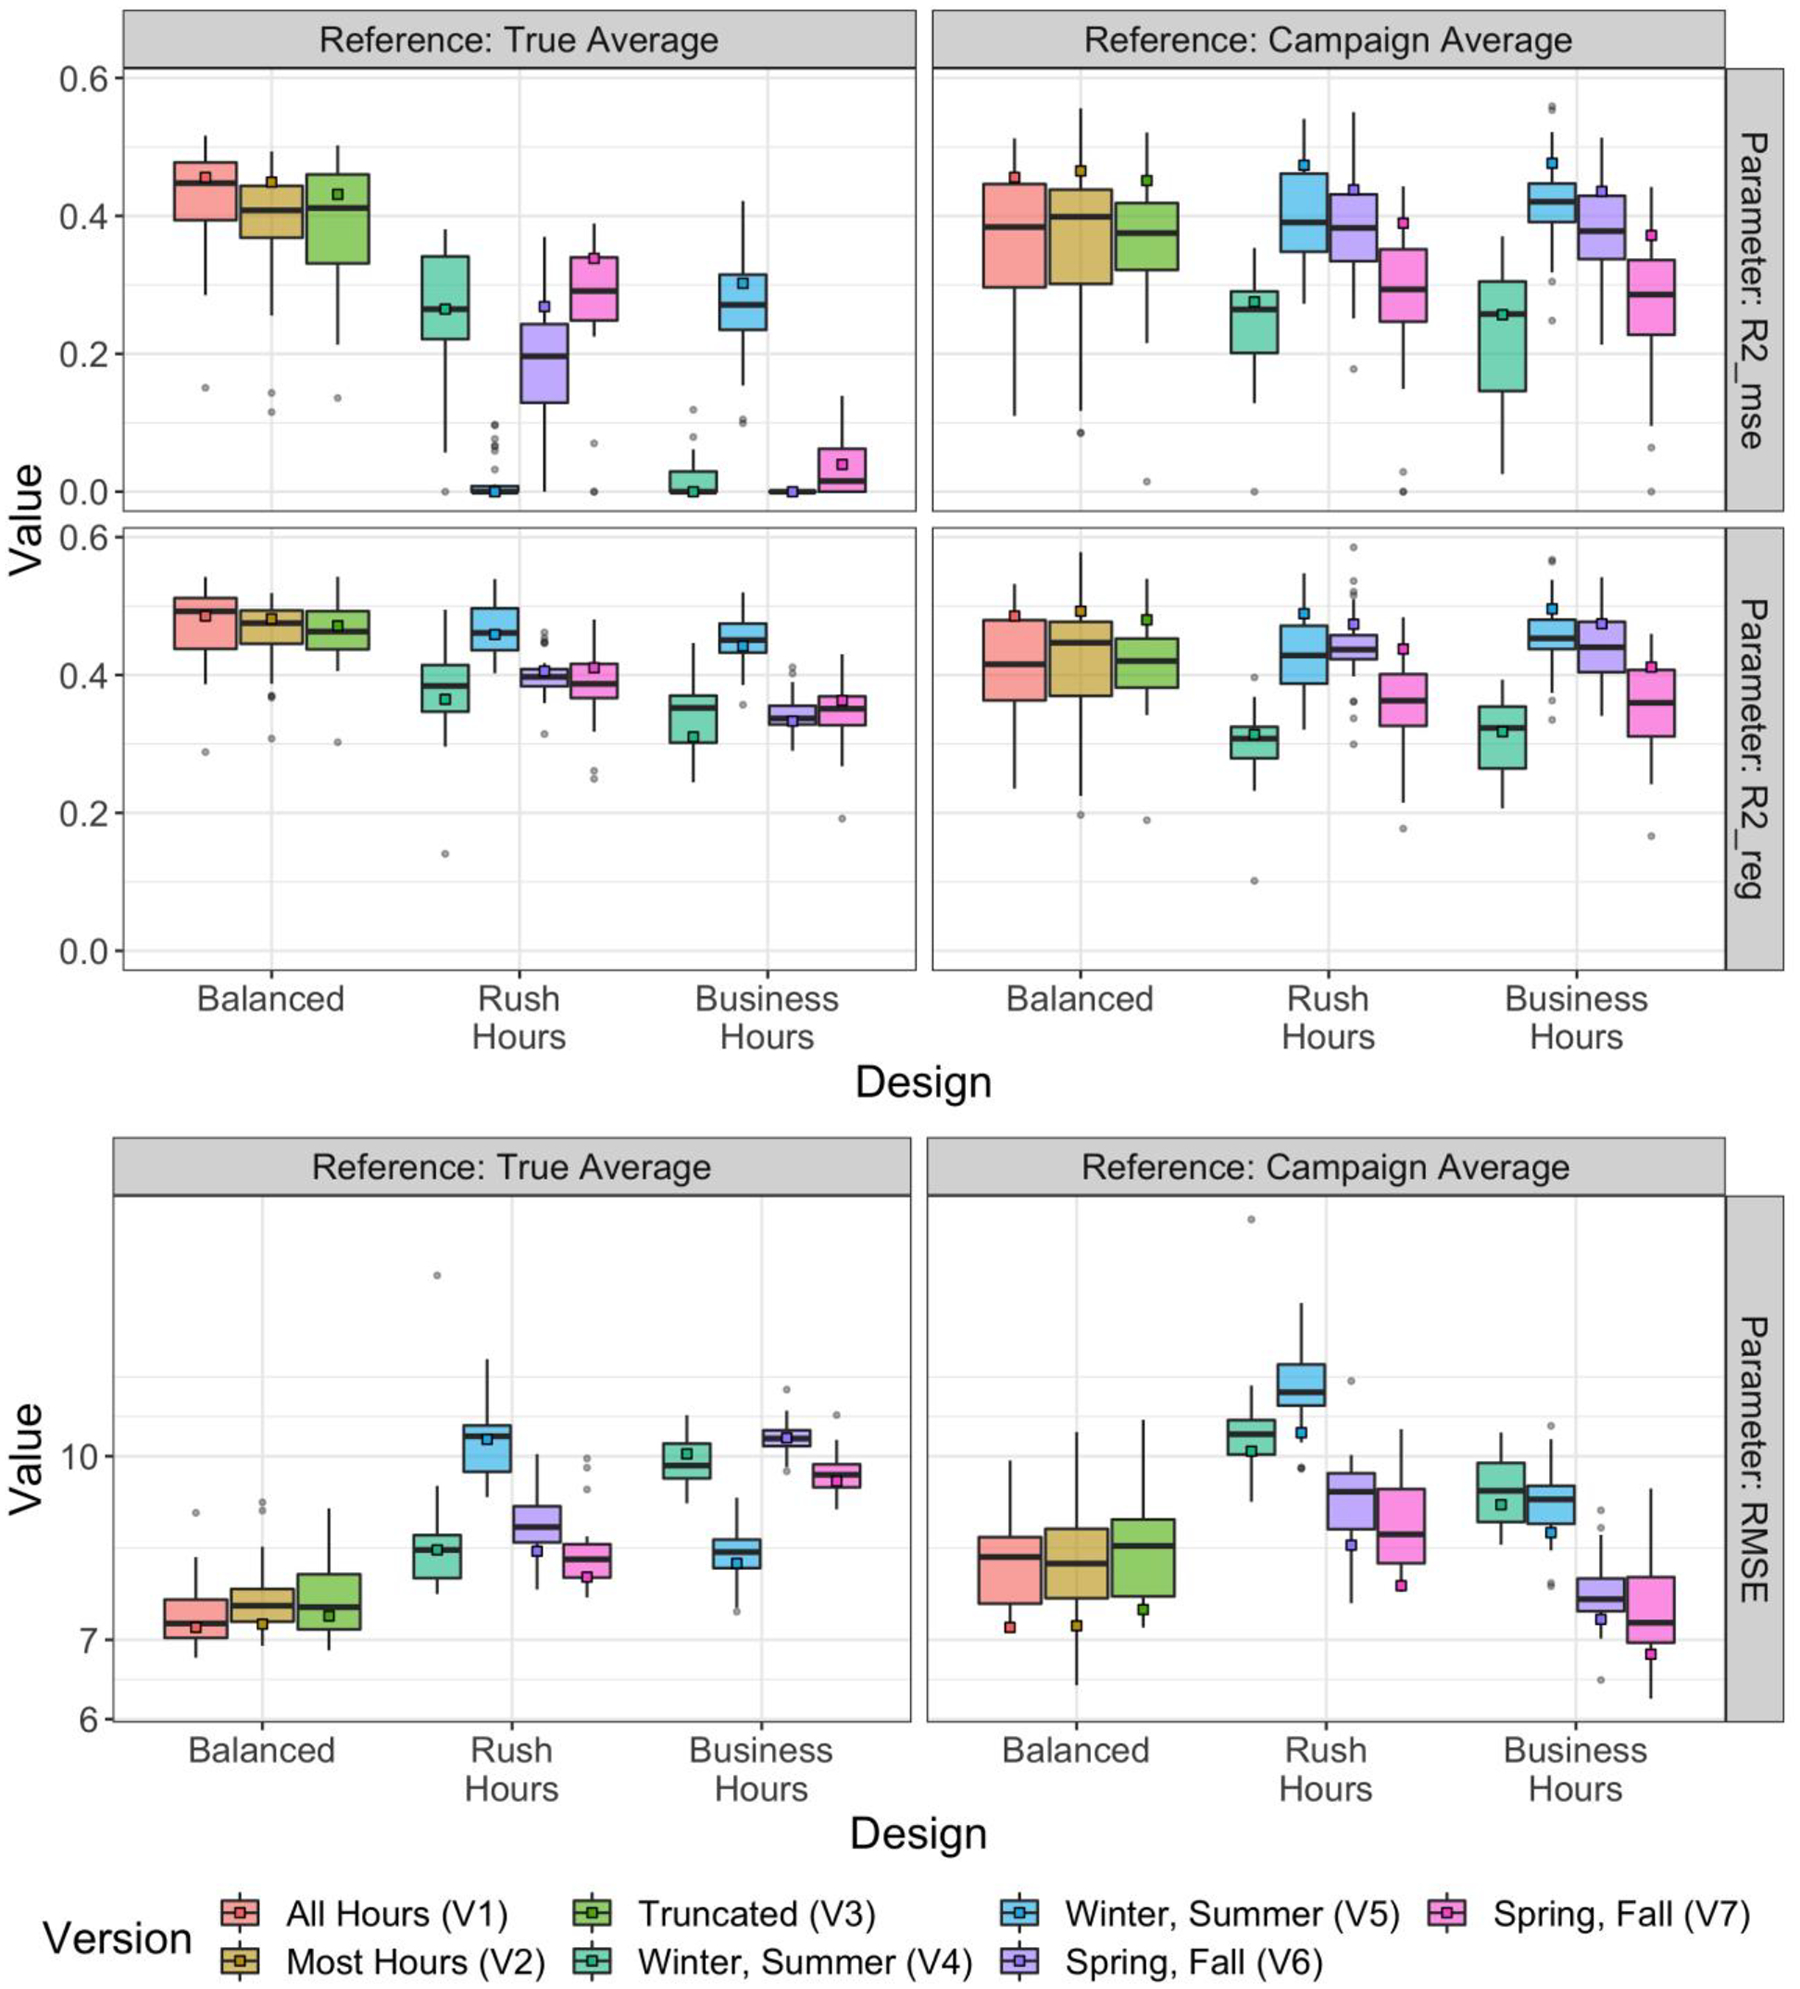
Methods: We used Monte Carlo resampling to simulate three archetypal short-term monitoring sampling designs using oxides of nitrogen (NOx) monitoring data from 69 regulatory sites in California: a year-around Balanced Design that sampled during all seasons of the year, days of the week, and all or various hours of the day; a temporally reduced Rush Hours Design; and a temporally reduced Business Hours Design. We evaluated the performance of each design's land use regression prediction model.
Results: The Balanced Design consistently yielded the most accurate annual averages; while the reduced Rush Hours and Business Hours Designs generally produced more biased results.
Significance: A temporally-balanced sampling design is crucial for short-term campaigns such as mobile monitoring aiming to assess long-term exposure in epidemiologic cohorts.
Impact statement: Short-term monitoring campaigns to assess long-term air pollution trends are increasingly common, though they rarely conduct temporally balanced sampling. We show that this approach produces biased annual average exposure estimates that can be improved by collecting temporally-balanced samples.
Keywords: Air Pollution; Environmental Monitoring; Exposure Modeling; New Approach Methodologies (NAMs).
© 2022. The Author(s), under exclusive licence to Springer Nature America, Inc.
Conflict of interest statement
Competing Interests
The authors declare no competing interests.
Competing Financial Interests: The authors declare they have no actual or potential competing financial interests.
Figures
References
-
- Hankey S, Marshall JD. Land Use Regression Models of On-Road Particulate Air Pollution (Particle Number, Black Carbon, PM2.5, Particle Size) Using Mobile Monitoring. Environ Sci Technol. 2015. Aug;49(15):9194–202. - PubMed
-
- Apte JS, Messier KP, Gani S, Brauer M, Kirchstetter TW, Lunden MM, et al. High-Resolution Air Pollution Mapping with Google Street View Cars: Exploiting Big Data. Environ Sci Technol. 2017. Jun;51(12):6999–7008. - PubMed
-
- Hatzopoulou M, Valois MF, Levy I, Mihele C, Lu G, Bagg S, et al. Robustness of Land-Use Regression Models Developed from Mobile Air Pollutant Measurements. Environ Sci Technol. 2017. Apr;51(7):3938–47. - PubMed
-
- Van den Bossche J, Peters J, Verwaeren J, Botteldooren D, Theunis J, De Baets B. Mobile monitoring for mapping spatial variation in urban air quality: Development and validation of a methodology based on an extensive dataset. Atmos Environ. 2015;
Publication types
MeSH terms
Substances
Grants and funding
LinkOut - more resources
Full Text Sources
Medical
