. 2022 Sep;23(9):1355-1364.
doi: 10.1038/s41590-022-01288-x. Epub 2022 Aug 31.

Kinetic proofreading through the multi-step activation of the ZAP70 kinase underlies early T cell ligand discrimination

Affiliations

Kinetic proofreading through the multi-step activation of the ZAP70 kinase underlies early T cell ligand discrimination

Guillaume Voisinne et al. Nat Immunol. 2022 Sep.

Abstract

T cells recognize a few high-affinity antigens among a vast array of lower affinity antigens. According to the kinetic proofreading model, antigen discrimination properties could be explained by the gradual amplification of small differences in binding affinities as the signal is transduced downstream of the T cell receptor. Which early molecular events are affected by ligand affinity, and how, has not been fully resolved. Here, we used time-resolved high-throughput proteomic analyses to identify and quantify the phosphorylation events and protein-protein interactions encoding T cell ligand discrimination in antigen-experienced T cells. Although low-affinity ligands induced phosphorylation of the Cd3 chains of the T cell receptor and the interaction of Cd3 with the Zap70 kinase as strongly as high-affinity ligands, they failed to activate Zap70 to the same extent. As a result, formation of the signalosome of the Lat adaptor was severely impaired with low- compared with high-affinity ligands, whereas formation of the signalosome of the Cd6 receptor was affected only partially. Overall, this study provides a comprehensive map of molecular events associated with T cell ligand discrimination.


Conflict of interest statement

The authors declare no competing interests.

Figures

Fig. 1
Fig. 1. Responses of OT-I CD8+ T cells after stimulation with pMHC tetramers of different affinity under equal TCR occupancy conditions.
a, Quantification of bound tetramers and CD69 expression by flow cytometry in OT-I CD8+ T cells purified from lymph nodes and spleen, briefly expanded in vitro with coated CD3 plus soluble CD28 antibodies for 48 h, followed by incubation with IL-2 for an additional period of 48 h before stimulation with 20 nM N4, 50 nM T4 or 300 nM G4 for 12 h. Unstim, no pMHC tetramers. b, Quantification of IFN-γ production by intracellular staining and flow cytometry 12 h poststimulation with tetramers and in the presence of soluble anti-CD28 as in a. c, Quantification by flow cytometry of bound tetramers and cell proliferation as measured by CTV dilution 72 h poststimulation with tetramers and in the presence of soluble anti-CD28 as described in a. ‘IL-7’, unstimulated control corresponding to a dose of 5 ng ml–1 IL-7 to maintain cell viability in the absence of tetramers. d, Immunoblot analysis of total protein lysates from OT-I cells left unstimulated (0 s) or stimulated with N4, T4 or G4 as described in a for 30–300 s. Total cellular lysates were then probed with a phosphotyrosine antibody (p-Tyr). Anti-SLP76 immunoblot served as a loading control. Molecular weights are indicated on the left. Data are representative of more than three independent experiments. Source data
Fig. 2
Fig. 2. Global analysis of T cell phosphoproteome as a function of TCR ligand affinity.
a, Number of phosphorylated serines (S), threonines (T) and tyrosines (Y) identified in the phosphoproteome of OT-1 CD8+T cells after stimulation with N4, T4 or G4 (Extended Data Fig. 1). b, Heatmap displaying the correlation (Pearson) of phosphopeptide intensity between each biological replicates (R1–R6) and stimulatory conditions. Unstim, no pMHC tetramers. c, Number of phospho-sites significantly regulated upon TCR stimulation with G4, T4 or N4. d, Euler diagram showing the repartition of the regulated phospho-sites between stimulations with G4, T4 or N4.
Fig. 3
Fig. 3. Analysis of phosphorylation regulation as a function of TCR ligand affinity.
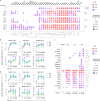
a, Illustration of phosphorylation kinetics for G4, T4 and N4 stimulations. The areas under the curve for the responses to G4, T4 or N4 stimulations shown here are equal to 5.2, 9.3 and 14.6, respectively. This corresponds to response losses of 64% for G4 and 36% for T4 as compared with N4, which yield a discrimination score (average loss) equal to 50% in this scenario. b, Heatmap displaying the log2 fold change between stimulated and unstimulated conditions for all TCR-regulated phospho-sites for which phosphorylation could be quantified across all experimental conditions. For each phospho-site (row), the log2 fold change was scaled by dividing by the s.d. Phospho-sites were ranked according to the discrimination score calculated as described in a and their kinetics of phosphorylation. Three main response profiles were defined based on the discrimination score: Unaffected (discrimination score ≤40%), Gradual (discrimination score >40%, and ≤80%) and Digital (discrimination score >80%). c, Heatmap showing kinase-specific substrate enrichment as a function of the discrimination score (x axis). Black dots indicate statistically significant enrichment (hypergeometric test P value ≤ 0.05, fold change ≥2, number of substrates ≥2; gray squares, fold change <1). d, Representative activation profiles of phosphorylation sites presenting Unaffected, Gradual or Digital responses as described in b. Log2-transformed fold changes relative to the average intensity in unstimulated controls (t = 0 s) are plotted for each time point. Error bars represent s.d. across biological replicates (n = 6 for N4 and unstimulated, n = 3 for T4 and G4). Discrimination scores are reported in parenthesis in the graph titles.
Fig. 4
Fig. 4. Analysis of the Cd3ζ and Zap70 signalosomes as a function of TCR ligand affinity.
a, Dot plot showing the time-resolved interaction stoichiometry of proteins significantly associated with Cd3ζOST in unstimulated (Umstim.) or stimulated conditions. T cells were stimulated with N4, T4 or G4 under equal TCR occupancy conditions as described in Fig. 1a. Dots are colored-coded according to the enrichment FDR value and only conditions with FDR values below 0.1 are represented. Proteins were considered significantly associated when presenting an enrichment FDR ≤ 0.05 and a fold change ≥10 in at least one experimental condition. The interaction stoichiometry of each protein was normalized by the maximal value across all experimental conditions. Proteins were ordered by hierarchical clustering based on their row-wise normalized stoichiometry. b, Representation of log2 fold changes of stoichiometry relative to the average stoichiometry in unstimulated controls (t = 0 s) for selected interactors of CD3ζOST as a function of stimulation time and peptide affinity. Discrimination scores, computed as described in Fig. 3a, are reported in parenthesis. Error bars represent s.d. across biological replicates (n = 6 for N4 and unstimulated, n = 3 for T4 and G4). c, Dot plot showing the time-resolved interaction stoichiometry of proteins significantly associated with Zap70OST analyzed as in a. d, Representation of log2 fold changes of stoichiometry relative to the average stoichiometry in unstimulated controls (t = 0 s) for selected interactors of Zap70OST as a function of stimulation time and peptide affinity. Discrimination scores, computed as described in Fig. 3a, are reported in parenthesis. Error bars represent s.d. across biological replicates (n = 6 for N4 and unstim., n = 3 for T4 and G4).
Fig. 5
Fig. 5. Impact of TCR ligand affinity on proximal phosphorylation events.
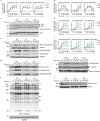
a, Representation of log2-transformed fold changes of phosphorylation intensity relative to the average intensity in unstimulated controls (t = 0 s) for phosphorylation on tyrosine residues within ITAMs of the Cd3ζOST molecule. Phosphorylation intensities were quantified from affinity-purified Cd3ζOST samples. Discrimination scores, computed as described in Fig. 3a, are reported in parenthesis. Error bars represent s.d. across biological replicates (n = 6 for N4 and unstimulated, n = 3 for T4 and G4). b, Immunoblot analysis of total protein lysates from OT-I cells left unstimulated (t = 0 s) or stimulated with N4, T4 or G4 under equal TCR occupancy conditions as described in Fig. 1a. T cells were stimulated for the indicated times and probed with phospho-specific antibodies recognizing phosphotyrosine residues in Zap70. Anti-ZAP70 and anti-GAPDH immunoblots served as a loading control. c, Immunoblot analysis of affinity-purified Cd3ζ molecules from OT-I Cd3ζOST cells treated and probed as in b. Data are representative of three independent experiments. Source data
Fig. 6
Fig. 6. Analysis of the Slp76 signalosome as a function of TCR ligand affinity.
a, Dot plot showing the time-resolved interaction stoichiometry of proteins significantly associated with Slp76OST in unstimulated (Unstim.) or stimulated conditions. T cells were stimulated with N4, T4 or G4 under equal TCR occupancy conditions as described in Fig. 1a. Dots are colored-coded according to the enrichment FDR value, and only conditions with FDR values below 0.1 are represented. Proteins were considered significantly associated when presenting an enrichment FDR ≤ 0.05 and a fold change ≥10 in at least one experimental condition. The interaction stoichiometry of each interacting protein was normalized by the maximal value across all experimental conditions. Proteins were ordered by hierarchical clustering based on their row-wise normalized stoichiometry. b, Immunoblot analysis of affinity-purified Slp76 molecules from OT-I Slp76OST cells that have been left unstimulated (t = 0 s) or stimulated with N4, T4 or G4 as described in Fig. 1a for the indicated times and probed with antibody to phosphorylated tyrosine (p-Tyr) or anti-SLP76. Phospho-molecules corresponding to Slp76, Lat and Cd6 are indicated by arrows. c, Immunoblot analysis of total protein lysates from OT-I cells left unstimulated (t = 0 s) or stimulated with N4, T4 or G4 as described in Fig. 1a for the indicated times and probed with a phospho-specific antibody recognizing the phosphorylated residues Y136, Y195 and Y235 in Lat. Data in b and c are representative of three independent experiments. Molecular weights are indicated on the left. d, Representation of log2-transformed fold changes of the phosphorylation intensity relative to the average intensity in unstimulated controls (t = 0 s) for the phosphorylation of the Y195 residue of Lat in the global phosphoproteome dataset. Error bars represent s.d. across biological replicates (n = 6 for N4 and unstimulated, n = 3 for T4 and G4). Source data
Fig. 7
Fig. 7. Deletion of CD6 enhances T cell responses to low-affinity TCR ligands.
a, Flow cytometry analysis of IFN-γ-producing ability in OT-I CD8+T cells from Cas9-expressing mice nucleofected with sgRNA targeting Cd6 or EGFP, left to rest for 3 days and subsequently restimulated with the indicated concentration of N4, T4 or G4 for 24 h. IL-7 and PMA/ionomycin (PI) treatments were used as negative and positive controls respectively. Data are representative of three independent experiments. b, Bar graph depicting the percentages of IFN-γ+ cells after stimulation with the indicated concentrations of G4, T4, N4 or with IL-7 and PI as in a. (Unpaired two-tailed Welch t-test with n = 7 and n = 10 independent nucleofections of sgEGFP and sgCD6 respectively; NS, not significant; *P ≤ 0.05, **P ≤ 0.01, ***P ≤ 0.001). The figure integrates data from three independent experiments.
Extended Data Fig. 1
Extended Data Fig. 1. Workflow for the analysis of T cell phosphoproteome as a function of TCR ligand affinity.
(a) Experimental workflow to quantify phosphorylations occurring in the 10 min following TCR stimulation with N4, T4 or G4 under equal TCR occupancy conditions as described in Fig. 1a. OT-1 T cells were stimulated with N4, T4 or G4 for 30, 120, 300, or 600 seconds before lysis, protein digestion and MS analysis. Control samples were harvested without stimulation (0 s). (b) Schematics of the multiplexing strategy employed to compare phosphorylation intensities across a large set of samples. Peptides from different stimulatory condition were labelled with isobaric tags (TMT) enabling multiplexed MS analysis. Six independent experiments consisting of three replicates with N4 and T4 stimulations (N4-T4) and three replicates with N4 and G4 stimulations (N4-G4) were conducted and analyzed to generate the phosphoproteomic dataset. (c) Strategy for phospho-peptide enrichment and MS analysis (see the Methods section for more details).
Extended Data Fig. 2
Extended Data Fig. 2. Comparative analysis of the phosphoproteomes of OT-I CD8+ and CD4+ T cells.
(a) Euler diagram representing the repartition of phospho-sites identified and regulated in the present study relative to those identified in our previous study using CD4+ T cells (Locard-Paulet et al. 2020). (b) Comparison of phospho-site intensities (normalized across biological replicates) between CD4+ T cells stimulated with anti-CD4 and anti-CD3 antibodies and OT-I CD8+ T cells stimulated with N4. Only phospho-sites identified as regulated upon TCR stimulation in both studies were considered. Pearson correlation coefficient R = 0.64. (c) Distribution of Pearson correlation coefficients comparing log-transformed normalized phosphosite intensities between N4-stimulated OT-1 CD8+ T cells (this study) and antibody stimulated CD4+ T cells (Locard-Paulet et al. 2020) across phospho-sites identified as regulated upon TCR stimulation in both studies. Phospho-site intensities were normalized as in (b). The correlation coefficient was computed only for phospho-sites with intensity values available in both datasets for a minimum of four stimulatory conditions (n = 384 phospho-sites). (d) Overlay dynamics of selected phospho-sites in N4-stimulated OT-1 CD8+ T cells (this study) and antibody-stimulated CD4+ T cells. Error bars represent standard deviation across biological replicates (n = 6 for OT-1 CD8+ T cells, n = 4 for CD4+ T cells).
Extended Data Fig. 3
Extended Data Fig. 3. Impact of TCR ligand affinity on TCR signaling effectors.
Analysis of phosphorylation intensity between stimulated and unstimulated conditions for selected phospho-sites associated with unaffected (a-c), gradual (d-i) or digital responses (j). (a,b) Representation of log2-transformed fold-changes of the phosphorylation intensity relative to the average intensity in unstimulated controls (t = 0 s) for selected phospho-sites identified in the phospho-dataset. Error bars represent standard deviation across biological replicates (n = 6 for N4 and unstimulated, n = 3 for T4 and G4). Discrimination scores are reported in parenthesis. (c) Immunoblot analysis of total protein lysates from OT-I cells left unstimulated (t = 0 s) or stimulated with N4, T4 or G4 under equal TCR occupancy conditions as described in Fig. 1a. T cells were stimulated for the indicated times and probed with the indicated phospho-specific antibodies. Arrows in the margins indicate mass shifts due to protein isoforms or phospho-isoforms of interest. Molecular weights are indicated on the left. (d) Analysis of phosphorylation intensity between stimulated and unstimulated conditions for selected phospho-sites associated with gradual responses displayed as in (a). (e) Immunoblot of total protein lysates displaying gradual responses analyzed as in (c). (f) Analysis of phosphorylation intensity between stimulated and unstimulated conditions for selected phospho-sites associated with gradual responses displayed as in (a). (g-j) Immunoblot of total protein lysates displaying gradual (g-i) or digital (j) responses analyzed as in (c). Data are representative of three independent experiments. Source data
Extended Data Fig. 4
Extended Data Fig. 4. Normal development and function of T cells from the OT-I Cd3εOST mouse.
(a-c) Flow cytometry analysis of thymus (a), Spleen (b) and Lymph nodes (c). Wild-type OT-I and OT-I Cd3ζOST thymocytes were analyzed for expression of CD4 and CD8. Numbers adjacent to the outlined areas indicate percent double-positive cells in (a), and CD4 + or CD8 + single-positive cells in (a) to (c). Data are representative of at least three experiments with three mice per genotype. (d) Cellularity of thymus, pooled axillary, brachial, inguinal and mesenteric lymph nodes (LN) and spleen of wild-type OT-I and OT-I Cd3ζOST mice. Data are expressed as mean value ± SD (n = 9 mice integrated over three independent experiments).(e) Proliferative capacity of wild-type OT-I and OT-I Cd3ζOST CD8+ T cells activated for 72 h with plate-bound anti-CD3 (3 μg/ml) in the presence or absence of soluble anti-CD28 (1 μg/ml) or with PMA/Ionomycin (PI). The ATP present in the culture medium was assessed by luminescence as a measure of the extent of cell proliferation. Data are expressed as mean value ± s.d (n = 3 mice representative of three independent experiments). (f) Immunoblot analysis of total protein lysates from wild-type OT-I and OT-I Cd3ζOST CD8+ T cells probed with anti-CD3ζ or anti-GAPDH (loading control) antibodies. Molecular weights are indicated on the left. Data are representative of three independent experiments. (g) Flow cytometry analysis showing expression of CD3ε and TCRβ of peripheral CD8+T cells from OT-I and OT-I Cd3ζOST mice. Data are representative of three independent experiments.
Extended Data Fig. 5
Extended Data Fig. 5. Cd3-Zap70 interaction and Cd3 phosphorylation as function of ligand affinity.
Immunoblot analysis of affinity-purified Cd3ζ molecules from OT-I CD3 ζ OST cells that have been left unstimulated (t = 0 s) or stimulated with N4, T4 or G4 for the indicated times. (a) Immunoblot was probed with anti-ZAP70 and anti-CD3ζ. (b) Two different levels of occupancy have been calculated and tested according to two N4 doses (4 and 0.8 nM). Immunoblot was probed with antibodies specific for phospho-tyrosines (p-Tyr) and CD3ζ. Phospho-species of CD3 chains are annotated with arrows. Molecular weights are indicated on the left (kDa). Data are representative of three independent experiments. Source data
Extended Data Fig. 6
Extended Data Fig. 6. Deletion of Cd6 and Ubash3a molecules in OT-I CD8+ T cells.
(a,b) Flow cytometry (a) and immunoblot (b) analysis of Cd6 expression in OT-I CD8+ T cells purified from mice constitutively expressing Cas9 and nucleofected with sgRNA targeting Cd6 or EGFP. Two different sgRNAs were used for Cd6 (sg1-CD6 and sg2-CD6). The percentage of CD6 positive cells is indicated in (a). GAPDH serves as a loading control in (b). (c) Immunoblot analysis of Ubash3 molecules in OT-I CD8+ T cells purified from mice constitutively expressing Cas9 and nucleofected with sgRNA targeting Ubash3 molecules or EGFP. Deletion efficiency of Ubash3a and Ubash3b was assessed by western blot using antibodies specific for each Ubash3 molecules. GAPDH was probed as loading control. Two different guides were used to target Ubash3a and Ubash3b molecules and are indicated in parenthesis. (d) Production of IFN-γ by Ubash3s targeted cells. IL-7 and PMA/ionomycin (PI) treatments were used as negative and positive controls respectively. Bar graph depicts the mean percentages of IFN-γ + cells after stimulation with the indicated concentrations of G4, T4, N4 or with IL-7 and PI. Each condition of stimulation is the results of three independent transfections of two different guides targeting specifically each Ubash3 molecules. For the double inactivation of the Ubash3 molecules, sgUBASH3A(2) has been combined with sgUBASH3B(1) or sgUBASH3B(2). (Unpaired two-tailed welch t-test with n = 6, ns: not significant; * P ≤ 0.05, ** P ≤ 0.01; *** P ≤ 0.001. Only tests for which the mean difference is greater than 5% and the p-value is lower than 5% are shown). Source data

Comment in

References

    1. Zehn D, Lee SY, Bevan MJ. Complete but curtailed T-cell response to very low- affinity antigen. Nature. 2009;458:211–214. doi: 10.1038/nature07657. - DOI - PMC - PubMed
    1. Ozga AJ, et al. pMHC affinity controls duration of CD8+ T cell-DC interactions and imprints timing of effector differentiation versus expansion. J. Exp. Med. 2016;213:2811–2829. doi: 10.1084/jem.20160206. - DOI - PMC - PubMed
    1. Lever M, et al. Architecture of a minimal signaling pathway explains the T-cell response to a 1 million-fold variation in antigen affinity and dose. Proc. Natl Acad. Sci. USA. 2016;113:E6630–E6638. doi: 10.1073/pnas.1608820113. - DOI - PMC - PubMed
    1. Skokos D, et al. Peptide-MHC potency governs dynamic interactions between T cells and dendritic cells in lymph nodes. Nat. Immunol. 2007;8:835–844. doi: 10.1038/ni1490. - DOI - PubMed
    1. McKeithan TW. Kinetic proofreading in T-cell receptor signal transduction. Proc. Natl Acad. Sci. USA. 1995;92:5042–5046. doi: 10.1073/pnas.92.11.5042. - DOI - PMC - PubMed

Publication types