. 2022 Sep;609(7927):569-574.
doi: 10.1038/s41586-022-05137-7. Epub 2022 Aug 31.

The role of somatosensory innervation of adipose tissues

Affiliations

The role of somatosensory innervation of adipose tissues

Yu Wang et al. Nature. 2022 Sep.

Abstract

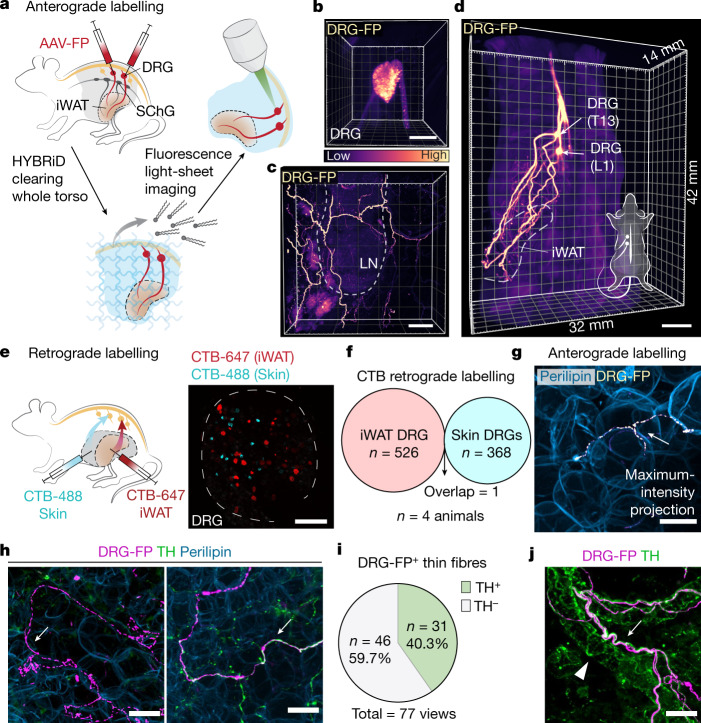
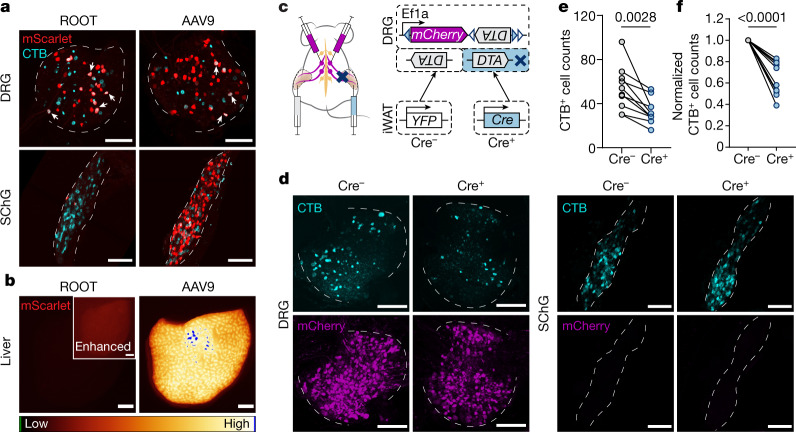
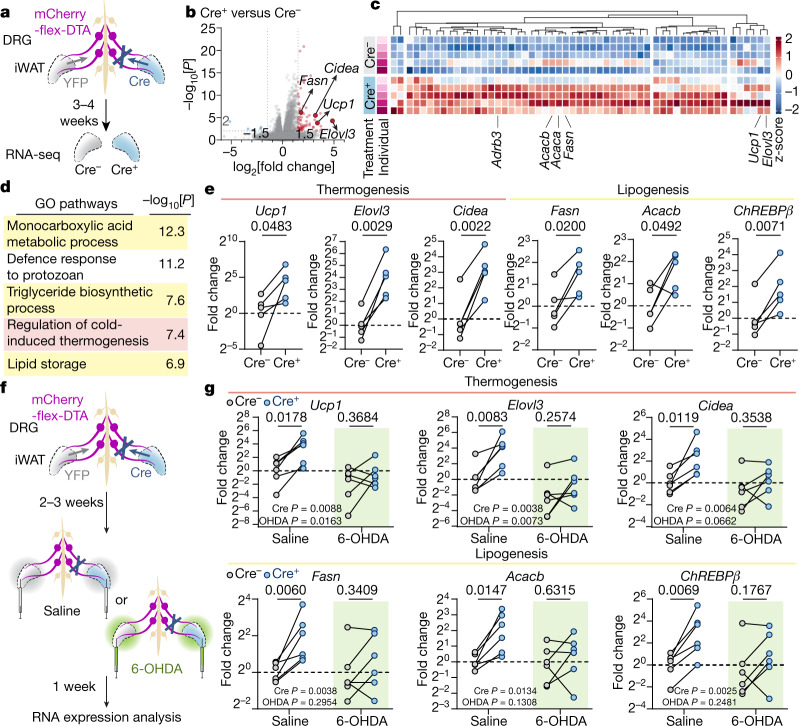
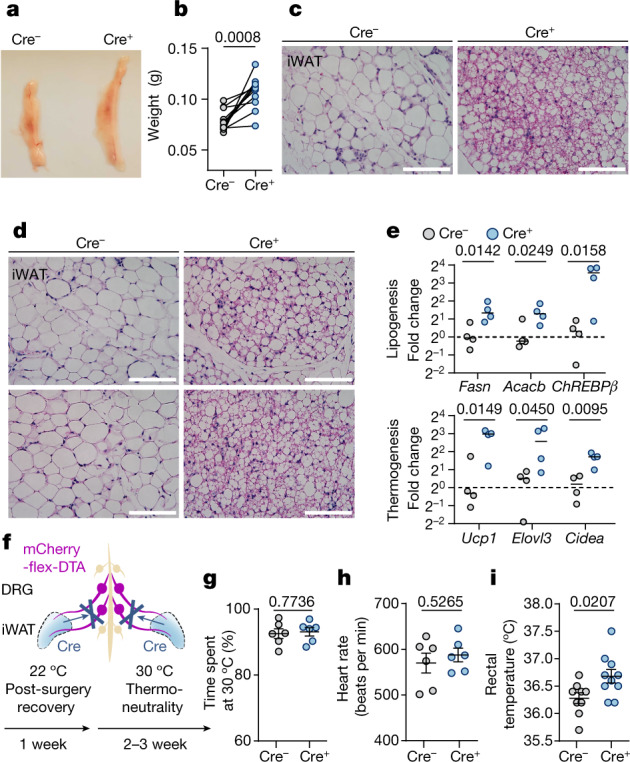
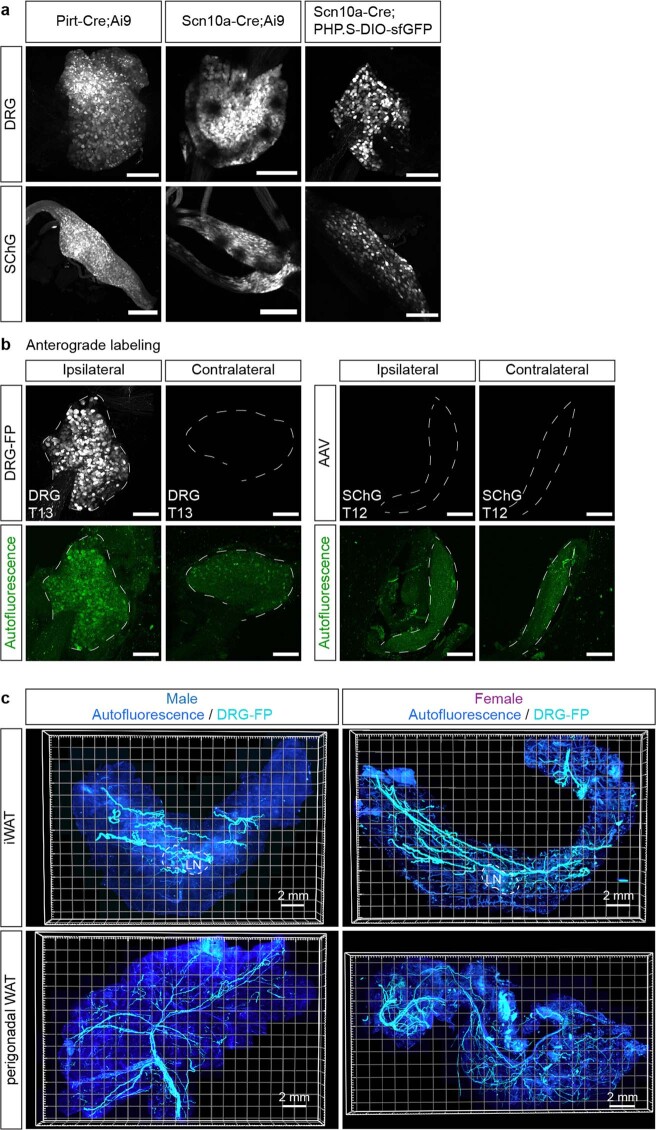
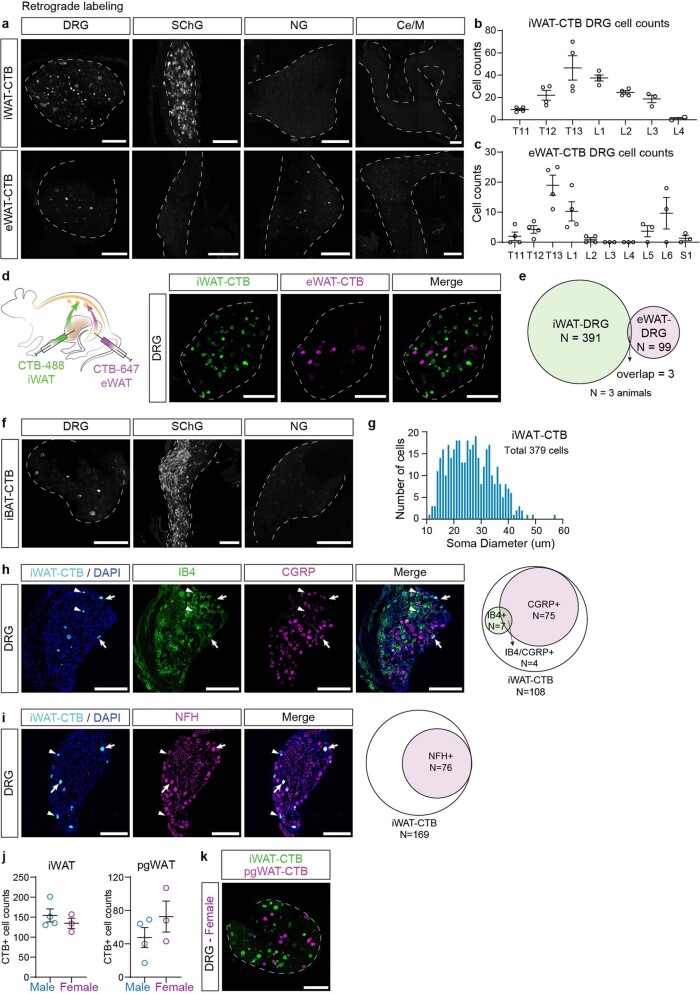
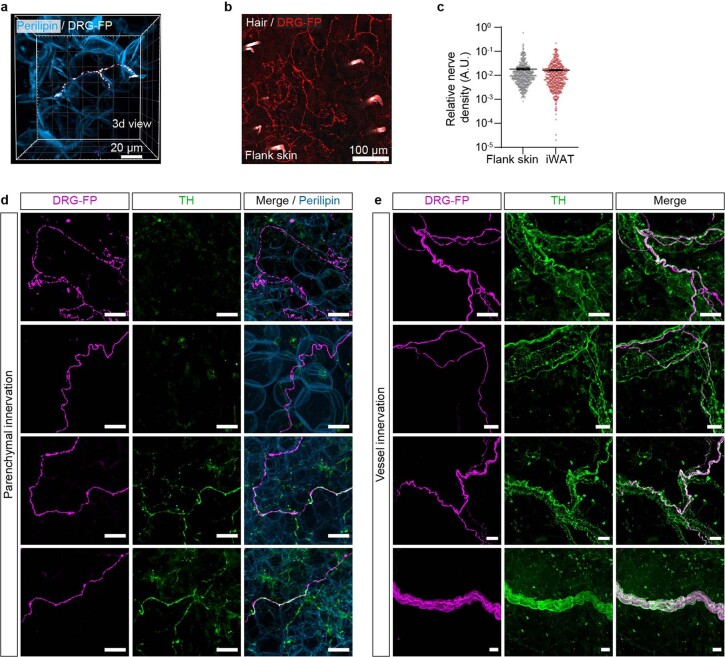
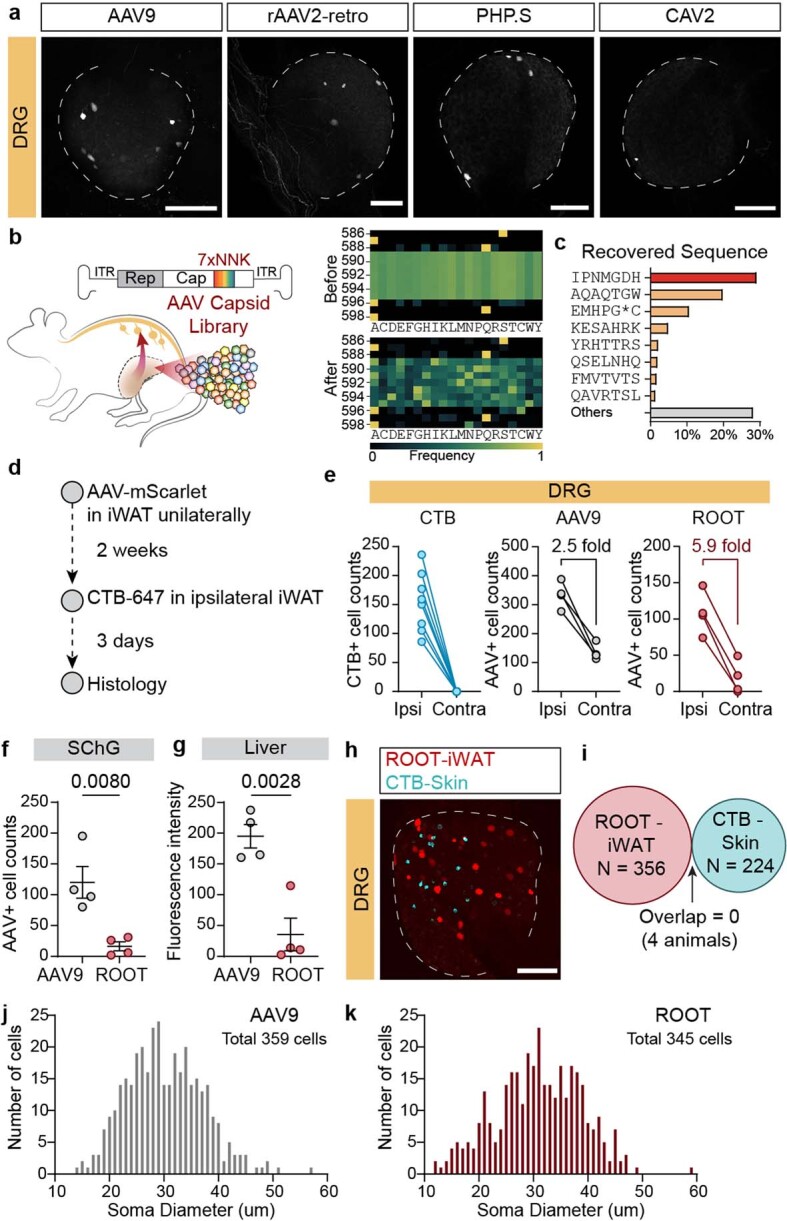
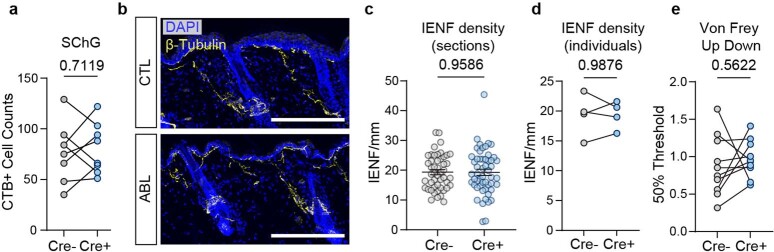
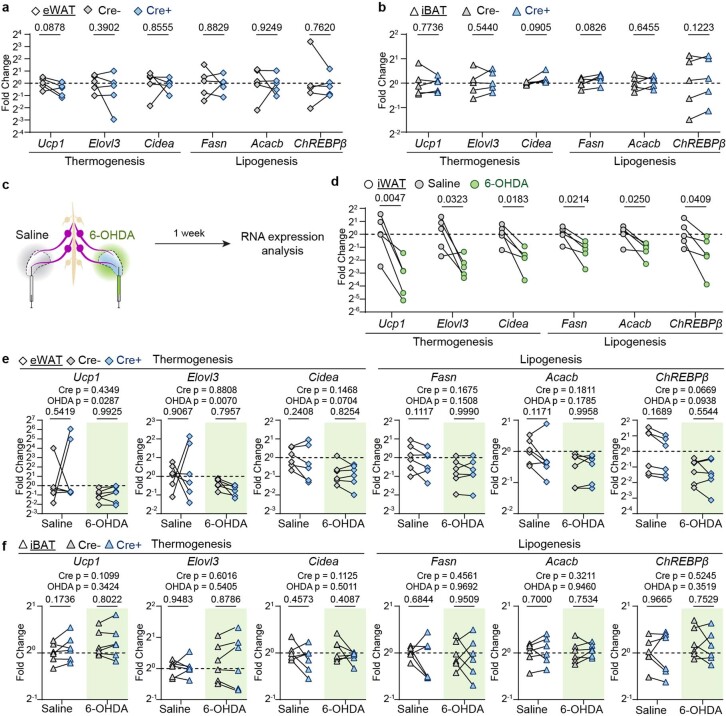
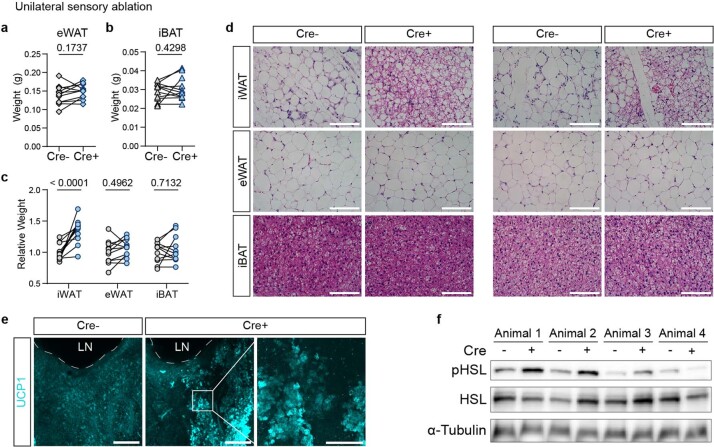
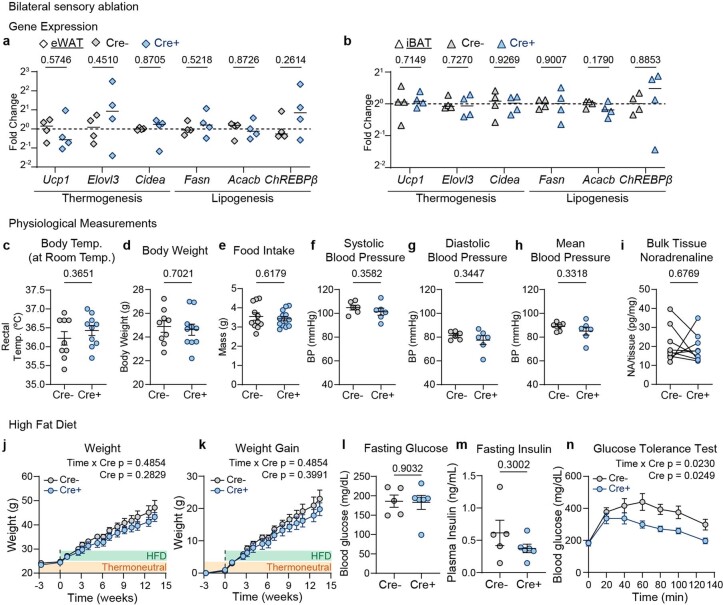
Adipose tissues communicate with the central nervous system to maintain whole-body energy homeostasis. The mainstream view is that circulating hormones secreted by the fat convey the metabolic state to the brain, which integrates peripheral information and regulates adipocyte function through noradrenergic sympathetic output1. Moreover, somatosensory neurons of the dorsal root ganglia innervate adipose tissue2. However, the lack of genetic tools to selectively target these neurons has limited understanding of their physiological importance. Here we developed viral, genetic and imaging strategies to manipulate sensory nerves in an organ-specific manner in mice. This enabled us to visualize the entire axonal projection of dorsal root ganglia from the soma to subcutaneous adipocytes, establishing the anatomical underpinnings of adipose sensory innervation. Functionally, selective sensory ablation in adipose tissue enhanced the lipogenic and thermogenetic transcriptional programs, resulting in an enlarged fat pad, enrichment of beige adipocytes and elevated body temperature under thermoneutral conditions. The sensory-ablation-induced phenotypes required intact sympathetic function. We postulate that beige-fat-innervating sensory neurons modulate adipocyte function by acting as a brake on the sympathetic system. These results reveal an important role of the innervation by dorsal root ganglia of adipose tissues, and could enable future studies to examine the role of sensory innervation of disparate interoceptive systems.


Conflict of interest statement

The authors declare no competing interests.

Figures

Fig. 1
Fig. 1. Adipose tissues receive robust somatosensory innervations.
a, The workflow of mapping sensory innervation in adipose tissues. Tissues from mice with AAV expressing fluorescent protein (FP) injected in T13/L1 DRGs (vertebral level T13 and L1) were processed for en bloc HYBRiD clearing and fluorescence microscopy imaging. bd, Representative 3D image volume of AAV-labelled DRGs (T13) by light-sheet imaging (b), DRG fibres in the iWAT by confocal imaging (showing lymph node (LN) as a landmark) (c) and DRG axonal projections in an adult mouse torso (d). The colour gradient suggests relative intensity. LN, lymph node. e, Schematic of dual-colour CTB labelling from iWAT and flank skin (left) and representative whole-mount image of DRGs (right, T13). f, Quantification of CTB-positive cell numbers from labelling in the iWAT and skin. n = 4 mice. g, Representative image of virally labelled DRG fibre in close apposition to an adipocyte. h, Representative image of TH and TH+ parenchymal DRG innervation. i, Quantification of the percentage of TH+ DRG fibres (77 views in 13 images from 3 biological samples). j, Representative image of virally labelled DRG fibre travelling along vasculature. The white arrows mark DRG fibres, and the white triangle marks TH-stained sympathetic fibres. Scale bars, 200 μm (b and e), 500 μm (c), 5 mm (d) and 30 μm in (g, h and j). Source data
Fig. 2
Fig. 2. Combinatorial strategy for specific iWAT-DRG manipulation.
a,b, Comparison of ROOT and AAV9 for retrograde labelling in the iWAT. a, Representative whole-mount images of DRGs (T13) and SChGs (T12) labelled by ROOT-mScarlet or AAV9-mScarlet and a sequential CTB-647 injection from iWAT. Some of the AAV and CTB double-positive cells are highlighted by white arrows. CTB labels 26.42 ± 6.49% of ROOT-labelled neurons, and 9.95 ± 0.92% of AAV9-labelled neurons in T13/L1 DRGs. Data are mean ± s.e.m. n = 4 mice per group. b, Representative images of livers from animals with ROOT-mScarlet or AAV9-mScarlet injected into the iWAT. cf, Combinatorial viral strategy for Cre-dependent ablation of iWAT DRGs. c, Schematic of the combinatorial viral strategy for unilateral sensory ablation. Each mouse has AAV-mCherry-flex-DTA injected into the bilateral T13/L1 DRGs, and ROOT-YFP or ROOT-Cre injected into the iWAT unilaterally. Three weeks after surgery, CTB-647 was injected into the iWAT bilaterally. d, Representative whole-mount images of contralateral (Cre) and ipsilateral (Cre+) DRGs (T13) and SChGs (T12). e,f, Quantification of CTB+ cell numbers (e) and normalized cell numbers (f) in T13 and L1 DRGs labelled from iWAT. n = 10 mice. Statistical analysis was performed using two-tailed paired t-tests. P values are shown at the top. For a,b and d, scale bars, 200 μm. Source data
Fig. 3
Fig. 3. Ablation of iWAT DRGs upregulates thermogenic and lipogenic transcriptional programs.
ae, Transcriptional profiling of the iWAT after Cre-dependent sensory ablation. a, Schematic of transcriptional profiling. The iWAT from mice with Cre-dependent unilateral sensory ablation was processed for RNA-seq analysis. b, RNA-seq results. Statistical analysis was performed using Wald tests. c, Heat map of upregulated genes identified by RNA-seq analysis. d, Gene Ontology (GO) enrichment analysis of upregulated genes. e, qPCR with reverse transcription (RT–qPCR) analysis of thermogenic and lipogenic genes in the iWAT after unilateral sensory ablation. n = 5 mice. Statistical analysis was performed using two-tailed paired t-tests. f,g, Transcriptional analysis of iWAT with sensory ablation and sympathetic ablation. f, Schematic of sensory and sympathetic double ablation. Mice with Cre-dependent unilateral sensory ablation were subjected to bilateral sympathetic 6-OHDA denervation. g, RT–qPCR analysis of thermogenic and lipogenic genes in the iWAT with or without sympathetic denervation. n = 6 mice per group. Statistical analysis was performed using two-way analysis of variance with Sidak’s multiple-comparisons test. Source data
Fig. 4
Fig. 4. Ablation of iWAT DRGs changes the morphological and physiological properties of the iWAT.
a,b, Representative images (a) and quantification of fat mass (b) of iWAT with Cre-dependent unilateral sensory ablation. n = 11 mice. Statistical analysis was performed using two-tailed paired t-tests. c, Histology of iWAT with Cre-dependent unilateral sensory ablation. d, Histology of iWAT with Cre-dependent bilateral sensory ablation. Each panel is from a different mouse. e, RT–qPCR analysis of iWAT with Cre-dependent bilateral sensory ablation. n = 4 mice per group. Statistical analysis was performed using two-tailed unpaired t-tests. f–i, Physiological measurements after Cre-dependent bilateral sensory ablation. f, Schematic of bilateral sensory ablation, and the timeline of physiological measurement. g, Two-temperature choice assay (30 °C versus 18 °C) of Cre (n = 6) and Cre+ (n = 6) mice. h, Heart rate of Cre (n = 6) and Cre+ (n = 6) mice. i, Rectal temperature at thermoneutrality of Cre (n = 9) and Cre+ (n = 10) mice. For gi, data are mean ± s.e.m. Statistical analysis was performed using two-tailed unpaired t-tests with Welch’s correction (gi). For c and d, scale bars, 100 μm. Source data
Extended Data Fig. 1
Extended Data Fig. 1. Anterograde labelling maps somatosensory innervation in adipose tissues.
a, Representative images of DRG (T13), sympathetic chain ganglia SChG (T12) from Pirt-Cre;Ai9, Scn10a-Cre;Ai9 and Scn10a-Cre with systemic viral labelling (PHP.S-DIO-sfGFP) (3 mice per line). Scale bar: 200 μm. b, Representative images of DRG (T13), SChG (T12) from mice with unilateral intraganglionic viral injection in T13 DRG (from 3 mice). Autofluorescence (647 nm laser) is used to show the tissue outline. Scale bar: 200 μm. c, Representative images of iWAT and perigonadal WAT (pgWAT, refers to eWAT for male and periovarian WAT for female) from mice with intraganglionic injections of AAV expressing fluorescent protein (FP) in T13 and L1 DRGs (from 3 mice).
Extended Data Fig. 2
Extended Data Fig. 2. Retrograde labelling confirms somatosensory innervation of adipose tissues.
a, Representative images of DRG (T13), SChG (T12), nodose ganglion (NG), and celiac/superior mesenteric complex (Ce/M) from mice with CTB-647 injected into iWAT or eWAT. b–c, Quantification of CTB labelled cell numbers in DRG labelled from iWAT (b) or eWAT (c) along the vertebral levels. n = 4 per group. d, Schematics of dual-colour CTB labelling from iWAT and eWAT (left) and representative images of T13 DRG. e, Quantification of CTB positive cells from iWAT and eWAT. (n = 3 mice). f, Representative images of DRG (T3), SChG (stellate ganglion and T1 SChG) and NG from mice with CTB-488 injected into iBAT. g, Quantification of CTB labelled DRG soma size distribution from mice with CTB-647 injected into iWAT (n = 3 mice). h–i, Representative images and quantification of cell type of CTB labelled DRG neurons (from 4 mice). j, Quantification of total CTB labelled neurons from DRG (T11-L6) in male and female mice with CTB injected into iWAT or eWAT (n = 4 for male mice, and n = 3 for female mice). k, Representative image of DRG (L1) from female mice with dual-colour CTB labelling from iWAT and pgWAT (from 3 mice). All values are mean ± s.e.m. in b, c, j. Scale bar: 200 μm. Source data
Extended Data Fig. 3
Extended Data Fig. 3. Anterograde labelling reveals the morphological features of somatosensory fibres in iWAT.
a, 3D view of intraganglionically fluorescent protein (FP) labelled DRG (T13 and L1) fibres in close apposition to adipocytes. b, Representative image of intraganglionically FP labelled DRG (T13 and L1) fibres in flank skin. c, Quantification of relative nerve density of intraganglionically FP labelled DRG (T13 and L1) fibres in flank skin (466 views from 39 images from 3 biological replicates) and iWAT (468 views from 31 images from 2 biological replicates). All values are mean ± s.e.m. d–e, Representative images of intraganglionically FP labelled DRG (T13 and L1) fibres in adipose parenchyma (d) and travelling along the vessel (e). Scale bar: 30 μm. Source data
Extended Data Fig. 4
Extended Data Fig. 4. Development and characterization of retrograde vector optimized for organ tracing (ROOT).
a, Representative images of DRG (T13) from mice with AAV9, rAAV2-retro, PHP.S, or CAV2 injected into iWAT. Scale bar: 200 μm. b-c, Development of ROOT. b, Schematics of in vivo selection of retrograde vector and amino acid enrichment after one-round selection. c, Quantification of the abundance of recovered sequence with peptide insertion. d–g, Comparison of ROOT and AAV9. d, Workflow of ROOT and AAV9 comparison. e, Quantification of AAV+ cell numbers in ipsilateral and contralateral DRGs (T11-L3). f, Quantification of AAV+ cell numbers in ipsilateral SChG (T12). g, Quantification of bulk fluorescence intensity of liver. All values are mean ± s.e.m. Statistics determined by two-tailed unpaired t test in f, g. h–i, Representative image of DRG (T13) (h) and quantification of cell numbers (i) from mice with ROOT-mScarlet injected in iWAT and CTB injected in flank skin. Scale bar: 200 μm. jk, Quantification of AAV labelled DRG soma size distribution from mice with AAV9 (j) or ROOT (k) injected into iWAT (n = 2 mice for AAV9, n = 5 mice for ROOT). Source data
Extended Data Fig. 5
Extended Data Fig. 5. Characteriztaion of Cre-dependent unilateral ablation of iWAT-DRGs.
a, Quantification of CTB labelled cells in SChG (T12). n = 8. Statistics determined by two-tailed paired t test. b, Representative images of flank skin nerve fibres. Scale bar: 200 μm. c–d, Quantification of intra epidermal nerve fibre (IENF) density of flank skin. n = 4 mice, 10-15 non-continuous sections were quantified per sample. c, Pooled IENF density of flank skin from Cre- side (n = 48) and Cre+ side (n = 53). All values are mean ± s.e.m. Statistics determined by two-tailed unpaired t test. d, Average IENF density per animal. Statistics determined by two-tailed paired t test. e, Mechanical threshold of hindpaws from mice with unilateral sensory ablation of iWAT innervation. n = 10 mice. Statistics determined by two-tailed paired t test. Source data
Extended Data Fig. 6
Extended Data Fig. 6. Gene expression analysis of Cre-dependent unilateral ablation of iWAT-DRGs.
a–b, Quantitative RT-PCR analysis of eWAT (a) and iBAT (b) after Cre-dependent unilateral sensory ablation in iWAT. n = 5 mice. Statistics determined by two-tailed paired t test. c–d, Chemical denervation of sympathetic innervation of iWAT. c, Workflow of sympathetic chemical denervation. 6-OHDA was injected into iWAT unilaterally. d, Quantitative RT-PCR analysis of iWAT after sympathetic chemical denervation. Statistics determined by two-tailed paired t test. e–f, Quantitative RT-PCR analysis of eWAT (e) and iBAT (f) after Cre-dependent unilateral sensory ablation and bilateral sympathetic chemical denervation. n = 6 mice per group. Statistics determined by 2-way ANOVA.
Extended Data Fig. 7
Extended Data Fig. 7. Characterization of morphological changes of iWAT after sensory ablation.
a–b, Fat mass of eWAT (a) and iBAT (b) after unilateral sensory ablation of iWAT. n = 11 mice. Statistics determined by two-tailed paired t test. c, Normalized weight of iWAT, eWAT and iBAT. n = 11 mice. Statistics determined by 2-way ANOVA. d, Representative histological images of iWAT, eWAT, iBAT from mice (n = 3) with unilateral sensory ablation of iWAT. Scale bar: 100 μm. e, Digital slice views (200 µm) of UCP1 staining in iWAT from mice (n = 3) with unilateral sensory ablation, showing lymph node (LN) as a landmark. Scale bar: 500 μm. f, Western blot of p-HSL, HSL and α-Tub in iWAT from mice (n = 4) with unilateral sensory ablation. Source data
Extended Data Fig. 8
Extended Data Fig. 8. Characterization of physiological changes of iWAT after sensory ablation.
ab, Quantitative RT-PCR analysis of eWAT (a) and iBAT (b) from mice with bilateral sensory ablation of iWAT (n = 4 mice per group). c–h, Physiological measurement of mice with bilateral sensory ablation. c, Rectal temperature at room temperature of Cre- (n = 9) and Cre+ (n = 10). d, Body weight of Cre- (n = 9) and Cre+ (n = 10). e, 24 h food intake of Cre- (n = 11) and Cre+ (n = 13). f–h, Systolic (f), diastolic (g) and mean (h) blood pressure of Cre- (n = 6) and Cre+ (n = 6). i, Bulk iWAT  noradrenaline (NA) amount in mice with unilateral sensory ablation (n = 9). jn, Metabolic measurement of mice with bilateral sensory ablation on high-fat diet (HFD) in thermoneutral temperature. jk, Body weight (j) and body weight gain (k) of Cre- (n = 5) and Cre+ (n = 6) mice on HFD. l, Fasting glucose levels in Cre- (n = 5) and Cre+ (n = 6) mice after 9 weeks of HFD. m, Fasting plasma insulin levels in Cre- (n = 5) and Cre+ (n = 6) mice after 14 weeks of HFD. n, IP-glucose tolerance test (1 g/kg) in Cre- (n = 5) and Cre+ (n = 6) mice after 9 weeks of HFD. c–h, j–n are shown as mean ± s.e.m. Statistics determined by two-tailed unpaired t test in ab; two-tailed unpaired t test with Welch’s correction in c–h, l–m; 2-way ANOVA in j, k, n. Source data

Comment in

References

    1. Guilherme A, Henriques F, Bedard AH, Czech MP. Molecular pathways linking adipose innervation to insulin action in obesity and diabetes mellitus. Nat. Rev. Endocrinol. 2019;15:207–225. doi: 10.1038/s41574-019-0165-y. - DOI - PMC - PubMed
    1. Bartness TJ, Liu Y, Shrestha YB, Ryu V. Neural innervation of white adipose tissue and the control of lipolysis. Front. Neuroendocrinol. 2014;35:473–493. doi: 10.1016/j.yfrne.2014.04.001. - DOI - PMC - PubMed
    1. Bachman ES, et al. βAR signaling required for diet-induced thermogenesis and obesity resistance. Science. 2002;297:843–845. doi: 10.1126/science.1073160. - DOI - PubMed
    1. Chi J, et al. Three-dimensional adipose tissue imaging reveals regional variation in beige fat biogenesis and PRDM16-dependent sympathetic neurite density. Cell Metab. 2018;27:226–236. - PubMed
    1. Cohen P, Kajimura S. The cellular and functional complexity of thermogenic fat. Nat. Rev. Mol. Cell Biol. 2021;22:393–409. doi: 10.1038/s41580-021-00350-0. - DOI - PMC - PubMed