. 2022 Sep;609(7927):560-568.
doi: 10.1038/s41586-022-05144-8. Epub 2022 Aug 31.

The whisking oscillator circuit

Affiliations

The whisking oscillator circuit

Jun Takatoh et al. Nature. 2022 Sep.

Abstract

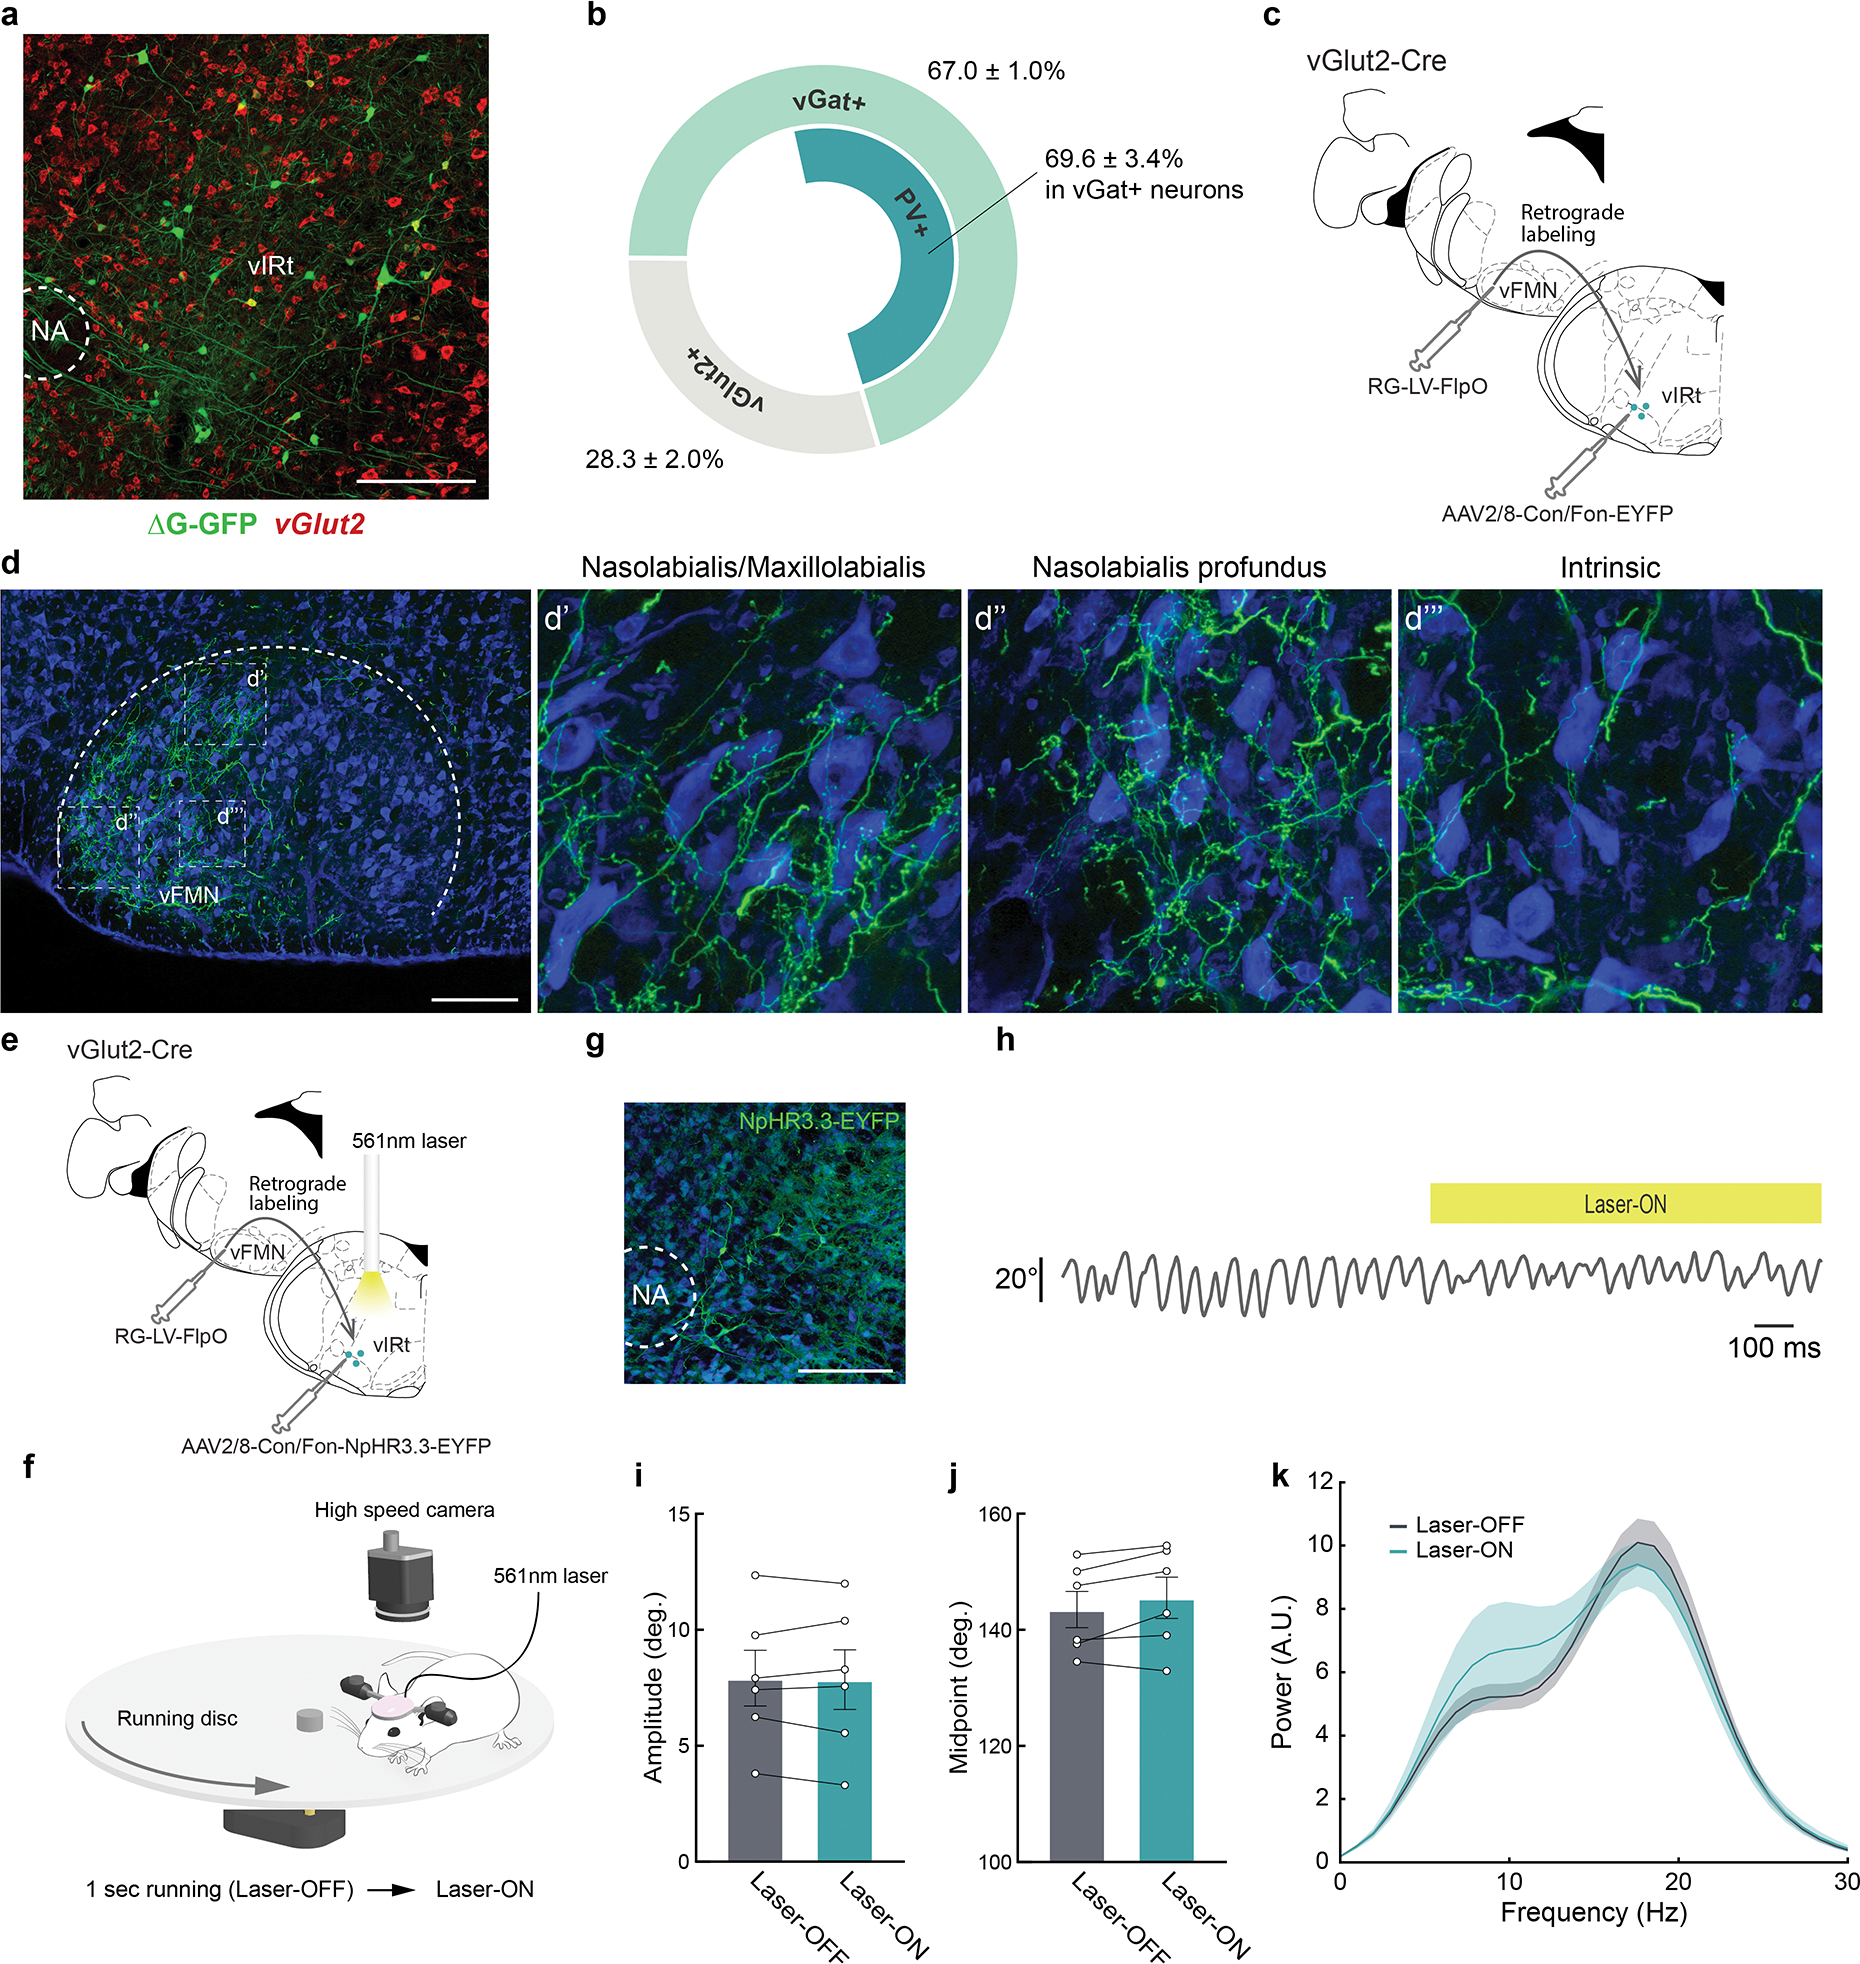
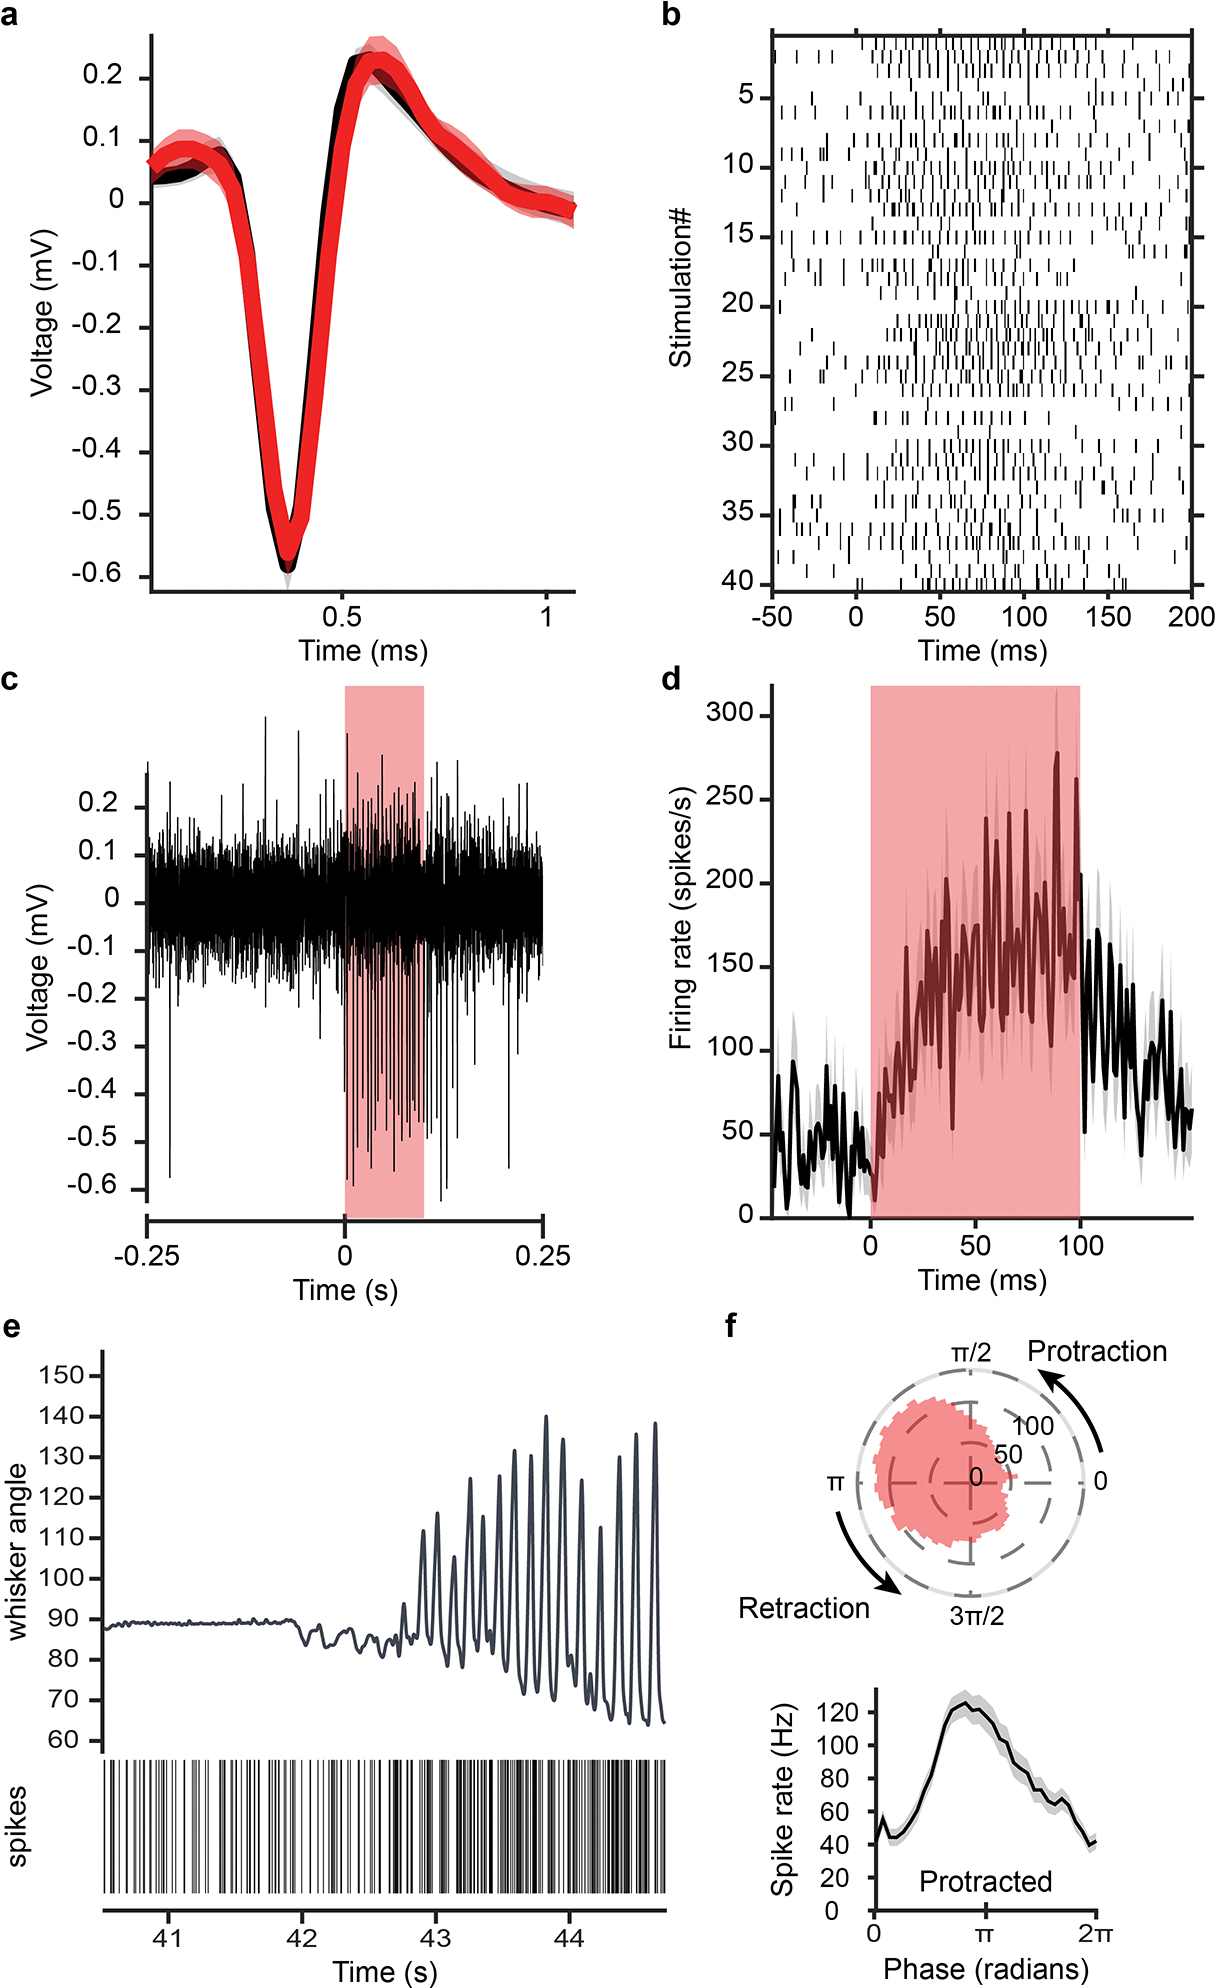
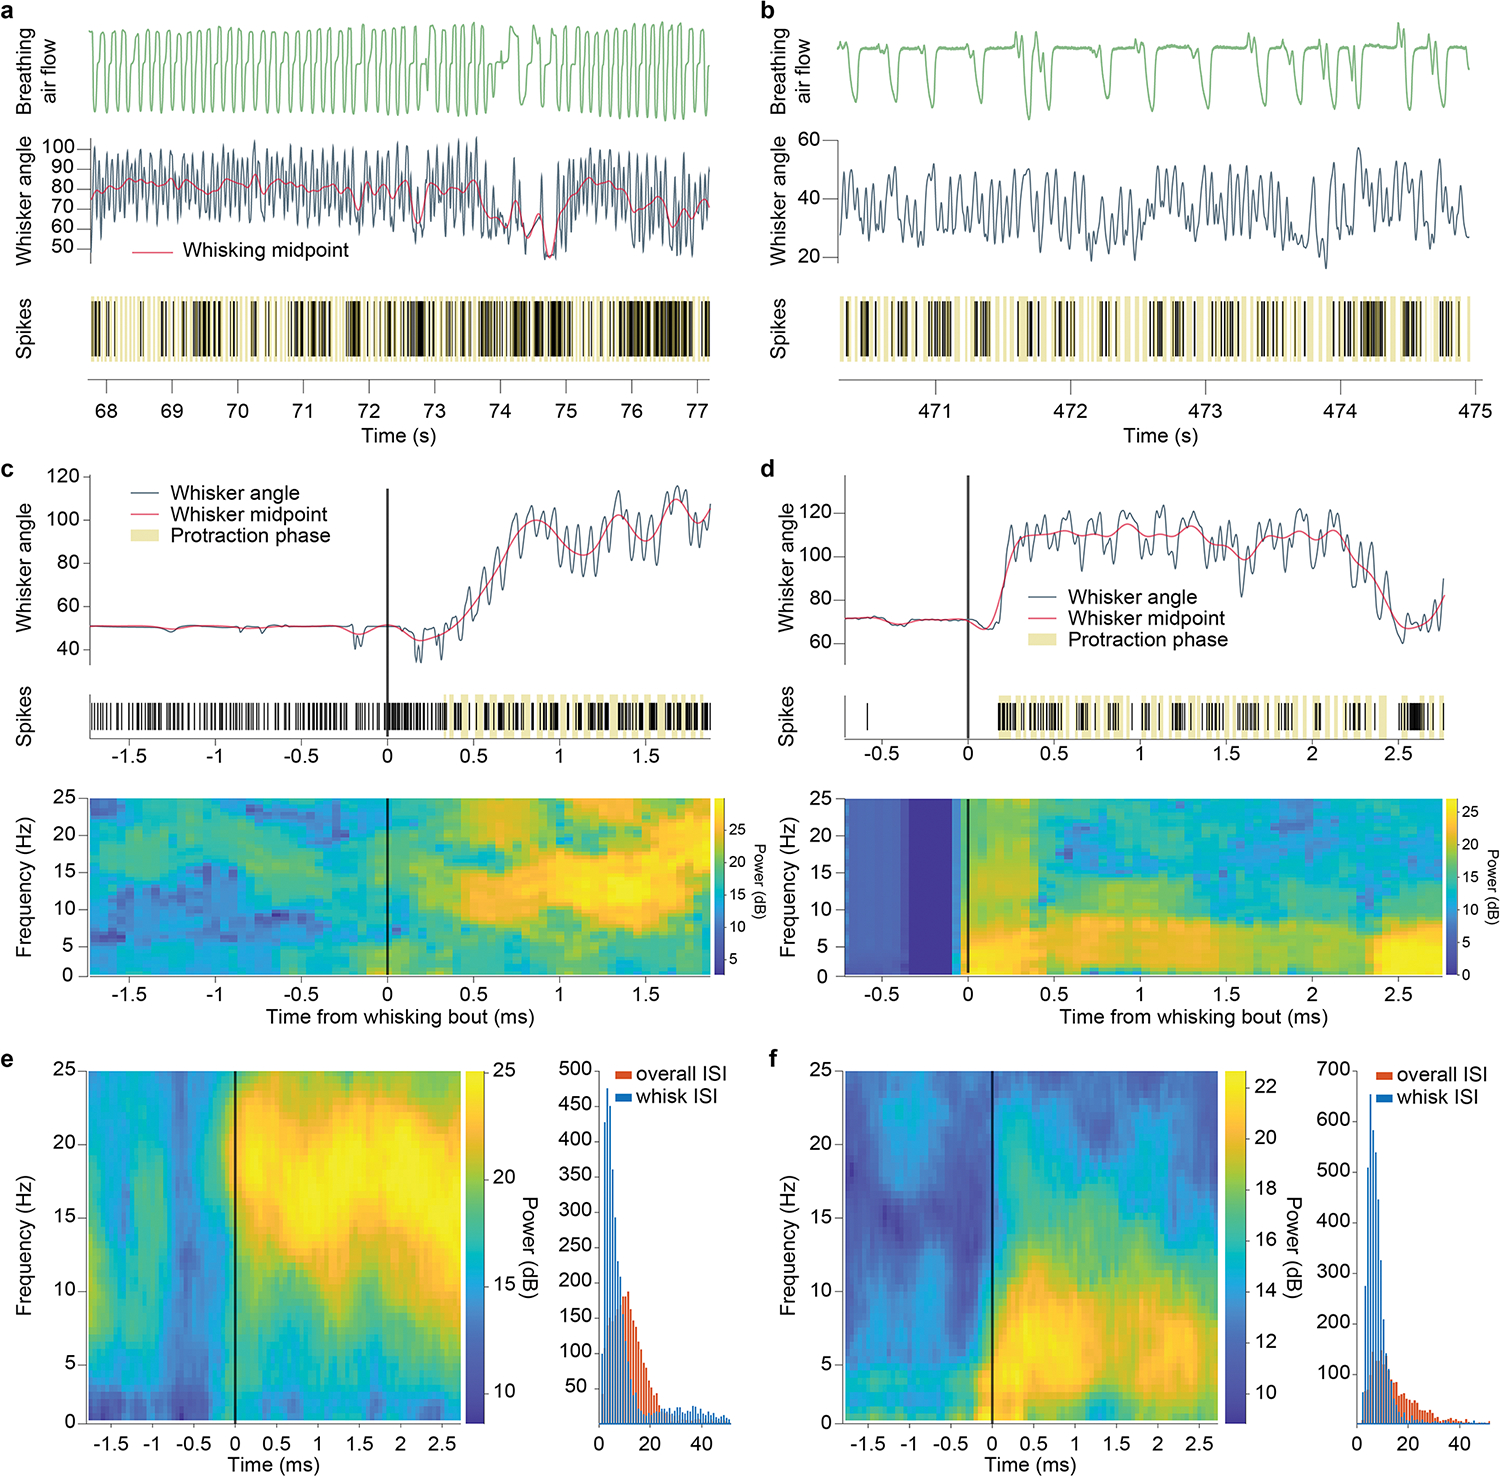
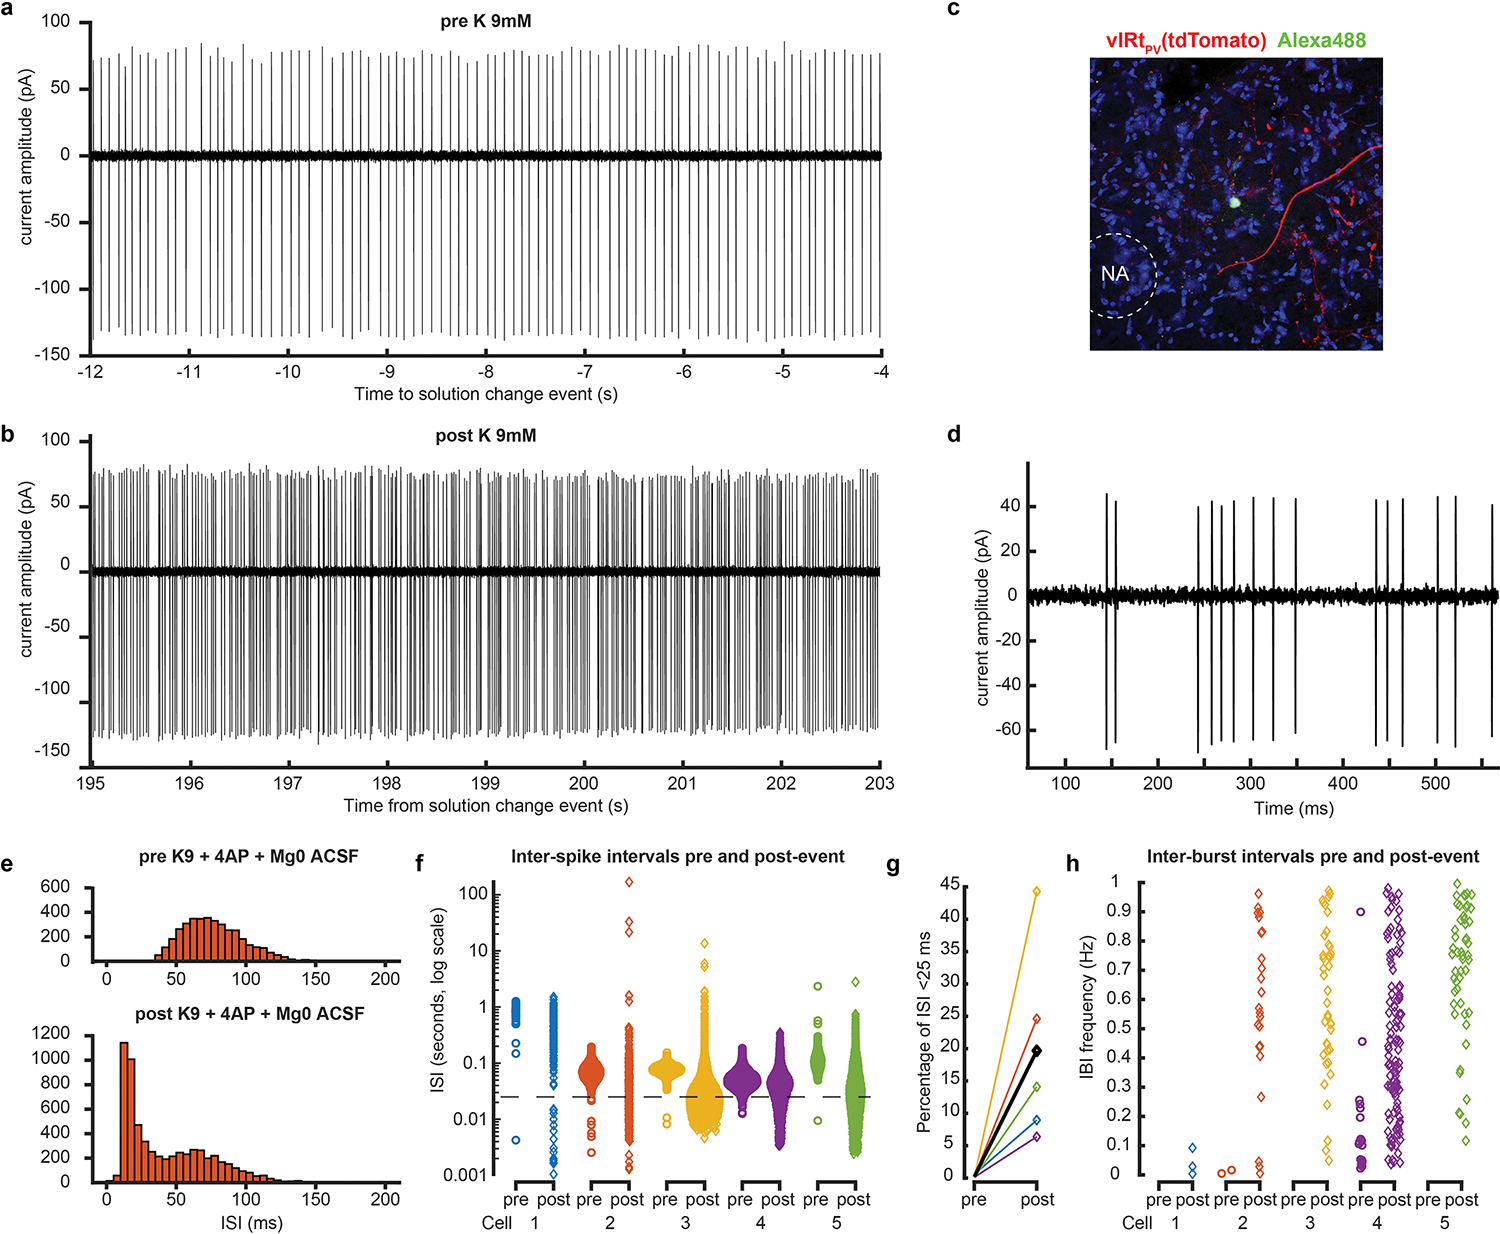
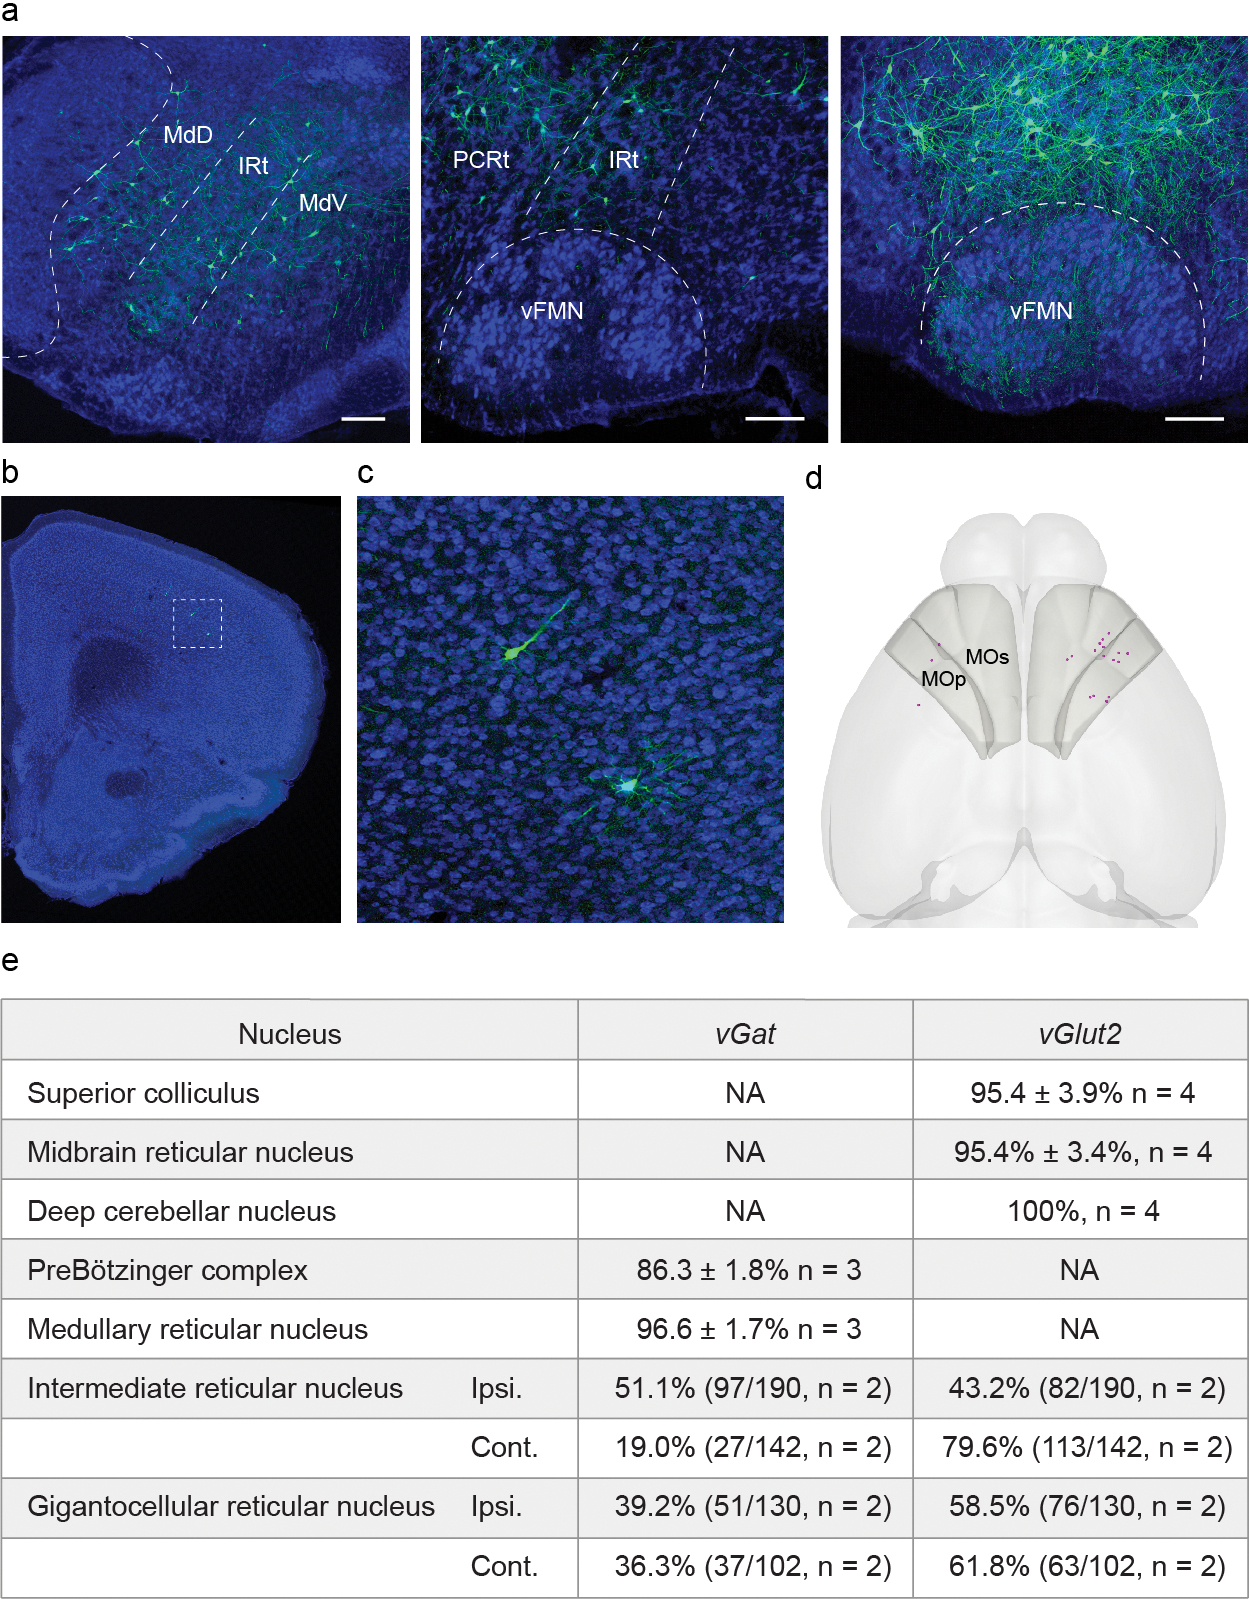
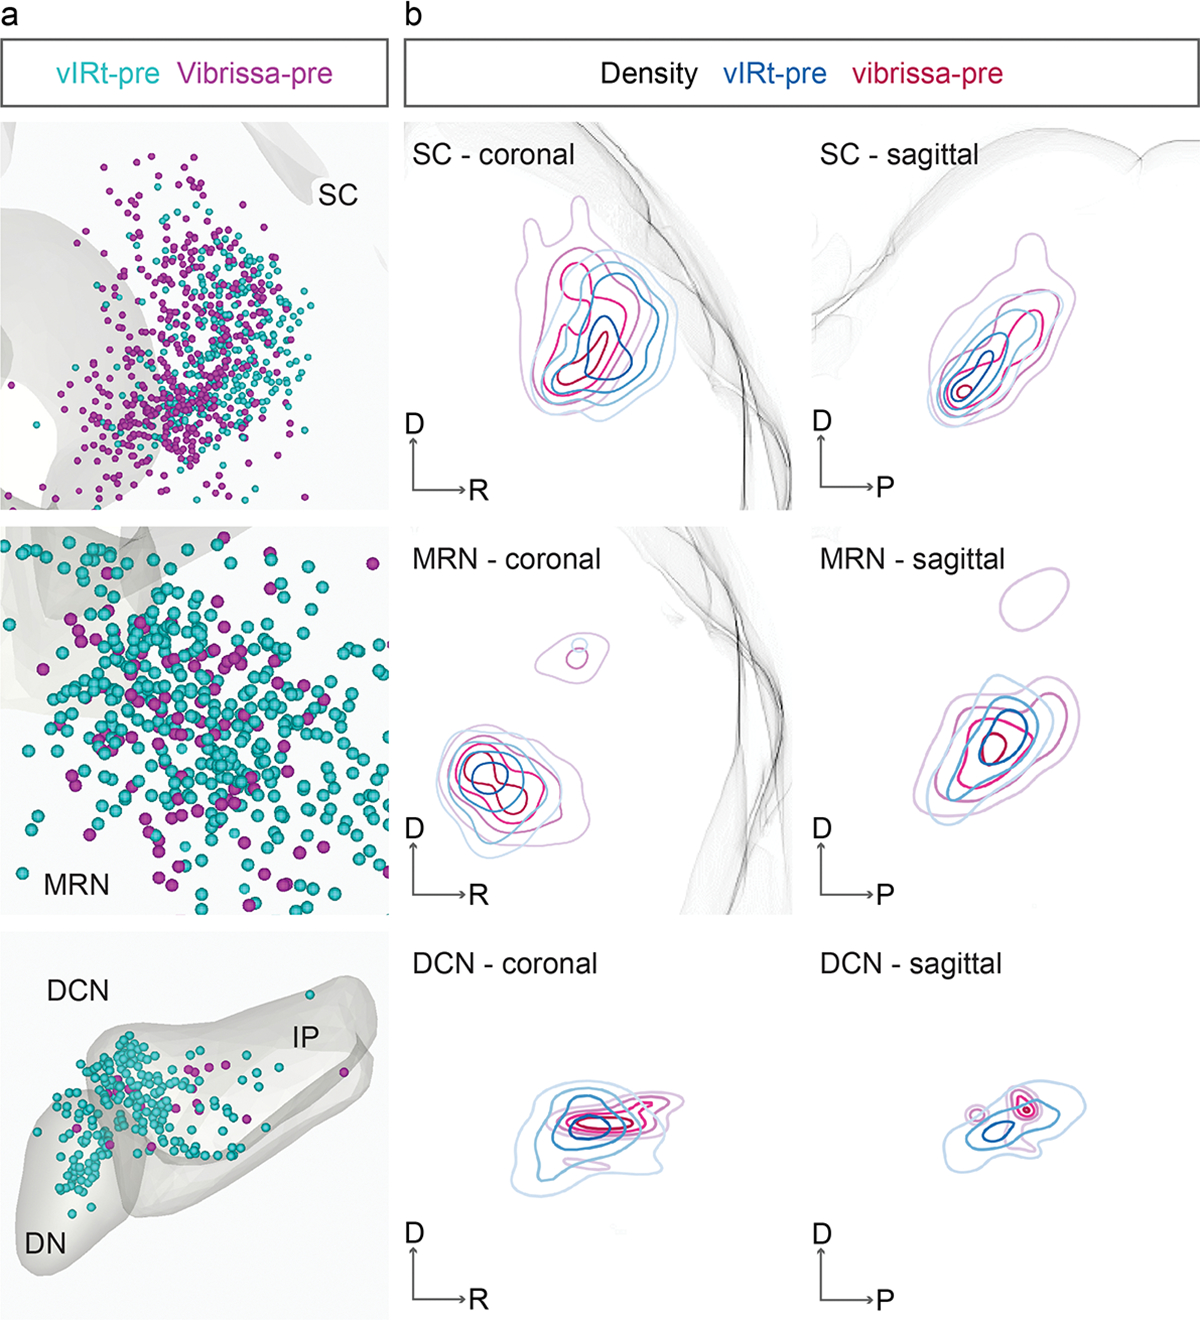
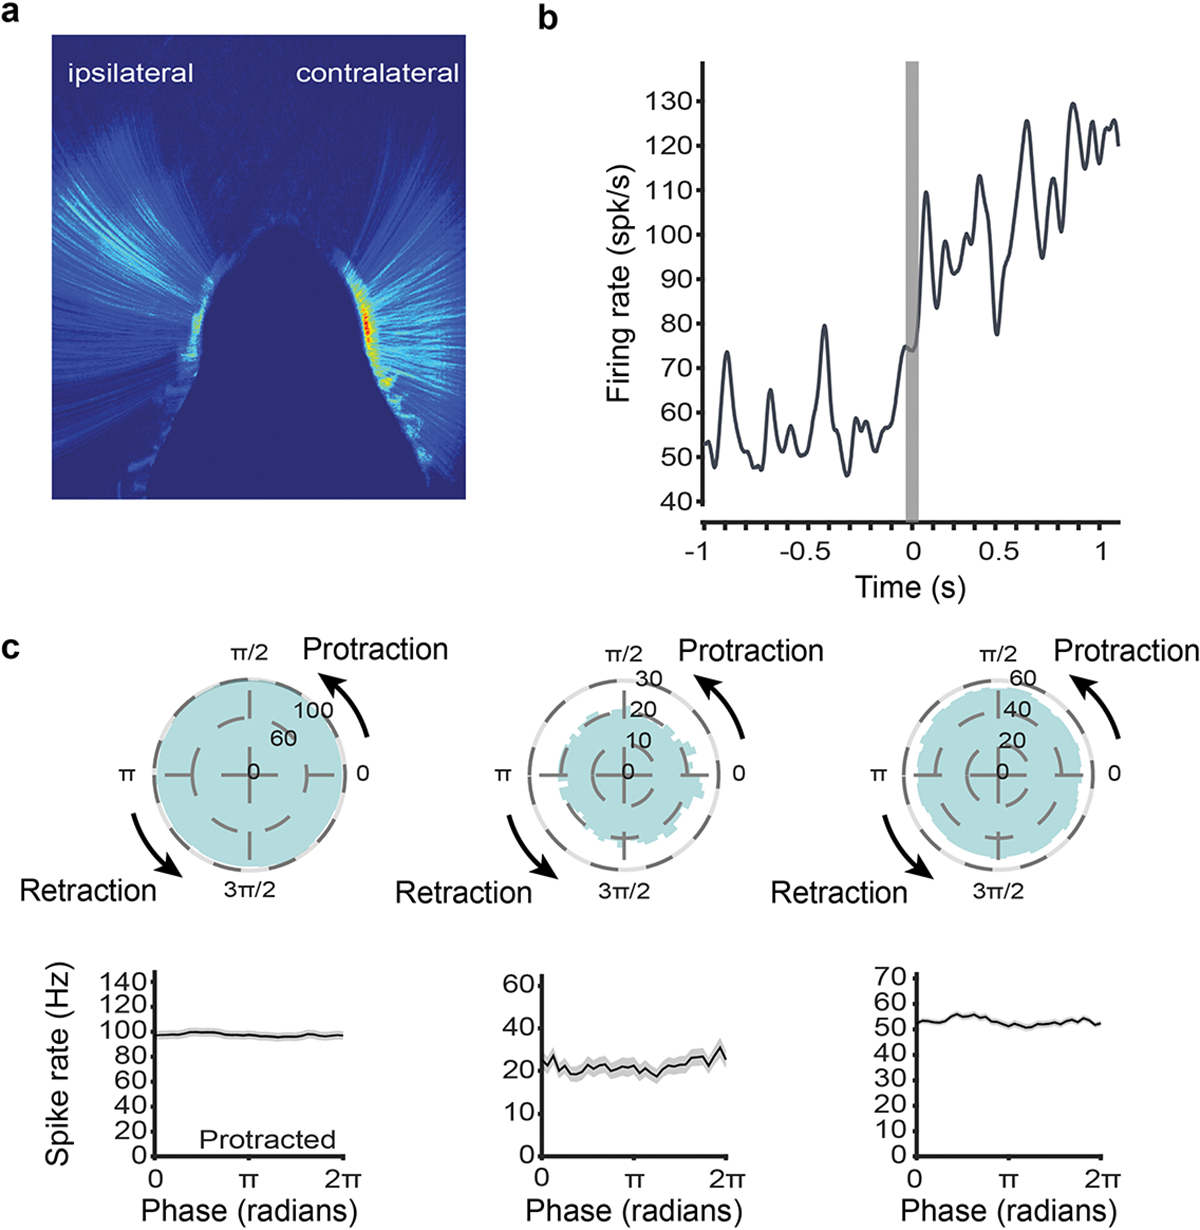
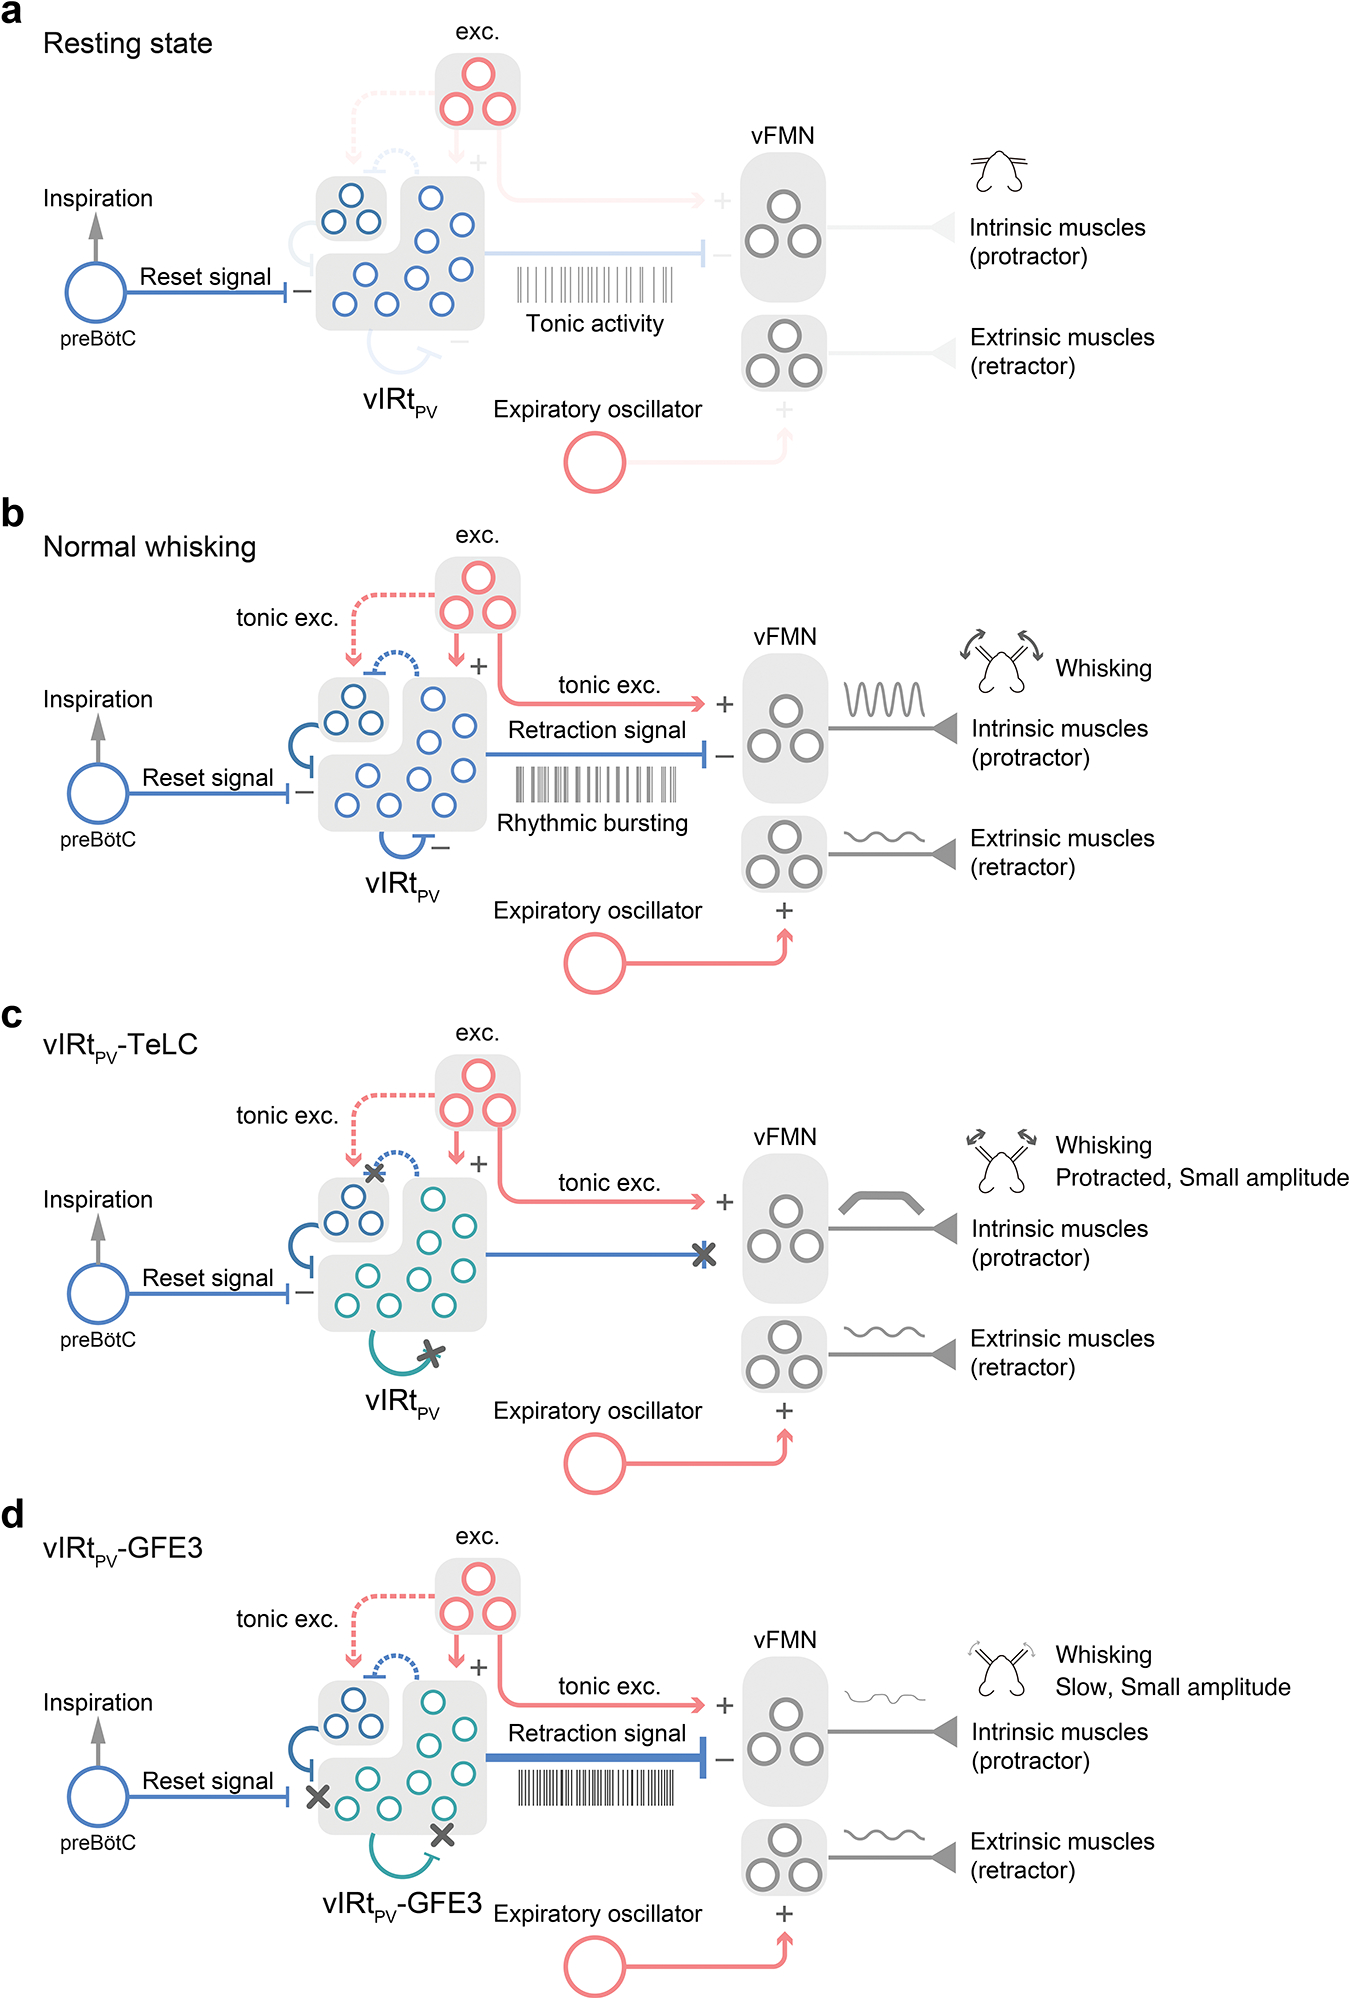
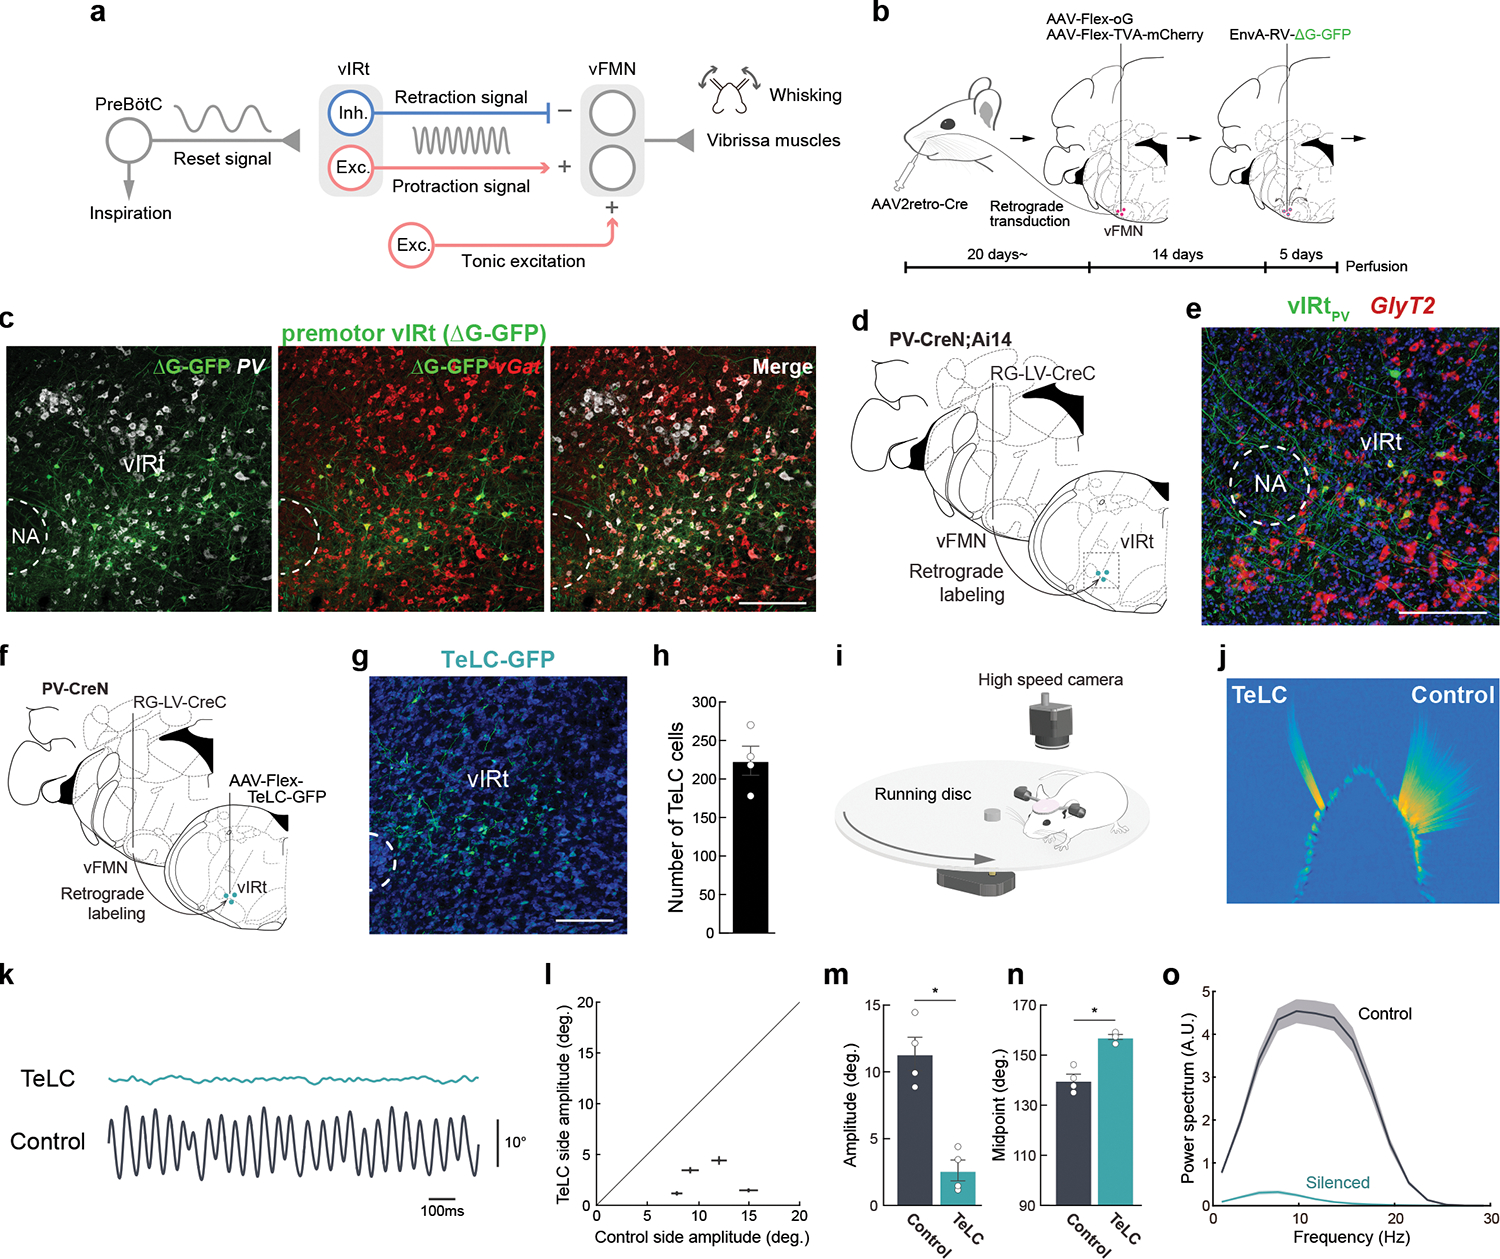
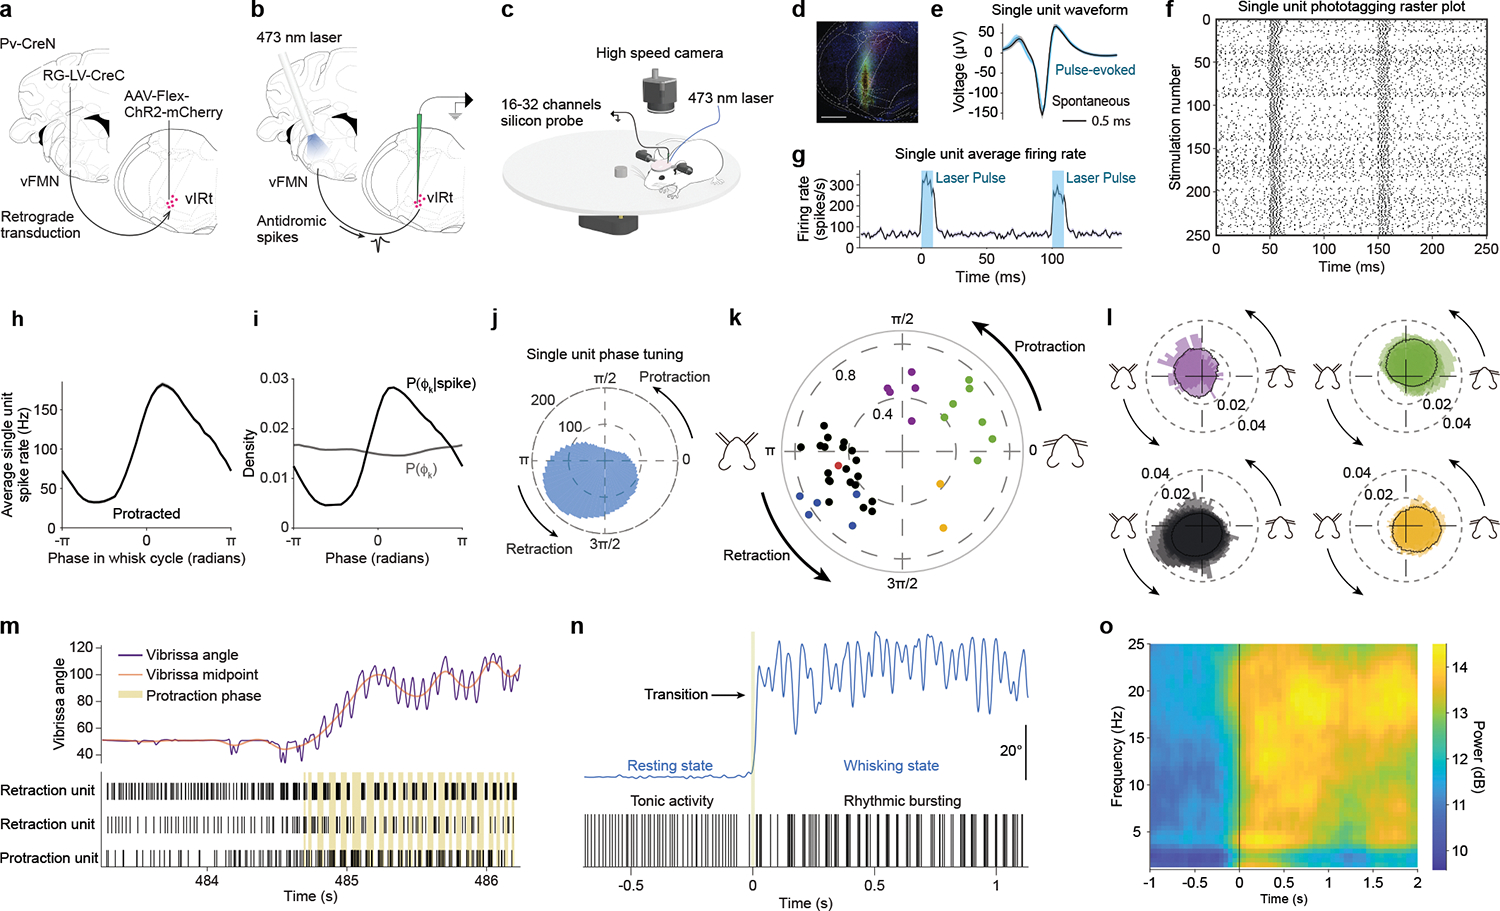
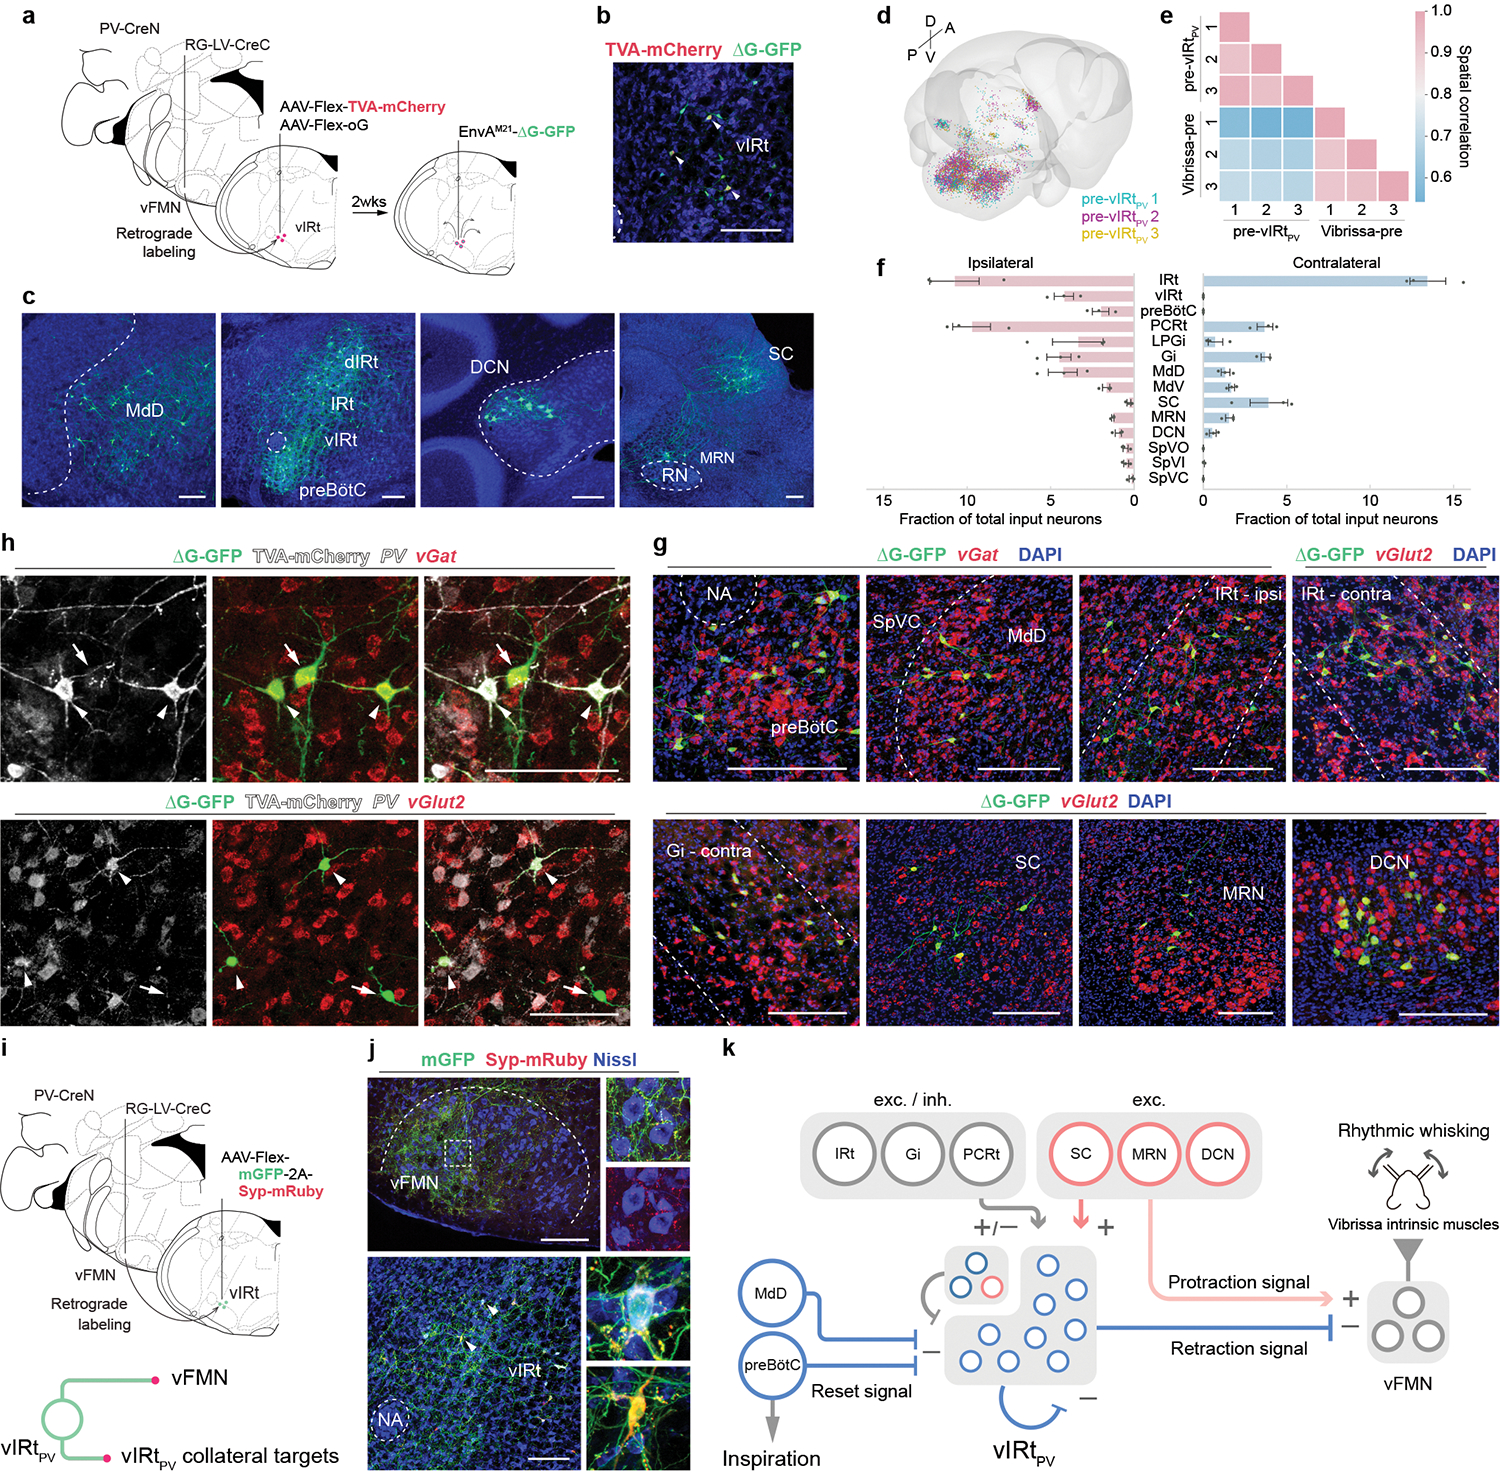
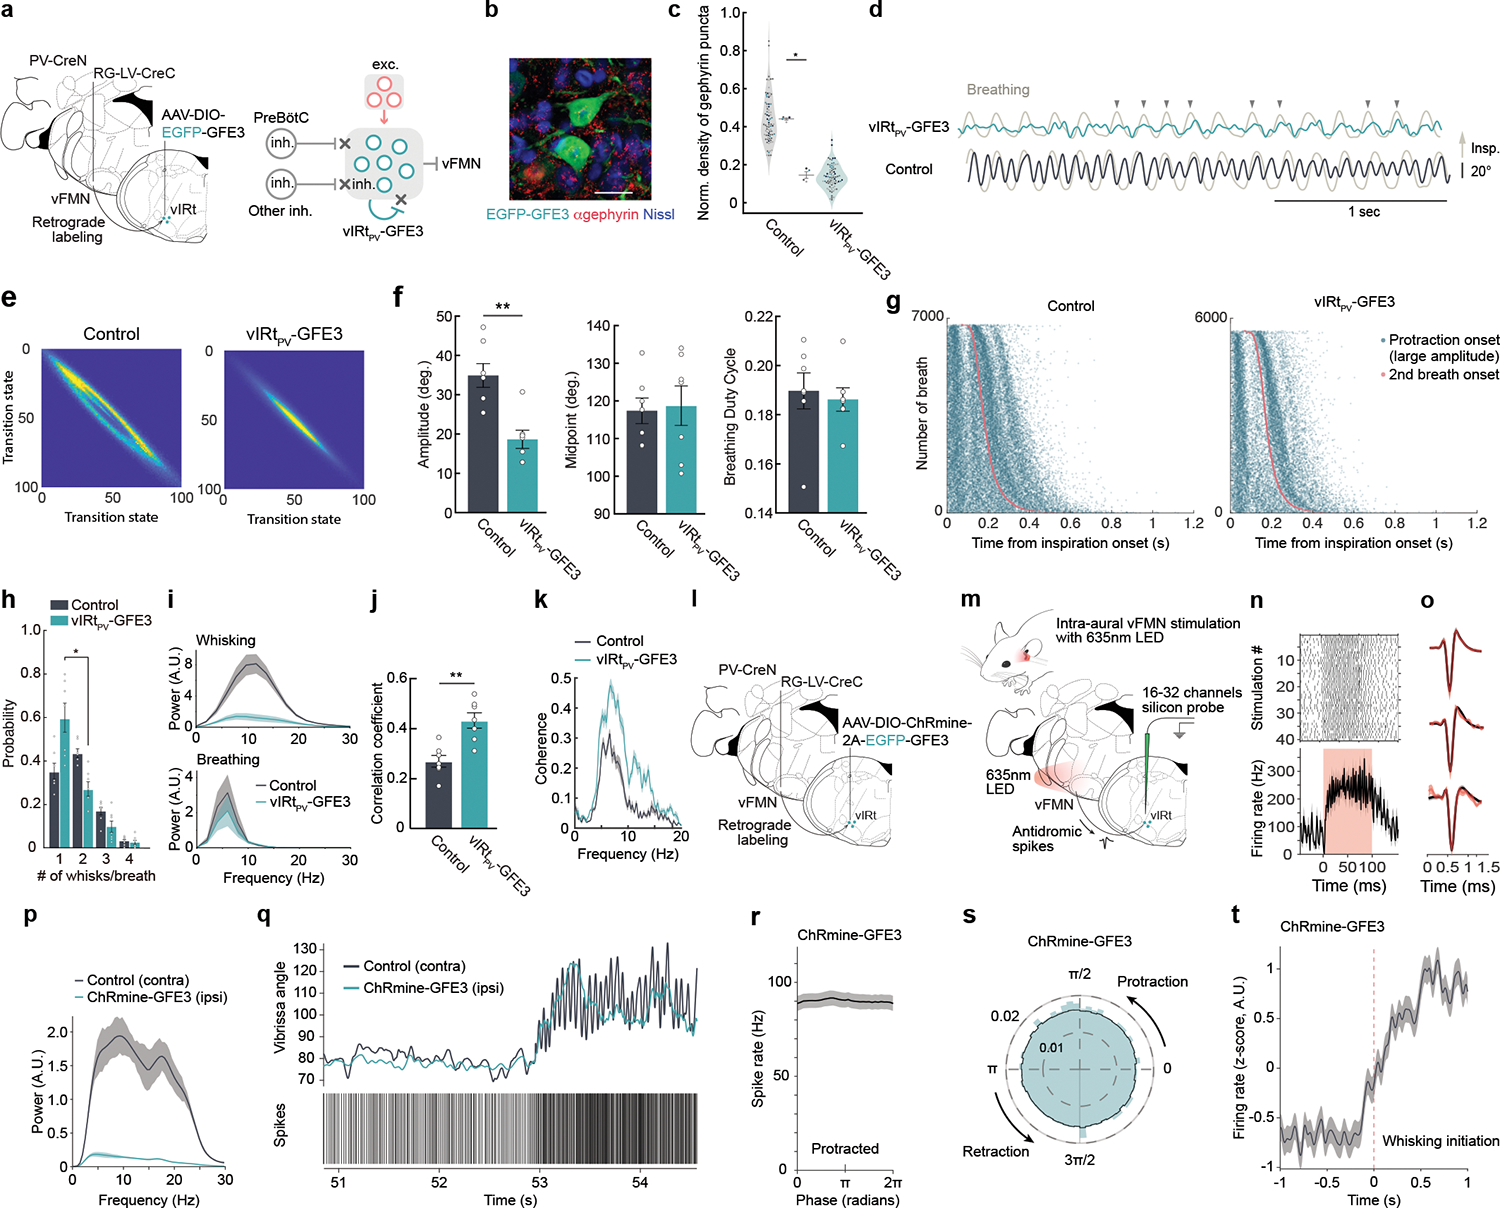
Central oscillators are primordial neural circuits that generate and control rhythmic movements1,2. Mechanistic understanding of these circuits requires genetic identification of the oscillator neurons and their synaptic connections to enable targeted electrophysiological recording and causal manipulation during behaviours. However, such targeting remains a challenge with mammalian systems. Here we delimit the oscillator circuit that drives rhythmic whisking-a motor action that is central to foraging and active sensing in rodents3,4. We found that the whisking oscillator consists of parvalbumin-expressing inhibitory neurons located in the vibrissa intermediate reticular nucleus (vIRtPV) in the brainstem. vIRtPV neurons receive descending excitatory inputs and form recurrent inhibitory connections among themselves. Silencing vIRtPV neurons eliminated rhythmic whisking and resulted in sustained vibrissae protraction. In vivo recording of opto-tagged vIRtPV neurons in awake mice showed that these cells spike tonically when animals are at rest, and transition to rhythmic bursting at the onset of whisking, suggesting that rhythm generation is probably the result of network dynamics, as opposed to intrinsic cellular properties. Notably, ablating inhibitory synaptic inputs to vIRtPV neurons quenched their rhythmic bursting, impaired the tonic-to-bursting transition and abolished regular whisking. Thus, the whisking oscillator is an all-inhibitory network and recurrent synaptic inhibition has a key role in its rhythmogenesis.


Conflict of interest statement

Competing interests

The authors declare no competing interests.

Figures

Extended Data Fig. 1.
Extended Data Fig. 1.. Anatomical and functional characterization of vIRtvGlut2 neurons.
a, Representative image of vibrissa premotor neurons (green) in vIRt traced by a three-step monosynaptic rabies virus tracing method shown in Figure 1. vGlut2 (red) mRNA were visualized by HCR RNA-FISH. b, Molecular identity of premotor vIRt neurons. 67.0 ± 1.0 % (n = 4) and 22.8 ± 1.3 % (n = 3) of premotor vIRt neurons are vGat+ and vGlut2+, respectively. 69.6 ± 3.4% (n = 4) of vGat+ premotor vIRt neurons are PV+. c, Strategy for labeling vGlut2+ premotor vIRt neurons (vIRtvGlut2). Retrograde lentivirus carrying FlpO (RG-LV-FlpO) and AAV carrying Cre- and Flp-dependent-EYFP (AAV2/8-Con/Fon-EYFP) are injected into the vFMN and vIRt of the vGlut2-Cre animal, respectively. c, Projection pattern of vIRtvGlut2 neurons in the vFMN. d’,d”,d”’, High-magnification views of the boxed areas in d. The dorsolateral (d’), lateral (d”), and ventrolateral (d”’) facial motor subnuclei that contain motoneurons innervating the nasolabialis/maxillolabialis, nasolabialis profundus, and intrinsic muscles, respectively. e, A schematic of vIRtvGlut2 silencing experiment. f, Experimental setup for vibrissa tracking. One second running triggers 1 second continuous 561 nm laser stimulation. g, Representative image of NpHR3.3-EYFP expression in vIRt. h, Example vibrissa trace during laser-OFF and -ON period. i, Quantification of whisking amplitude (Laser-OFF, 7.9 ± 1.2° vs. Laser-ON, 7.9 ± 1.3°, n = 6, p = 0.8438, Wilcoxon signed-rank test). j, Quantification of whisking midpoint (Laser-OFF, 53.5 ± 3.1° vs. Laser-ON, 55.5 ± 3.5°, n = 6, p = 0.1562, Wilcoxon signed-rank test). k, Power spectrum analysis of whisking frequency in Laser-OFF and -ON period. Shaded areas are mean ± s.e.m. Data are mean ± s.e.m. Brain sections were counterstained with Neurotrace Blue (d, g).
Extended Data Fig. 2.
Extended Data Fig. 2.. Optogenetic silencing of vIRtPV neurons also impaired whisking.
a, A schematic of vIRt PV GtACR2 silencing experiment. b, Representative image of GtACR2 expression and the optic fiber track. c, Optic fiber tip placements over vIRt from all AAV-Flex-GtACR2-GFP injected animals. d, Experimental setup for vibrissa tracking. One second running triggers 1 second continuous 473nm laser stimulation. e, Example vibrissa trace during laser-OFF and -ON period. f, Quantification of whisking amplitude (Laser-OFF, 15.6 ± 0.7° vs. Laser-ON, 10.2 ± 1.1°, n = 5, p = 0.0312, Wilcoxon signed-rank test). g, Power spectrum analysis of whisking frequency in Laser-OFF and -ON period. Data are mean ± s.e.m. * P ≤ 0.05. Brain sections were counterstained with Neurotrace Blue (b).
Extended Data Fig. 3.
Extended Data Fig. 3.. Antidromic opto-tagging of a ChRmine-expressing vIRtPV neuron via light stimulation through the ear.
a, Overlapped average waveform, before (black) and during (red) stimulation periods. b, Raster plot of spike times aligned to stimulation onset for 40 light pulses. c, Example single channel recording trace showing antidromic spikes from the opto-tagged unit during a light pulse. d, Firing rate of that unit averaged over 40 light stimulations epochs. e, Unit activity during transition from resting to whisking state. vibrissa angle traces for the ipsilateral C2 vibrissa. Bottom: Spike raster plot for this opto-tagged vIRtPV-ChRmine neuron. f, Phase tuning. Average spike rate across whisking phases for this opto-tagged vIRtPV-ChRmine neuron, in polar (top) and cartesian coordinates (bottom).
Extended Data Fig. 4.
Extended Data Fig. 4.. Slow oscillation vIRt units and additional analysis of transition from tonic to rhythmic firing of vIRt units.
a,b, Two vIRt units with “slow” rhythmic activity patterns. Top: breathing trace. Middle: Vibrissa angle and midpoint traces. Bottom: raster plot of spiking events (protraction phases shown in beige). c, Top: vibrissa trace and raster plot for a retraction unit. Bottom: Time-frequency spectrum of that spiking activity. The transition to rhythmic bursting appears as a high power frequency band, corresponding to whisking frequency. d, Same as c, for a “slow” oscillation unit. Here the transition to whisking shows a low frequency band, similar to vibrissa midpoint variations or breathing rhythm. e, Left: Time-frequency spiking spectrum for a retraction unit, averaged over all whisking bouts. Right: Inter-spike interval histograms for that retraction unit. Red, overall ISI. Blue, ISI during long whisking bouts. The ISI distribution becomes bimodal, with a strong peak at short interval corresponding to bursts. f, same as e, for a “slow” oscillation unit.
Extended Data Fig. 5.
Extended Data Fig. 5.. Elevated extracellular potassium concentrations induce bursting but not rhythmic activity in vIRtPV neurons.
a,b, Cell-attached recording of a vIRtPV unit before (a) and after (b) bath application of K 9mM. c, Representative histological verification of targeted recording. One of the tdTomato-expressing vIRtPV in slice is filled with green Alexa 488 dye from the recording pipette. d, Example of burst, post increase of extracellular potassium concentration. e,f, Inter-spike interval distribution, pre and post increase of extracellular potassium concentration, for one cell (e, pre: top, post: bottom) and all cells (f, ISI shown in log scale. Dash line: 40Hz). g, Percentage of ISIs shorter than 25ms (i.e., above 40Hz), pre and post event, for all cells (average shown in black). h, Inter-burst frequency, for each cell, pre and post. No bursting frequency band is observed for any cell.
Extended Data Fig. 6
Extended Data Fig. 6. . Pre-vIRtPV neurons in the brainstem and motor cortex, and neurotransmitter characterization of pre-vIRtPV neurons.
a, Representative image of ΔG-GFP labeled pre-vIRtPVneurons in the brainstem (continued from Fig. 3c). Scale bars, 200 μm. b, Representative image of ΔG-GFP labeled pre-vIRtPV neurons in the cortex. Scale bar, 500 μm. c, Zoomed image of the boxed area in b, d, Representative 3D reconstructed image of labeled pre-vIRtPV neurons in the cortex (magenta). Shaded areas denote the primary motor (MOp) and secondary motor cortices (MOs). e, Neurotransmitter phenotype of pre-vIRtPV neurons determined by fluorescent in situ hybridization or HCR RNA-FISH.
Extended Data Fig. 7.
Extended Data Fig. 7.. Comparison of the distributions of vIRtPV presynaptic neurons and vibrissal premotor neurons.
a, Three-dimensionally reconstructed vIRtPV presynaptic neurons (vIRt-pre, cyan, n= 3) and vibrissal premotor neurons (vibrissa-pre, magenta, n = 4) in the Allen Mouse Brain CCF in coronal planes. b, Density analysis of presynaptic neurons (vIRt-pre, cyan, n = 3) and vibrissal premotor neurons (vibrissa-pre, magenta, n = 4) in coronal and sagittal planes. DN, dentate nucleus; IP, interposed nucleus.
Extended Data Fig. 8.
Extended Data Fig. 8.. Additional results from vIRtPV-ChRmine-GFE3 mice.
a, Average whisking activity of a vIRtPV-ChRmine-GFE3 mouse, showing the mean of the pixel intensity difference between each consecutive video frame. Blue to red color scale: low to high activity. In contrast to the ipsilateral (GFE3) side, contralateral whisking is highly active across the whole whisking range. b, Increased firing, but no rhythmic activity at whisking initiation for a opto-tagged vIRtPV-ChRmine-GFE3 unit (whisking initiation time determined from contralateral C2 vibrissa). c, Whisking phase tuning of all opto-tagged vIRtPV-ChRmine-GFE3 single units (conventions as in Fig. 2 and 4).
Extended Data Fig. 9.
Extended Data Fig. 9.. Schematic model of the vIRtPV circuit that generates rhythmic whisking in normal and experimental conditions.
a, In Resting state, vIRtPV neurons show unsynchronized tonic activity. b, In Normal whisking condition, tonic excitatory inputs to vFMN protractor motoneurons protract vibrissae. Concurrently, tonic excitatory inputs to vIRtPV neurons induce recurrent inhibition within vIRtPV and which in turn switches vIRtPV from tonic firing to synchronized rhythmic bursting mode. The rhythmic signal from vIRtPV periodically silences vFMN protractor motoneurons and leads to rhythmic whisking. The rhythmic inhibitory signal from the inspiratory rhythm generator preBötC resets the activity of vIRtPV. The expiratory oscillator activates vFMN retractor motoneurons. c, In vIRtPV-TeLC condition, outputs from vIRtPV are abolished. Lack of inhibition from vIRtPV results in strong continuous activation of vFMN protractor motoneurons and strong protraction of vibrissae. Because of the strong tonic activity of protractor intrinsic muscles, extrinsic retractor muscles play a minor role in vibrissa movement. d, In vIRtPV-GFE3 condition, tonic excitation induces strong unsynchronized tonic inhibitory outputs from vIRtPV to vFMN protractor motoneurons, which results in a less protracted midpoint compared with vIRtPV-TeLC’s. Under this condition, the contribution of expiratory oscillator-extrinsic retractor muscles becomes pronounced. A group of inhibitory neurons in the left top corner of vIRt indicates PV/vGat+ vIRt neurons. Dotted lines denote putative connections.
Fig. 1.
Fig. 1.. Molecular and functional characterization of PV+ premotor vIRt neurons.
a, Diagram of the proposed whisking generation circuit in the brainstem. B, A three-step monosynaptic rabies virus tracing strategy to label adult vibrissa premotor circuit. C, Representative image of vibrissa premotor neurons in vIRt. PV and vGat mRNA were detected by HCR RNA-FISH. D, Viral-genetic split-Cre strategy for labeling PV+ premotor vIRt neurons. Retrograde lentivirus carrying CreC (RG-LV-CreC) is injected into the vibrissal part of the facial motor nucleus (vFMN) of the PV-CreN;Ai14 animal. Functional Cre is reconstituted only in vibrissal premotor neurons expressing PV. e, Molecular characterization of vIRtPV neurons. vIRtPV neurons expressing tdTomato (shown in green) overlap with GlyT2 (red, 87.9 ± 1.4%, n = 3). f, Strategy for expressing TeLC in vIRtPV neurons using the same split-cre strategy. g, Post hoc histological assessment of TeLC-GFP expression. h, Quantification of TeLC-GFP expressing cells in vIRt (223.8 ± 18.9, n = 4). i, Experimental setup for vibrissa tracking. j, A superimposed image of tracked vibrissae (C2, Left; TeLC-silenced, Right; Control). k, Representative vibrissa angle traces (green; TeLC-silenced, black; Control. Whisking midpoint was subtracted. Protraction is up). l, Plot of whisking amplitude of the TeLC-silenced and control sides. Dots represent individual animals. m, Quantification of whisking amplitude (Control side, 11.4 ± 1.2°; TeLC side, 2.6 ± 0.8°, n=4) n, Quantification of whisking midpoint (Control side, 140.0 ± 2.4°; TeLC side, 157.3 ± 1.0°, n=4.) o, Power spectrum analysis of whisking frequency. Shaded areas are mean ± s.e.m. Data are mean ± s.e.m. * P ≤ 0.05, KS test (m, n). Brain sections were counterstained with Neurotrace Blue (c, g) or DAPI (e). Scale bars, 200 μm.
Fig. 2.
Fig. 2.. Response characteristics of vIRtPV premotor neurons during whisking behavior
a, Viral-genetic strategy for expressing ChR2 in vIRtPV neurons. b, Opto-tagging strategy. c, Recording and behavioral setup. d, Histological verification of ChR2 expression and recording location. e, f, g, Spike waveform, raster plot, and average laser stimulation response of a opto-tagged single unit. h, i, j, Whisking phase tuning of a opto-tagged single unit. h, Average spike rate across whisking phases. i, Probability of a whisking phase to occur for a given spiking event (black) and probability of each whisking phase (grey). j, Phase tuning for that cell, in polar coordinates. Magnitude in spikes per second. k, Peak magnitude and phase of spike/phase coherence for all tuned cells. Color coding: Black/blue/red, Retraction units; Yellow, Mid-Retraction units; Green, Protraction units; Purple, Mid-Protraction units. Opto-tagged units are shown in blue or red (ChR2 or ChRmine-expressing cells, respectively). l, Normalized average firing rate of Retraction (bottom left), Mid-Retraction (bottom right), Protraction (top right) and Mid-Protraction (top left) groups, expressed as a probability value for each phase bin. Color coding as in k. m, Transition from tonic to rhythmic activity pattern. Top: vibrissa angle trace (purple), overlayed with vibrissa midpoint trace (red). Bottom: raster plot for two retraction and one protraction units. Beige bands mark each protraction phase. n, A high magnification representation of the tonic to rhythmic transition that occurs for a retraction-tuned unit going from resting state to whisking movements. o, Mean time-frequency spiking spectrum for all retraction units, aligned to transition from resting to whisking.
Fig. 3.
Fig. 3.. Characterizing presynaptic inputs to vIRtPV neurons (pre-vIRtPV cells).
a, Schematic of monosynaptic rabies virus tracing from vIRtPV neurons. b, TVA-mCherry/GFP double-positive source cells (yellow, arrowheads), and GFP single-positive pre-vIRtPV cells in vIRt. cf, Distribution of pre-vIRtPV neurons. c, Representative images of pre- vIRtPV neurons in the ipsilateral MdD, dIRt, IRt, DCN, preBötC, and contralateral SC, and MRN. d, Reconstructed pre-vIRtPV circuits in Allen CCF (3 mice). e, Cross-correlation analysis of pre-vIRtPV cell positions across animals; pre-vIRtPV neurons (3 mice), and vibrissa premotor neurons (3 mice) as a comparison. f, Quantification of pre-vIRtPV cell number in brain areas. Numbers are normalized by the total number of input neurons. Data are mean ± s.e.m. (n = 3 mice). g, Neurotransmitter characterization of pre- vIRtPV neurons. vGat and vGlut2 mRNA were detected by HCR RNA-FISH. See Extended Data Fig. 6 for quantification. h, Molecular characterization of pre-vIRtPV neurons within vIRt. PV, vGat, vGlut2 mRNA, and TVA-mCherry protein were detected by HCR RNA-FISH and HCR-Immunohistochemistry, respectively. Pre- vIRtPV neurons (arrows) are distinguished from source vIRtPV neurons (arrowheads) by their lack of gray-color labeled axons/dendrites. i, Top, Strategy to identify vIRtPV projections. Bottom, mGFP and Syp-mRuby label somata/axons, and axon terminals, respectively. j, Projections of vIRtPV neurons. Top, axonal projections in vFMN. Bottom, synaptic connections within vIRtPV neurons. Insets, magnified images of the boxed area and the representative vIRtPV neurons receiving mRuby-positive synaptic terminals (arrowheads). Note that strong mGFP-2A-Syp-mRuby expression causes mRuby aggregates in somata. k, Schematic summarizing the presynaptic inputs to vIRtPV. The upper left corner of vIRt indicate PV-/vGat+ (deep blue) and vGlut2+ (red) vIRt neurons. SC, MRN, and DCN provide excitatory inputs to vIRtPV neurons and presumably send simultaneous excitatory protraction signals to vFMN (translucent red). Scale bars, 200 μm (b, c, g, j), 100 μm (h). Sections were counterstained with Neurotrace blue (b, c, j) or DAPI (g, h).
Fig. 4.
Fig. 4.. Elimination of inhibitory synaptic inputs onto vIRtPV neurons impairs the generation of intervening whisking and abolishes their rhythmic bursting.
a, Schematic of the GFE3 (green) post-inhibitory synapse ablation experiment. b, Representative image of anti-Gephyrin staining in vIRtPV -GFE3 neurons. Scale bar, 20 μm. c, Quantification of normalized density of Gephyrin puncta (Control/neighboring cells, 0.44 ± 0.006, n = 4 mice, 76 cells; vIRtPV-GFE3, 0.15 ± 0.018, n= 4 mice, 78 cells). Data from individual neurons (dots), color-coded by mice. d, Vibrissa angle and breathing (light-gray) traces from vIRtPV-GFE3 (green) and control (black) mice. Protraction and inspiration are up. Downward arrows, correlated breathing/whisking events. e, Quantification of whisking regularity using state transition analysis. f, Quantification of whisking amplitude (Control, 34.9 ± 3.0°, n=7; vIRtPV-GFE3, 18.7 ± 2.3°, n=7), midpoint (Control, 117.4 ± 3.4°, n =7; vIRtPV-GFE3, 104.1 ± 17. 8°, n =7), and breathing duty cycle (Control, 0.19 ± 0.007, n=7; vIRtPV-GFE3, 0.19 ± 0.004, n=7). g, Raster plots of protraction onset (teal) relative to inspiration onset times (red). Data ordered by breath duration. h, Quantification of the number of whisks per one breathing cycle. i, Power spectrum of whisking and breathing frequency. j, Correlation coefficient of breathing and whisking (Control, 0.27 ± 0.02, n=7; vIRtPV-GFE3, 0.43 ± 0.03, n=7). k, Coherence between whisking and breathing. l,m, Schematics of ChRmine-GFE3 opto-tagging experiments. n, Raster plot and average stimulation response of a opto-tagged vIRtPV-ChRmine-GFE3 single unit. o, Average spike waveforms, before (black) and during (red) light stimulation periods for vIRtPV-ChRmine-GFE3 single units (n=3). p, Power spectrum of ipsilateral (teal) and contralateral (black) whisking frequency for ChRmine-GFE3 mice. q, Unit activity during transition from resting to whisking state. Top: vibrissa angle traces for ipsilateral (teal) and contralateral (black) C2 vibrissae. Bottom: Spike times of a opto-tagged vIRtPV-ChRmine-GFE3 neuron. r, Average spike rate across whisking phases (derived from contralateral vibrissae) for all opto-tagged vIRtPV-ChRmine-GFE3 neurons. s, Same as r, normalized, in polar coordinates. t, z-scored average spike rate of vIRtPV-ChRmine-GFE3 neurons around the time of whisking initiation. Shaded areas are mean ± s.e.m. (i, k, n, o, p, r, t). * P ≤ 0.05. ** P ≤ 0.01, KS test (c, f, i, j), Wilcoxon signed-rank test (g).

References

    1. Marder E & Bucher D Central pattern generators and the control of rhythmic movements. Curr Biol 11, R986–996, doi:10.1016/s0960-9822(01)00581-4 (2001). - DOI - PubMed
    1. Marder E & Calabrese RL Principles of rhythmic motor pattern generation. Physiol Rev 76, 687–717, doi:10.1152/physrev.1996.76.3.687 (1996). - DOI - PubMed
    1. Vincent SB The Functions of the Vibrissae in the Behavior of the White Rat. (University of Chicago, 1912).
    1. Welker W Analysis of sniffing of the albino rat 1. Behaviour 22, 223–244 (1964).
    1. Moore JD et al. Hierarchy of orofacial rhythms revealed through whisking and breathing. Nature 497, 205–210, doi:10.1038/nature12076 (2013). - DOI - PMC - PubMed