

Refining index to measure physical activity inequality: which group of the population is the most vulnerable?
- PMID: 36045368
- PMCID: PMC9428882
- DOI: 10.1186/s12939-022-01725-1
Refining index to measure physical activity inequality: which group of the population is the most vulnerable?
Abstract
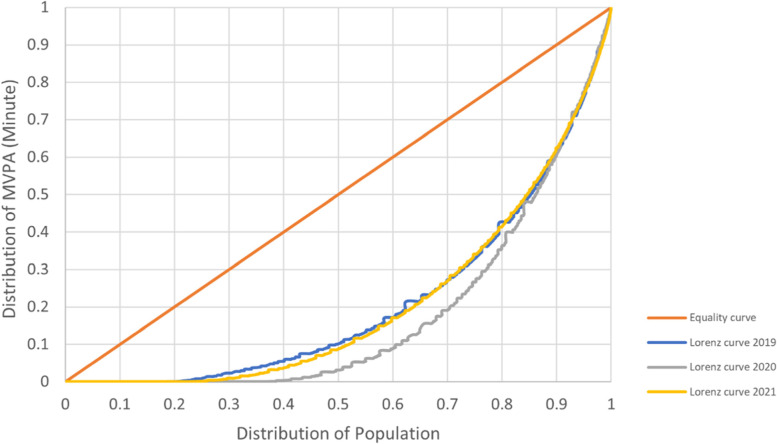
Background: The existing body of research mostly discusses inequality in physical activity (PA) based on the difference in the level of moderate-to-vigorous physical activity (MVPA). Evidence is lacking on the quantified inequality measures (e.g., how big the inequality is, and the distribution) in order to identify the most vulnerable groups of a population. This study measured PA inequality among Thai adults by using three parameters to construct an inequality index: (1) Proportion of the population with sufficient MVPA; (2) Cumulative minutes of MVPA; and (3) The Gini coefficient.
Methods: This study employed three rounds of data from Thailand's Surveillance on Physical Activity (SPA) 2019-2021. In each round, over 6,000 individuals age 18-64 years were selected as nationally-representative samples, and were included in the analysis. PA inequality was constructed by using three parameters, with a combination of the three as the final measure, to identify the sub-groups of the Thai adults who are most vulnerable: groups with the least MVPA, highest insufficiency, and highest inequality index (Gini).
Results: Covid-19 containment measures have widened the gap in PA inequality, as shown by a declining proportion of the population meeting the recommended guidelines, from 74.3% in 2019 to 56.7% in 2020 and 65.5% in 2021. PA inequality existed in all sub-populations. However, by combining three parameters, the most vulnerable groups during the Covid-19 epidemic were identified as follows: (1) Those with no income; (2) The unemployed; (3) Those who have no access to PA facilities; (4) Older adults aged 60 + years; and (5) Those earning < 3,500 baht per month. Further, residents of Bangkok, young adults aged 18-24, individuals who attained primary level education or less, those who had no exposure to a PA awareness campaign and those who have a debilitating chronic disease also had elevated risk of PA insufficiency.
Conclusion: A concerning level of PA inequality existed in all sub-populations. The use of combined indicators in measuring PA inequality should aid in determining the most vulnerable groups of the population with a refined procedure. This method can be applied in many settings since the baseline data used to measure inequality (i.e., percent sufficient and cumulative minutes of MVPA) are widely available.
Keywords: Covid-19 epidemic; MVPA; PA inequality; Vulnerable population.
© 2022. The Author(s).
Conflict of interest statement
The authors declare that they have no competing interests.
Figures
References
-
- Guthold R, Stevens GA, Riley LM, Bull FC. Worldwide trends in insufficient physical activity from 2001 to 2016: a pooled analysis of 358 population-based surveys with 1· 9 million participants. Lancet Glob Health. 2018;6(10):e1077–e1086. - PubMed
-
- Gordon-Larsen P, Nelson MC, Page P, Popkin BM. Inequality in the built environment underlies key health disparities in physical activity and obesity. Pediatrics. 2006;117(2):417–424. - PubMed
-
- Pabayo R, Fuller D, Lee EY, Horino M, Kawachi I. State-level income inequality and meeting physical activity guidelines; differential associations among US men and women. J Public Health (Oxf) 2018;40(2):229–236. - PubMed
Publication types
MeSH terms
LinkOut - more resources
Full Text Sources
Medical
Miscellaneous
