Analyses on the influence of normal nasal morphological variations on odorant transport to the olfactory cleft
- PMID: 36045580
- PMCID: PMC9799026
- DOI: 10.1080/08958378.2022.2115175
Analyses on the influence of normal nasal morphological variations on odorant transport to the olfactory cleft
Abstract
Objective: Olfaction requires a combination of sensorineural components and conductive components, but conductive mechanisms have not typically received much attention. This study investigates the role of normal nasal vestibule morphological variations in ten healthy subjects on odorant flux in the olfactory cleft.
Materials and methods: Computed tomography images were used to create subject-specific nasal models. Each subject's unilateral nasal cavity was classified according to its nasal vestibule shape as Standard or Notched. Inspiratory airflow simulations were performed at 15 L/min, simulating resting inspiration using computational fluid dynamics modeling. Odorant transport simulations for three odorants (limonene, 2,4-dinitrotoluene, and acetaldehyde) were then performed at concentrations of 200 ppm for limonene and acetaldehyde, and 0.2 ppm for dinitrotoluene. Olfactory cleft odorant flux was computed for each simulation.
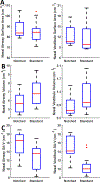
Results and discussion and conclusion: Simulated results showed airflow in the olfactory cleft was greater in the Standard phenotype compared to the Notched phenotype. For Standard, median airflow was greatest in the anterior region (0.5006 L/min) and lowest in the posterior region (0.1009 L/min). Median airflow in Notched was greatest in the medial region (0.3267 L/min) and lowest in the posterior region (0.0756 L/min). Median olfactory odorant flux for acetaldehyde and limonene was greater in Standard (Acetaldehyde: Standard = 140.45 pg/cm2-s; Notched = 122.20 pg/cm2-s. Limonene: Standard = 0.67 pg/cm2-s; Notched = 0.65 pg/cm2-s). Median dinitrotoluene flux was greater in Notched (Standard = 2.86 × 10⁻⁴pg/cm2-s; Notched = 4.29 × 10⁻⁴ pg/cm2-s). The impact of nasal vestibule morphological variations on odorant flux at the olfactory cleft may have implications on individual differences in olfaction, which should be investigated further.
Keywords: Acetaldehyde; computational fluid dynamics; dinitrotoluene; limonene; olfaction.
Conflict of interest statement
Disclosure Statement
The authors report there are no competing interests to declare.
Figures


References
-
- Guss J DL, Reger C, Chiu AG. Olfactory Dysfunction in Allergic Rhinitis. ORL. 2009(71):268–72. - PubMed
-
- Zhao K, Scherer PW, Hajiloo SA, Dalton P. Effect of anatomy on human nasal air flow and odorant transport patterns: implications for olfaction. Chemical senses. 2004;29(5):365–79. - PubMed
-
- Hahn I, Scherer PW, Mozell MM. Velocity profiles measured for airflow through a large-scale model of the human nasal cavity. Journal of applied physiology. 1993;75(5):2273–87. - PubMed
-
- Keyhani K, Scherer PW, Mozell MM. Numerical simulation of airflow in the human nasal cavity. J Biomech Eng. 1995;117(4):429–41. Epub 1995/11/01. - PubMed
Publication types
MeSH terms
Substances
Grants and funding
LinkOut - more resources
Full Text Sources
