. 2023 Jan 4;31(1):48-65.
doi: 10.1016/j.ymthe.2022.08.017. Epub 2022 Aug 31.

FOXP3 expression diversifies the metabolic capacity and enhances the efficacy of CD8 T cells in adoptive immunotherapy of melanoma

Affiliations

FOXP3 expression diversifies the metabolic capacity and enhances the efficacy of CD8 T cells in adoptive immunotherapy of melanoma

Enrique Conde et al. Mol Ther. .

Abstract

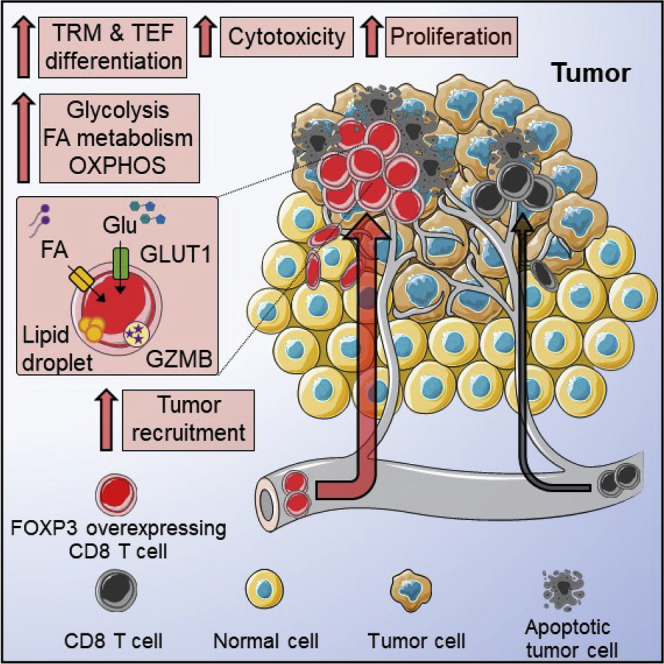
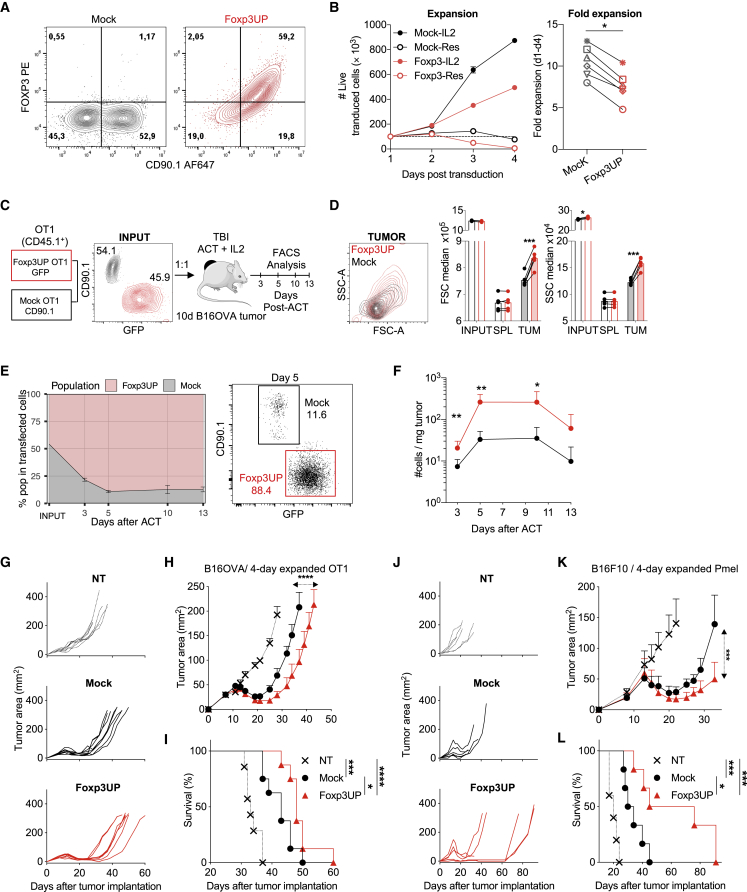
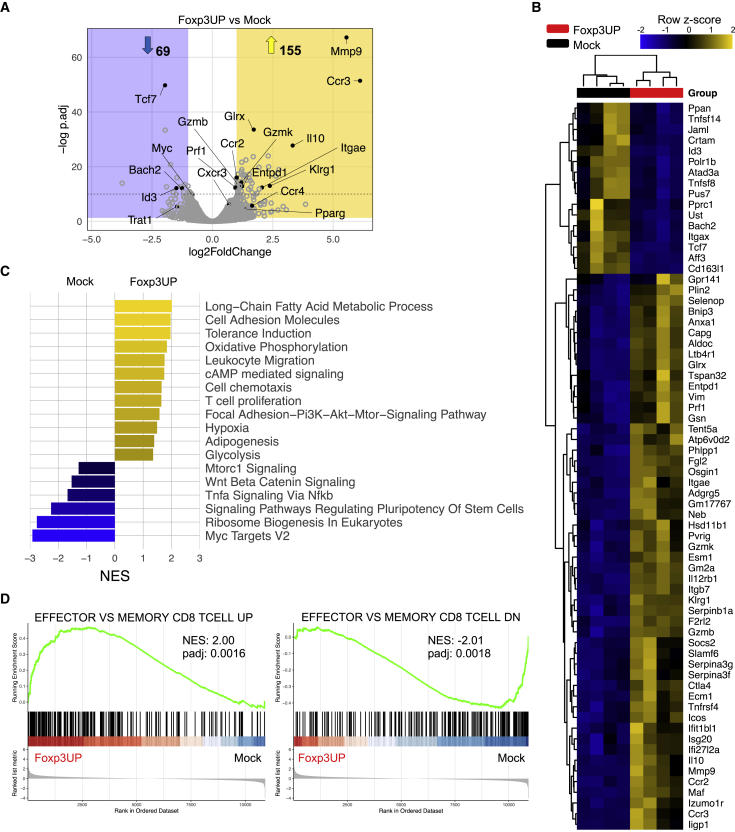
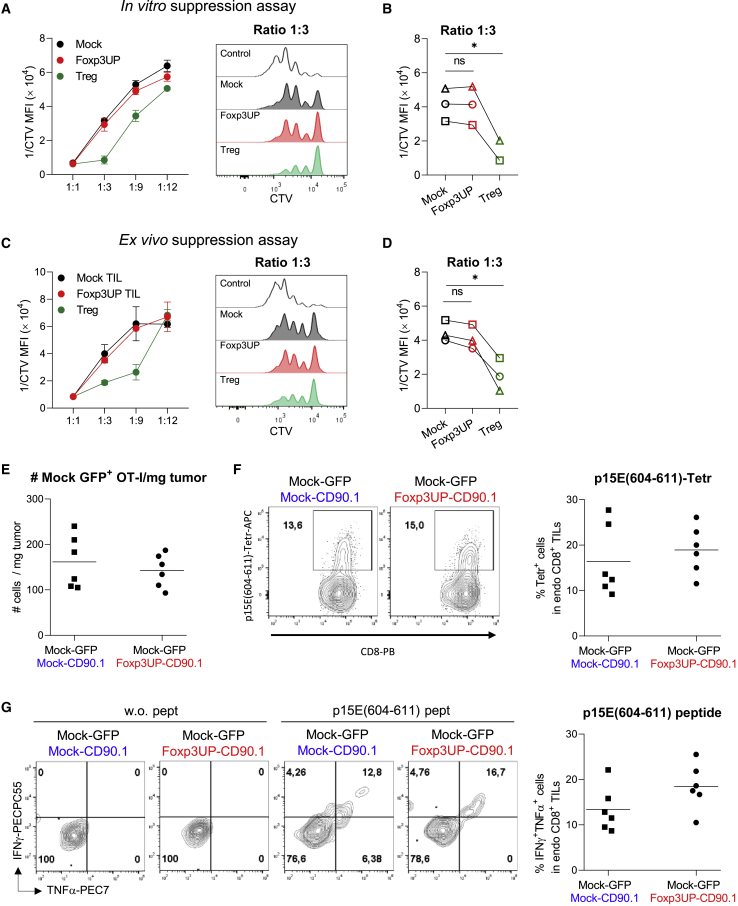
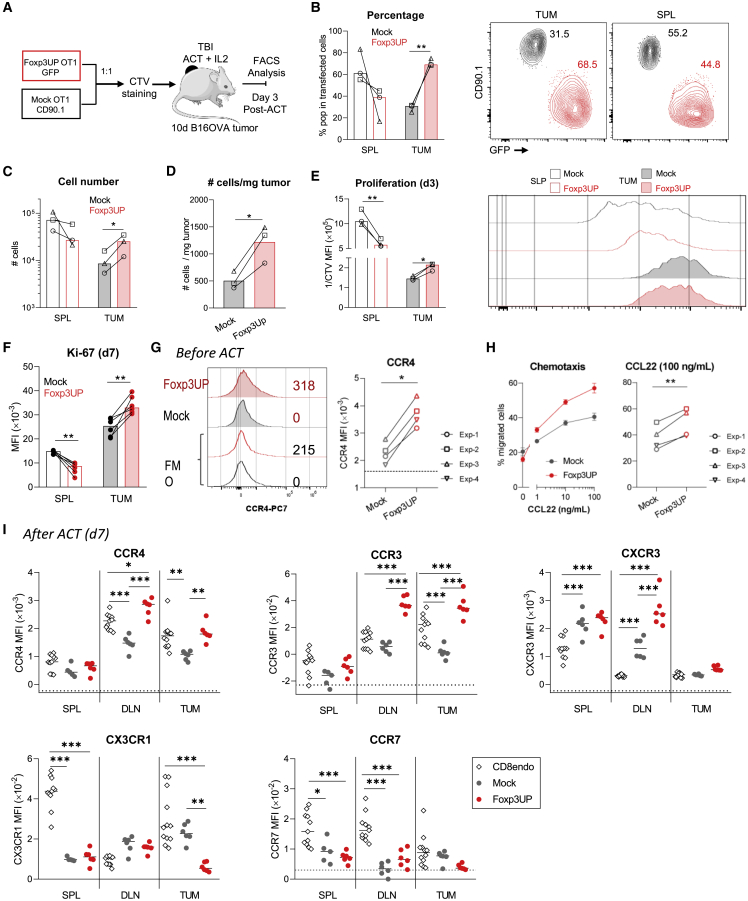
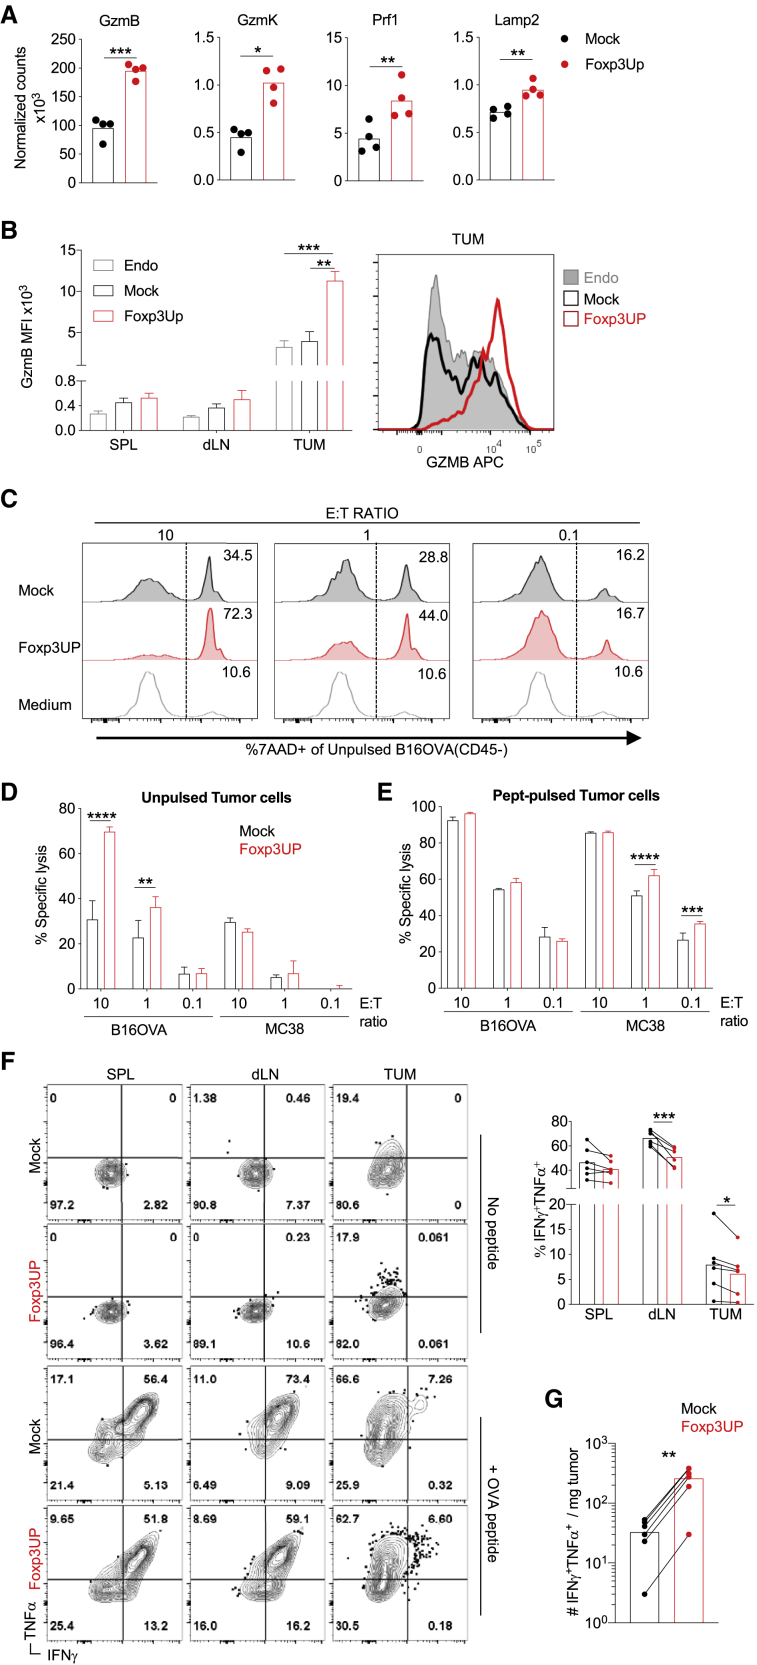
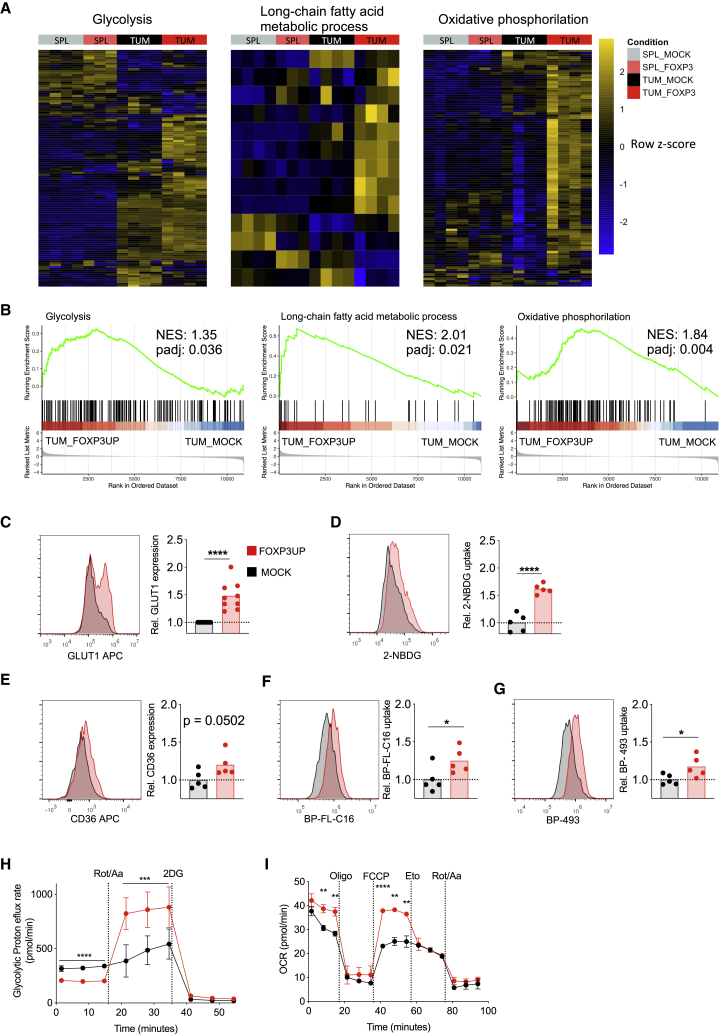
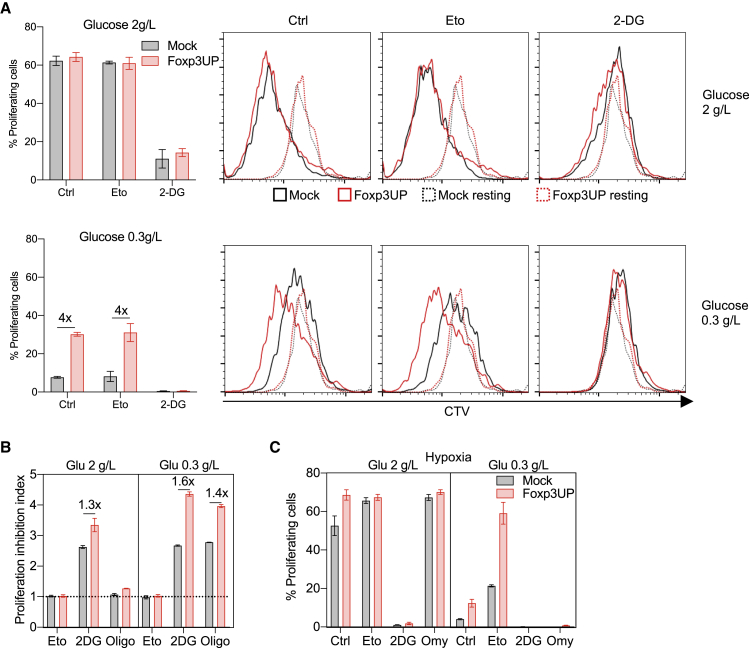
Regulatory T cells overwhelm conventional T cells in the tumor microenvironment (TME) thanks to a FOXP3-driven metabolic program that allows them to engage different metabolic pathways. Using a melanoma model of adoptive T cell therapy (ACT), we show that FOXP3 overexpression in mature CD8 T cells improved their antitumor efficacy, favoring their tumor recruitment, proliferation, and cytotoxicity. FOXP3-overexpressing (Foxp3UP) CD8 T cells exhibited features of tissue-resident memory-like and effector T cells, but not suppressor activity. Transcriptomic analysis of tumor-infiltrating Foxp3UP CD8 T cells showed positive enrichment in a wide variety of metabolic pathways, such as glycolysis, fatty acid (FA) metabolism, and oxidative phosphorylation (OXPHOS). Intratumoral Foxp3UP CD8 T cells exhibited an enhanced capacity for glucose and FA uptake as well as accumulation of intracellular lipids. Interestingly, Foxp3UP CD8 T cells compensated for the loss of mitochondrial respiration-driven ATP production by activating aerobic glycolysis. Moreover, in limiting nutrient conditions these cells engaged FA oxidation to drive OXPHOS for their energy demands. Importantly, their ability to couple glycolysis and OXPHOS allowed them to sustain proliferation under glucose restriction. Our findings demonstrate a hitherto unknown role for FOXP3 in the adaptation of CD8 T cells to TME that may enhance their efficacy in ACT.

Keywords: CD8 T cell response; FOXP3; T cell metabolism; T cell-based cancer immunotherapy.


Conflict of interest statement

Declaration of interests The authors declare no competing interests.

Figures

None
Graphical abstract
Figure 1
Figure 1
FOXP3 overexpression in CD8 T cells improved their antitumor efficacy in ACT CD8+ splenocytes were activated, and 48 h later they were infected with an empty RV or an RV encoding FOXP3 to generate mock and Foxp3UP CD8 T cells, respectively. (A) Detection of FOXP3 in transduced (CD90.1+) CD8 T cells 2 days after retroviral infection (assessed by intracellular staining and FACS). (B) After infection, cells were cultured with or without (Res) IL-2 for 4 days. Left: the absolute number (#) of live transduced cells (7AADCD90.1+) was determined using a volumetric cytometer (Cytoflex). Right: fold expansion (between days 1 and 4 after transduction) of CD8 T cells cultured with IL-2. Compiled data from six different experiments. (C) Four-day in vitro-expanded Foxp3UP (GFP+) and mock (CD90.1+) OT-I (CD45.1+) cells were mixed 1:1 and injected (i.v.) into TBI BL6 (CD45.2+) mice bearing 10-day-established B16OVA tumors (n = 6). Foxp3UP (GFP+CD45.1+) and mock (CD90.1+CD45.1+) cells inside tumors were analyzed by FACS at different times after transfer. The contour plot shows the mixed cell input. (D) Overlay dot plot showing forward scatter (FSC) and side scatter (SSC) parameters of transduced cells within the tumor at day 5 of ACT. Bar graphs show FSC and SSC median values of Foxp3UP and mock CD8 T cells before transfer (INPUT) and at day 5 of ACT in the spleen (SPL) and tumor (TUM). (E) Graph showing the percentage of Foxp3UP and mock cells in total transduced (GPF+ plus CD90.1+) CD45.1+ TILs on days 0 (INPUT), 3, 5, 10, and 13. A representative dot plot of day 5 is also shown. (F) Number of Foxp3UP and mock cells normalized to mg of tumor. (H–L) Effect of FOXP3 overexpression on the antitumor properties of CD8 T cells. (G–I) Eight-day B16OVA tumor-bearing mice were treated with 4-day in vitro-expanded Foxp3UP or mock OT-I cells (2 × 106) (8 mice/group). (J–L) Ten-day B16F10 tumor-bearing mice were treated with 4-day in vitro-expanded Foxp3UP or mock Pmel cells (4 × 106) (6 mice/group). Tumor size (mm2) from individual mice (G and J), average tumor size (H and K), and overall survival (I and L). Data are presented as mean (D), mean ± SD (B, left), and mean ± SEM (E, F, H, and K). Symbols represent individual mice (D) or experiments (B, right). Statistical significance was determined using paired t test (B [right], D, and F), non-linear regression (curve fit) (H and K), and Mantel-Cox test (I and L). ∗∗∗p < 0.0005, ∗∗p < 0.005, ∗p < 0.05. One experiment was representative of two (B [left] and E–L) or eight (A and D) experiments.
Figure 2
Figure 2
Transcriptomic signature of Foxp3UP TILs (A–D) TBI 10-day B16OVA-bearing BL6 (CD45.2+) mice (n = 5) received an i.v. injection of a mix containing 4-day in vitro-expanded mock (CD90.1+) and Foxp3UP (GFP+) (1:1 ratio) OT-I (CD45.1+) cells. Five days later, Foxp3UP (GFP+CD45.1+) and mock (CD90.1+CD45.1+) CD8 T cells infiltrating the tumor were separately isolated by FACS and used for RNA-seq. Differentially expressed gene (DEG) analysis using Foxp3UP and mock CD8 T cells from four independent experiments was performed. (A) Volcano plot depicting DEGs of interest (cutoff log2 fold change > 1, padj < 0.05). (B) Heatmap representation of hierarchical clustering of highly significant DEGs (padj < 10−10). (C) GSEA by clusterProfiler illustrates gene sets positively (normalized enrichment score [NES] > 0) or negatively (NES < 0) enriched in Foxp3UP versus mock TILs. All depicted pathways reached the false discovery rate <0.05 cutoff. (D) GSEA enrichment score curve of “Effector versus memory CD8 T cell” upregulated (UP) and downregulated (DN) gene sets in Fox3UP versus mock TILs presented as the NES.
Figure 3
Figure 3
The expression of FOXP3 in CD8 T cells did not lead to suppressive activity (A and B) In vitro T cell proliferation suppression assay. CD8+ splenocytes were isolated from BL6 (CD45.2+) mice and labeled with CTV. Cells were activated with anti-CD3/CD28 mAb-coated beads and cultured either alone or in the presence of 7-day in vitro-expanded Foxp3UP or mock (CD45.1+) OT-I cells at different “suppressor” (CD45.1+):effector (CD45.2+) cell ratios (5 replicates/condition). After 72 h, proliferation of CD45.2+CD8+ cells was determined by FACS analysis. (C and D) Ex vivo T cell proliferation suppression assay. Eight-day B16OVA tumor-bearing BL6 (CD45.2+) mice received an i.v. injection of a mix containing 4-day in vitro-expanded mock (CD90.1+) and Foxp3UP (GFP+) OT-I (CD45.1+) (1:1 ratio) cells. Seven days later, Foxp3UP (GFP+CD45.1+) and mock (CD90.1+CD45.1+) CD8 T cells infiltrating the tumor were separately isolated by FACS and tested ex vivo in a suppression assay as described in (A) and (B) (3 replicates/condition). (A–D) Data in the graphs are plotted as the reverse of CTV MFI (1/CTV MFI). High 1/CTV MFI values signify higher proliferation of CD8 CD45.2+ cells and therefore less suppressive activity of CD45.1+ cells. (A and C, left) Graphs showing 1/CTV MFI values at different cell ratios. (A and C, right) Histograms of CTV MFI values at ratio 1:3. In (B) and (D), data were compiled from three independent experiments. In (A–D), CD4 Tregs (CD45.1+CD4+CD25+) were used as positive control (3 replicates/condition). (E–G) A mixture (1:1) of mock GFP+ OT-I cells together with mock CD90.1+ OT-I cells or Foxp3UP CD90.1+ OT-I cells (total 4 × 106 cells) was injected into B16OVA tumor-bearing BL6 mice and mock GFP+ OT-I, and endogenous CD8 TILs were analyzed at day 7 of transfer. (E) Number of mock GFP+ OT-I TILs per mg of tumor. (F) Percentage of p15E(604–611)-specific endogenous CD8 TILs, as determined by tetramer staining. Representative dot plots are shown on the left. Cells were gated on CD45.2+CD8+ (endo CD8) T cells. (G) At day 7 of ACT, total cells from tumors were restimulated ex vivo with or without p15E(604–611) peptide, and production of IFNγ and TNFα was assessed 5 h later by FACS. Left: representative dot plots. Cells were gated on CD45.2+CD8+ (endo CD8) T cells. Right: percentage of IFNγ+TNFα+ cells within endogenous CD8 TILs after peptide stimulation. Data are presented as mean (E, F, and G graphs) and mean ± SD (A and C). Symbols represent individual mice (E, F, and G graphs) or independent experiments (B and D). Statistical significance was determined using two-way ANOVA for multiple comparisons (B and D) or unpaired t test (E, F, and G graphs). ∗p < 0.05. One experiment was representative of two (E–G) or three (A and C) experiments.
Figure 4
Figure 4
Effect of FOXP3 overexpression on the proliferation and chemotactic properties of CD8 T cells (A–E) Four-day in vitro-expanded Foxp3UP (GFP+) and mock (CD90.1+) OT1 (CD45.1+) cells were mixed (1:1 ratio), labeled with CTV dye, and injected (i.v.) into 10-day B16OVA-bearing BL6 (CD45.2+) mice (n = 3). Foxp3UP (GFP+CD45.1+) and mock (CD90.1+CD45.1+) CD8 T cells were analyzed in tumor and the spleen at day 3. (A) Schematic diagram of the experimental approach. (B) Graphs and representative dot plots showing the percentage of Foxp3UP and mock CD8 T cells in total transduced (GPF+ plus CD90.1+) CD45.1+ cells in tumor (TUM) and the spleen (SPL). (C) Total number of Foxp3UP and mock CD8 T cells in tumor and the spleen. (D) Number of Foxp3UP and mock CD8 T cells normalized to mg of tumor. (E) Graphs showing proliferation (depicted as reverse of CTV MFI [1/CTV MFI]) of Foxp3UP and mock CD8 T cells in tumor and the spleen, with representative histogram on the right. (F) Foxp3UP and mock OT1 cells were injected (i.v.) into 10-day B16OVA-bearing BL6 mice. The expression of Ki-67 was assessed (FACS) in Foxp3UP and mock CD8 T cells from spleen and tumors at day 7. (G) Expression of CCR4 in 4-day in vitro-expanded Foxp3UP and mock OT-I cells. Left: representative histogram. As negative control, fluorescence minus one (FMO) is shown. Right: compiled data from four independent experiments. Dotted line indicates FMO values. (H) Transwell migration assay. Left: percentage of migrated cells in response to increasing concentrations of mouse CCL22 chemokine after 3 h of incubation. Right: Compiled data from four independent experiments. (I) Four-day in vitro-expanded Foxp3UP and mock OT1 cells were injected (i.v.) separately into 10-day B16OVA-bearing BL6 mice. The expression of different chemokine receptors was assessed (FACS) in Foxp3UP and mock CD8 T cells from spleen, dLNs, and tumors at day 7 of ACT. Graphs show MFIs of each receptor. Dotted lines indicate FMO values. As reference, endogenous (endo) CD8 T cells are shown. Data are presented as mean (bars in B–F and I) and mean ± SD (H, left). Symbols represent individual mice (B–F and I) or experiments (G and H [right]). Statistical significance was determined using paired t test (B–F, G, and H [right]) and two-way ANOVA for multiple comparisons (I). ∗∗∗p < 0.0005, ∗∗p < 0.005, ∗p < 0.05. One experiment was representative of two experiments (B–F and I).
Figure 5
Figure 5
Enforced FOXP3 expression increased cytotoxicity in CD8 T cells (A and B) Foxp3UP (GFP+) and mock (CD90.1+) OT-I (CD45.1+) cells were co-injected at a 1:1 ratio as in Figure 2. (A) Normalized counts from an RNA-seq analysis of key cytotoxic genes in Foxp3UP (GFP+CD45.1+) and mock (CD90.1+CD45.1+) CD8 T cells isolated from tumors. (B) The graph on the left shows GzmB median fluorescent intensity (MFI) in endogenous (CD45.2+) CD8 T cells (Endo) and transferred Foxp3UP (GFP+CD45.1+) and mock (CD90.1+CD45.1+) CD8 T cells in the spleen (SPL), dLNs, and tumor (TUM). Histogram on the right depicts GzmB expression in endogenous and transferred TILs. (C–E) mock or Foxp3UP Pmel cells were co-cultured with B16OVA or MC38 tumor cells that had been previously pulsed or not (unpulsed) with Pmel peptide, at different ratios of effector cells to tumor cells (E:T ratio). As a control, tumor cells were cultured alone (medium). The percentage of dead tumor cells (7AAD+CD45) in total tumor cells (CD45) was analyzed 12 h later by FACS. (C) Representative histograms showing percentage of dead B16OVA cells at different E:T ratios. (D and E) Killing activity of Pmel cells against unpulsed (D) or pulsed (E) tumor cells depicted as the percentage of specific lysis, as described in materials and methods. (F and G) Mice were treated as in (B). At day 5 of ACT, total cells from the spleen, dLNs, and tumors were restimulated ex vivo with or without OVA peptide, and production of IFNγ and TNFα was assessed 5 h later by FACS. (F) Representative dot plots of cells stimulated with or without peptide (left). The graph on the right shows the percentage of IFNγ+TNFα+ cells within Foxp3UP (GFP+CD45.1+) and mock (CD90.1+CD45.1+) CD8 T cells in spleen, dLNs, and tumor upon peptide restimulation. (G) Number of IFNγ+TNFα+ Foxp3UP and mock OT-I TILs normalized to mg of tumor. Data are presented as mean (A, F, and G), mean + SEM (B), and mean ± SD (D and E). Symbols represent individual mice (F and G) or experiments (A). Statistical significance was determined using unpaired t test (A), paired t test (B, F, and G) and two-way ANOVA for multiple comparisons (D and E). ∗∗∗∗p < 0.00005, ∗∗∗p < 0.0005, ∗∗p < 0.005, ∗p < 0.05. Compiled data from four different experiments (A) or one experiment representative of two experiments (B–G) are shown.
Figure 6
Figure 6
FOXP3-overexpressing CD8 T cells exhibited improved glycolytic and lipidic metabolism (A and B) Foxp3UP (GFP+) and mock (CD90.1+) OT-I (CD45.1+) cells were co-injected at 1:1 ratio as described in Figure 2. Transcriptomic profile of Foxp3UP (GFP+CD45.1+) and mock (CD90-1+CD45.1+) CD8 T cells isolated from tumor and the spleen at day 5 of ACT. (A) Heatmap representation of hierarchical clustering of genes differentially expressed (p < 0.05) from hallmark glycolysis, KEGG long-chain FA metabolism, and OXPHOS gene set. (B) GSEA enrichment score curve of glycolysis, long-chain FA metabolism, and OXPHOS pathway in Foxp3UP versus mock TILs presented as the normalized enrichment score (NES). (C–G) Foxp3UP (CD90.1+) and mock (CD90.1+) OT-I (CD45.1+) cells were separately injected into B16OVA tumor-bearing BL6 (CD45.2+) mice, and CD90.1+CD45.1+ TILs were analyzed at day 5 upon ACT. Representative histograms and graphs showing GLUT1 expression (C), ex vivo 2-NBDG uptake (D), CD36 expression (E), ex vivo uptake of palmitate analog Bodipy-FL-C16 (BP-FL-C16) (F), and intracellular lipid droplet staining with Bodipy-493 (BP-493) (G) of Foxp3UP and mock cells. Data are presented as relative MFI values (MFI of studied cells divided by the average MFI of mock CD8 T cells). (H) GlycoPER assay. Before the assay, Foxp3UP and mock CD8 T cells were restimulated in vitro (2 h) with soluble anti-IgG-crosslinked anti-CD3 mAb. GlycoPER was measured at baseline and following injections with rotenone/antimycin A (Rot/AA) and 2-DG. (I) OCR assay under starving conditions. Foxp3UP and mock CD8 T cells were preconditioned (overnight) in substrate-limited growth medium and maintained in poor-nutrient Seahorse medium throughout the Seahorse assay. OCR was measured at baseline and in response to Omy, FCCP, Eto, and Rot/AA. Data are presented as mean (C–G) and mean ± SD (H and I). Symbols represent individual mice (C–G). Statistical significance was determined using unpaired t test (C–I). ∗∗∗∗p < 0.00005, ∗∗∗p < 0.0005, ∗∗p < 0.005, ∗p < 0.05. Compiled data from four different experiments (A and B) or one experiment representative of two (C–G) or three (H and I) experiments are shown.
Figure 7
Figure 7
Advantage of FOXP3-overexpressing CD8 T cells in low-glucose conditions (A and B) Eight-day in vitro-expanded Foxp3UP and mock (both GFP+) CD8 T cells were labeled with CTV dye and restimulated in vitro (72 h) with plate-bound anti-CD3 mAb in IL-2- and glucose-free DMEM supplemented with normal or low glucose concentration and FCS in the presence or absence of 2-DG, Eto, or Omy. (A) Graphs showing the percentage of proliferating cells in transduced (GPF+) cells and representative histograms of the CTV dilution assay. As reference, cells left without stimulation (Ctr) are shown (dotted histogram). (B) Proliferation inhibition index calculated as CTV MFI of inhibitor-treated cells/CTV MFI of inhibitor-free cells. (C) CTV-labeled cells cultured as in (A) and (B), but in hypoxia (1% O2). Percentage of proliferating cells in transduced (GPF+) cells. Data are presented as mean ± SD. One experiment was representative of two experiments (A–C).

Similar articles

Cited by

References

    1. Gattinoni L., Klebanoff C.A., Restifo N.P. Paths to stemness: building the ultimate antitumour T cell. Nat. Rev. Cancer. 2012;12:671–684. - PMC - PubMed
    1. Fuertes Marraco S.A., Neubert N.J., Verdeil G., Speiser D.E. Inhibitory receptors beyond T cell exhaustion. Front. Immunol. 2015;6:310. doi: 10.3389/fimmu.2015.00310. - DOI - PMC - PubMed
    1. Zhu J., Powis De Tenbossche C.G., Cané S., Colau D., Van Baren N., Lurquin C., et al. Resistance to cancer immunotherapy mediated by apoptosis of tumor-infiltrating lymphocytes. Nat. Commun. 2017;8:1404. doi: 10.1038/s41467-017-00784-1. - DOI - PMC - PubMed
    1. Horton B.L., Williams J.B., Cabanov A., Spranger S., Gajewski T.F. Intratumoral CD8+ T-cell apoptosis is a major component of T-cell dysfunction and impedes antitumor immunity. Cancer Immunol. Res. 2018;6:14–24. - PMC - PubMed
    1. DePeaux K., Delgoffe G.M. Metabolic barriers to cancer immunotherapy. Nat. Rev. Immunol. 2021;21:785–797. - PMC - PubMed

Publication types

MeSH terms