. 2022 Aug 15:16:933818.
doi: 10.3389/fncom.2022.933818. eCollection 2022.

Response of a neuronal network computational model to infrared neural stimulation

Affiliations

Response of a neuronal network computational model to infrared neural stimulation

Jinzhao Wei et al. Front Comput Neurosci. .

Abstract

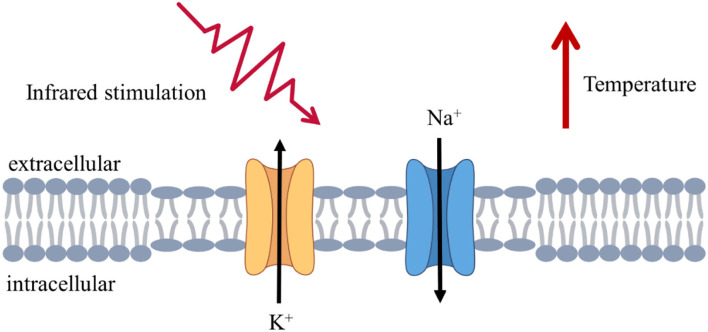
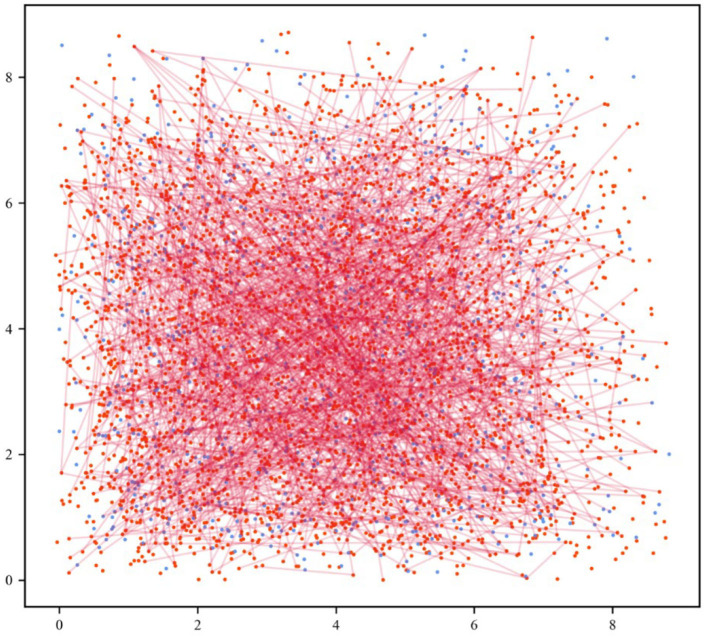
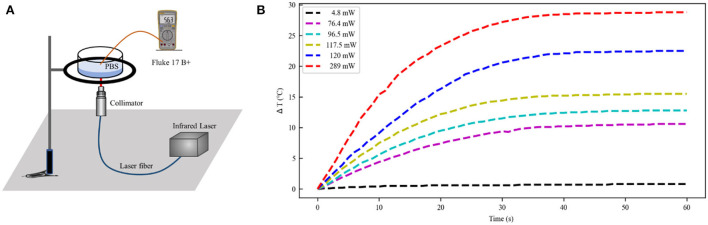
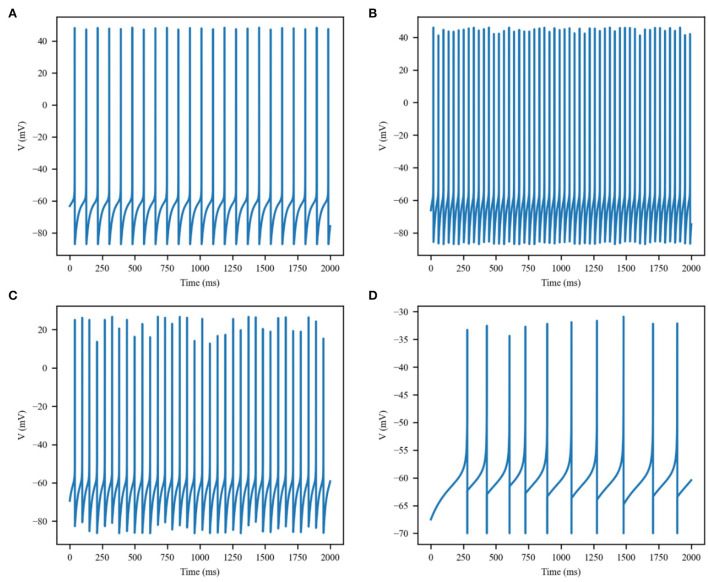
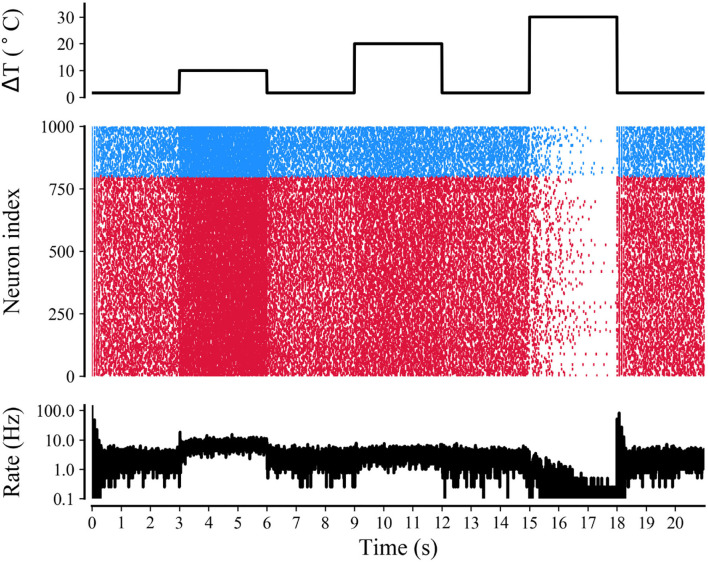
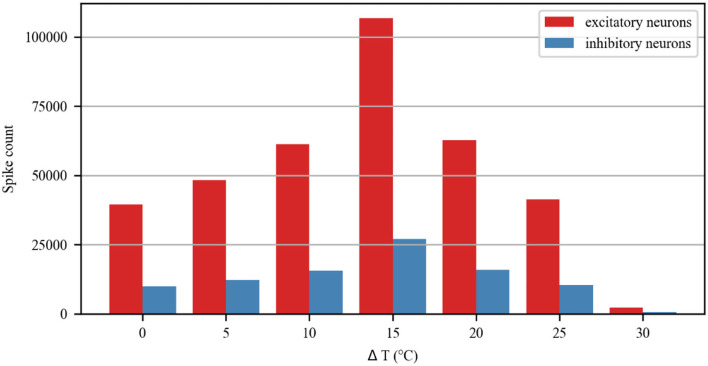
Infrared neural stimulation (INS), as a novel form of neuromodulation, allows modulating the activity of nerve cells through thermally induced capacitive currents and thermal sensitivity ion channels. However, fundamental questions remain about the exact mechanism of INS and how the photothermal effect influences the neural response. Computational neural modeling can provide a powerful methodology for understanding the law of action of INS. We developed a temperature-dependent model of ion channels and membrane capacitance based on the photothermal effect to quantify the effect of INS on the direct response of individual neurons and neuronal networks. The neurons were connected through excitatory and inhibitory synapses and constituted a complex neuronal network model. Our results showed that a slight increase in temperature promoted the neuronal spikes and enhanced network activity, whereas the ultra-temperature inhibited neuronal activity. This biophysically based simulation illustrated the optical dose-dependent biphasic cell response with capacitive current as the core change condition. The computational model provided a new sight to elucidate mechanisms and inform parameter selection of INS.

Keywords: computational model; infrared neural stimulation; ionic channel; membrane capacitance; neuronal network; photothermal effect.


Conflict of interest statement

The authors declare that the research was conducted in the absence of any commercial or financial relationships that could be construed as a potential conflict of interest.

Figures

Figure 1
Figure 1
Schematic illustration of infrared stimulation at the cellular and molecular levels. Infrared irradiation caused changes in ion channel and membrane capacitance, increases in the rate of ion channel opening and closing, and changes in the thinning and larger area of the lipid bilayer, leading to changes in the response current.
Figure 2
Figure 2
Neuronal network visualization in the Euclidean space. The 2D network diagram shows excitatory neurons in the red dots and inhibitory neurons in the blue dots. For the sake of clarity, the connection of 5% out of all excitatory synapses was selected at random (red lines).
Figure 3
Figure 3
Temperature distribution at the different laser power. (A) The experimental setup of laser irradiation detection. (B) Temperature change curve over time caused by infrared light irradiation at 1,550 nm (initial temperature 21°C). PBS, phosphate buffered solution.
Figure 4
Figure 4
Membrane potential of single excitatory neurons under the action of increase in temperature by (A) 0, (B) 10, (C) 20, and (D) 30°C.
Figure 5
Figure 5
Inter-spike interval (ISI) sequences of neuronal spiking trains exposed to different temperatures.
Figure 6
Figure 6
The Coefficient of Variance (CV) value of neurons inter-spike intervals exposed to different temperatures.
Figure 7
Figure 7
Variations in presynaptic glutamate release probability (Pr) in response to different temperatures. The dots represent each presynaptic release event.
Figure 8
Figure 8
Variations in excitatory postsynaptic currents (EPSCs) evoked by glutamate released from the presynaptic terminal during treatment with different temperatures.
Figure 9
Figure 9
Raster plot and mean firing rate of neural activity during treatment with different temperatures. Simulations of neuronal network for a rectangular-pulse increase in temperature by 10, 20, and 30°C (top panel). The raster plot (middle panel) shows the spike activity of 25% of all excitatory (red) and inhibitory neurons (blue) of the network. The mean firing rate of the network is shown in the bottom panel.
Figure 10
Figure 10
Spike count of excitatory and inhibitory neurons in the neuronal network during treatment with different temperatures.

Similar articles

References

    1. Abbott L. F., Regehr W. G. (2004). Synaptic computation. Nature 431, 796–803. 10.1038/nature03010 - DOI - PubMed
    1. Ahmed N., Radwan N. M., Ibrahim K. M., Khedr M. E., El Aziz M. A., Khadrawy Y. A. (2008). Effect of three different intensities of infrared laser energy on the levels of amino acid neurotransmitters in the cortex and hippocampus of rat brain. Photomed. Laser Surg. 26, 479–488. 10.1089/pho.2007.2190 - DOI - PubMed
    1. Amaroli A., Marcoli M., Venturini A., Passalacqua M., Agnati L. F., Signore A., et al. . (2018). Near-infrared laser photons induce glutamate release from cerebrocortical nerve terminals. J. Biophotonics 11:e201800102. 10.1002/jbio.201800102 - DOI - PubMed
    1. Barak O., Tsodyks M. (2007). Persistent activity in neural networks with dynamic synapses. PLoS Comput. Biol. 3, 323–332. 10.1371/journal.pcbi.0030104 - DOI - PMC - PubMed
    1. Barborica A., Oane I., Donos C., Daneasa A., Mihai F., Pistol C., et al. . (2022). Imaging the effective networks associated with cortical function through intracranial high-frequency stimulation. Hum. Brain Mapp. 43, 1657–1675. 10.1002/hbm.25749 - DOI - PMC - PubMed

LinkOut - more resources