. 2021 Apr 22;44(5):763-781.
doi: 10.1093/plankt/fbab023. eCollection 2022 Sep-Oct.

Plankton food webs in the oligotrophic Gulf of Mexico spawning grounds of Atlantic bluefin tuna

Affiliations

Plankton food webs in the oligotrophic Gulf of Mexico spawning grounds of Atlantic bluefin tuna

Michael R Stukel et al. J Plankton Res. .

Abstract

We used linear inverse ecosystem modeling techniques to assimilate data from extensive Lagrangian field experiments into a mass-balance constrained food web for the Gulf of Mexico open-ocean ecosystem. This region is highly oligotrophic, yet Atlantic bluefin tuna (ABT) travel long distances from feeding grounds in the North Atlantic to spawn there. Our results show extensive nutrient regeneration fueling primary productivity (mostly by cyanobacteria and other picophytoplankton) in the upper euphotic zone. The food web is dominated by the microbial loop (>70% of net primary productivity is respired by heterotrophic bacteria and protists that feed on them). By contrast, herbivorous food web pathways from phytoplankton to metazoan zooplankton process <10% of the net primary production in the mixed layer. Nevertheless, ABT larvae feed preferentially on podonid cladocerans and other suspension-feeding zooplankton, which in turn derive much of their nutrition from nano- and micro-phytoplankton (mixotrophic flagellates, and to a lesser extent, diatoms). This allows ABT larvae to maintain a comparatively low trophic level (~4.2 for preflexion and postflexion larvae), which increases trophic transfer from phytoplankton to larval fish.

Keywords: calanoid copepods; larval fish; marine food web; nitrogen cycle; plankton ecology.


Figures

Fig. 1
Fig. 1
Food web structure. All major food web flows between living organism groups are shown. However, for visual simplicity, we omit production of NH4+, DOM and detritus by all living groups as well as consumption of detritus by protistan zooplankton and suspension-feeding metazoans. Stars indicate groups at the highest TLs, for which secondary production is a model closure term. The model has a two-layer structure (~mixed layer and deep euphotic zone) with all trophic components in both layers, except for larval ABT. For all model flows, see Supplementary Table SI (see online supplementary data at Journal of Plankton Research online). HBac, heterotrophic bacteria; SDet, small detritus; LDet, large (sinking) detritus; Tricho, Trichodesmium; Cyano, cyanobacteria; Flag, mixotrophic flagellates; Dtm, diatoms; MIC, microzooplankton; HNF, heterotrophic nanoflagellates; App, appendicularians; HerbVM, vertically migrating herbivorous suspension feeders; HerbNVM, non-vertically migrating herbivorous suspension feeders; Clad, cladocerans; nvmCal, non-vertically migrating calanoid copepods; vmCal, vertically migrating calanoid copepods; Chaeto, chaetognaths; Poecil, poecilostomatoid copepods; Preflex ABT, preflexion ABT; Postflex ABT, postflexion ABT; Gel, gelatinous predators (ctenophores and cnidarians); Plank Fish, planktivorous fish.
Fig. 2
Fig. 2
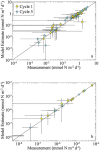
Comparison between field measurements and model estimates for planktonic ecosystem rates (a) and ABT feeding measurements (b). Yellow diamonds are C1, cyan circles are C5.
Fig. 3
Fig. 3
Violin plots of TL of zooplankton and fish in the mixed layer (a, c) and deep chl max (b, d) during C1 (a, b) and C5 (c, d). Blue plots are ABT prey. Red plots are ABT. Yellow plots are not ABT or their prey.
Fig. 4
Fig. 4
Violin plots of nitrogen flux through the herbivorous food chain (phytoplankton to metazooplankton), multivorous food chain (phytoplankton to metazooplankton via protistan grazers) and microbial loop (respiration from bacteria and protists supported by bacterial production) normalized to NPP for the shallow euphotic zone during C1 (a), deep euphotic zone during C1 (b), shallow euphotic zone during C5 (c) and deep euphotic zone during C5 (d).
Fig. 5
Fig. 5
Violin plots of modeled larval ABT diets during C1 (a, b) and C5 (c, d).
Fig. 6
Fig. 6
The ratio of the TL of different modeled zooplankton and fish to the TL they would have in the longest possible model food chain. The ‘other’ category includes all planktivorous fish and all zooplankton that are not larval ABT prey.
Fig. 7
Fig. 7
Indirect food web flows to larval tuna (a, b, e, f), protists (c, g) and mesozooplankton (d, h). Panels (a) and (e) show the amount of organic matter derived from each phytoplankton taxon that was respired by larval tuna. Other panels show the proportion of the production of each phytoplankton taxon that was respired by either larval tuna (b, f), protists (c, g) or mesozooplankton (d, h). Only ABT prey are shown in (d) and (h). Panels (a–d) are for C1; (e–h) are for C5.

Similar articles

Cited by

References

    1. Alemany, F., Quintanilla, L., Velez-Belchí, P., García, A., Cortés, D., Rodríguez, J. M., dePuelles, M. F., González-Pola, C.et al. (2010) Characterization of the spawning habitat of Atlantic bluefin tuna and related species in the Balearic Sea (western Mediterranean). Prog. Oceanogr., 86, 21–38.
    1. Alldredge, A. (1976) Field behavior and adaptive strategies of appendicularians (Chordata: Tunicata). Mar. Biol., 38, 29–39.
    1. Arreguin-Sanchez, F., Zetina-Rejón, M., Manickchand-Heileman, S., Ramırez-Rodrıguez, M. and Vidal, L. (2004) Simulated response to harvesting strategies in an exploited ecosystem in the southwestern Gulf of Mexico. Ecol. Model., 172, 421–432.
    1. Bakun, A. (2006) Fronts and eddies as key structures in the habitat of marine fish larvae: opportunity, adaptive response and competitive advantage. Sci. Mar., 70, 105–122.
    1. Bakun, A. and Broad, K. (2003) Environmental ‘loopholes’ and fish population dynamics: comparative pattern recognition with focus on El Niño effects in the Pacific. Fish. Oceanogr., 12, 458–473.