

Effect of Hypertension, Waist-to-Height Ratio, and Their Transitions on the Risk of Type 2 Diabetes Mellitus: Analysis from the China Health and Retirement Longitudinal Study
- PMID: 36046148
- PMCID: PMC9420619
- DOI: 10.1155/2022/7311950
Effect of Hypertension, Waist-to-Height Ratio, and Their Transitions on the Risk of Type 2 Diabetes Mellitus: Analysis from the China Health and Retirement Longitudinal Study
Abstract
Background: Diabetes is a major reason of death and disability worldwide and frequently coexists with hypertension and central obesity. This study is aimed at investigating the effects of hypertension, waist-to-height ratio (WHtR), and their dynamic transitions on type 2 diabetes mellitus (T2DM) onset among middle-aged and elderly people in China.
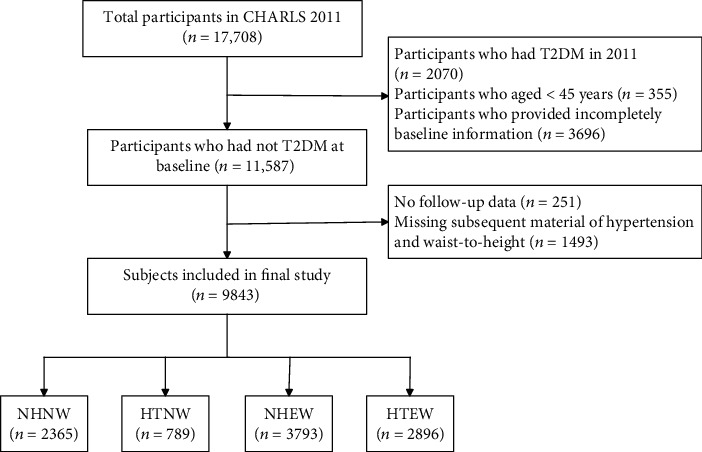
Methods: We analyzed 9843 participants free of T2DM (average age, 59.04 ± 9.26 years) at baseline from the China Health and Retirement Longitudinal Study. We classified the participants into the following four categories based on hypertension and WHtR statuses: nonhypertensive with a normal WHtR (NHNW); hypertensive with a normal WHtR (HTNW); nonhypertensive with an elevated WHtR (NHEW); and hypertensive with an elevated WHtR (HTEW). By using a Cox proportional hazards regression model, we assessed whether hypertension, WHtR, and their transitions over time correlated with T2DM risk.
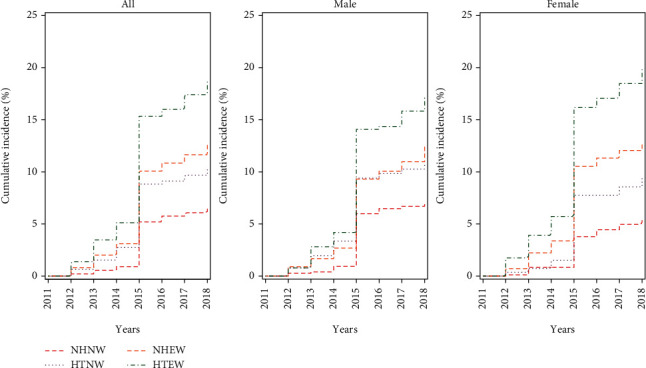
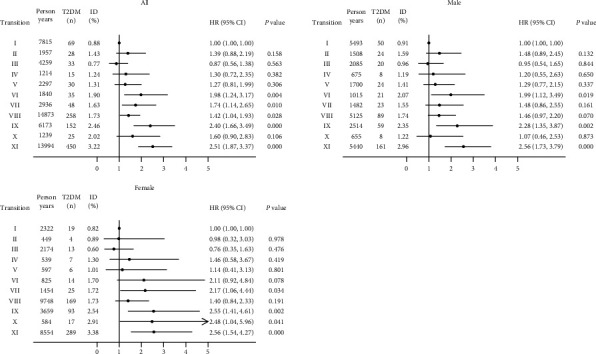
Results: During the follow-up of 8 years, 1263 participants developed incident T2DM. The hazard ratio (HR) for T2DM was 1.48 (95% CI: 1.12, 1.97), 1.56 (95% CI: 1.27, 1.92), and 2.15 (95% CI: 1.74, 2.67) in the HTNW, NHEW, and HTEW groups, respectively, compared with the NHNW group after controlling for confounding factors. When stratified by statuses of hypertension and WHtR transitions, the participants who transitioned from HTNW to HTEW (HR = 1.98, 95% CI: 1.24-3.17), or NHEW to NHNW/HTNW (HR = 1.74, 95% CI: 1.14-2.65), or remained NHEW (HR = 1.42, 95% CI: 1.04-1.93), or NHEW to HTEW (HR = 2.40, 95% CI: 1.66-3.49), or remained HTEW (HR = 2.51, 95% CI: 1.87-3.37) during the follow-up period showed a higher T2DM risk than the consistently NHNW participants.
Conclusions: Being HTNW, NHEW or HTEW or occurring adverse transitions between those states was strongly associated with T2DM onset. Effectively warding off hypertension and central obesity or preventing their further aggravation may substantially decrease the T2DM risk.
Copyright © 2022 Lin Han et al.
Conflict of interest statement
The authors declare that there is no conflict of interest.
Figures
References
-
- Saeedi P., Petersohn I., Salpea P., et al. Global and regional diabetes prevalence estimates for 2019 and projections for 2030 and 2045: results from the International Diabetes Federation Diabetes Atlas, 9th edition. Diabetes Research and Clinical Practice . 2019;157, article 107843 doi: 10.1016/j.diabres.2019.107843. - DOI - PubMed
-
- International Diabetes Federation. IDF Diabetes Atlas . 8th. 2017. June 2022, http://www.diabetesatlas.org. - PubMed
-
- Muntner P., Whelton P. K., Woodward M., Carey R. M. A comparison of the 2017 American College of Cardiology/American Heart Association blood pressure guideline and the 2017 American Diabetes Association diabetes and hypertension position statement for U.S. adults with diabetes. Diabetes Care . 2018;41(11):2322–2329. doi: 10.2337/dc18-1307. - DOI - PMC - PubMed
MeSH terms
LinkOut - more resources
Full Text Sources
Medical
