. 2022 Aug 15:13:901340.
doi: 10.3389/fphar.2022.901340. eCollection 2022.

Characterization of the SGLT2 Interaction Network and Its Regulation by SGLT2 Inhibitors: A Bioinformatic Analysis

Affiliations

Characterization of the SGLT2 Interaction Network and Its Regulation by SGLT2 Inhibitors: A Bioinformatic Analysis

Zofia Wicik et al. Front Pharmacol. .

Abstract

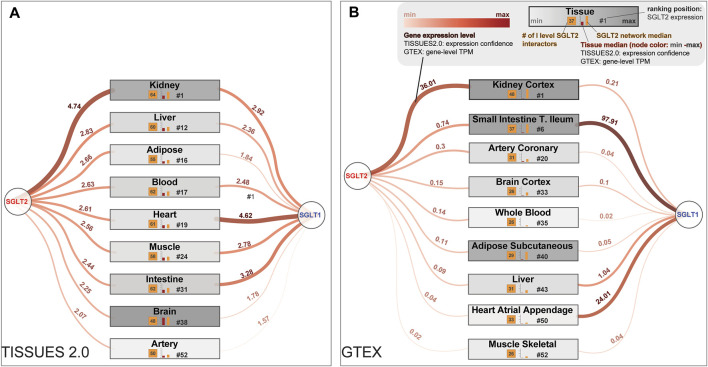
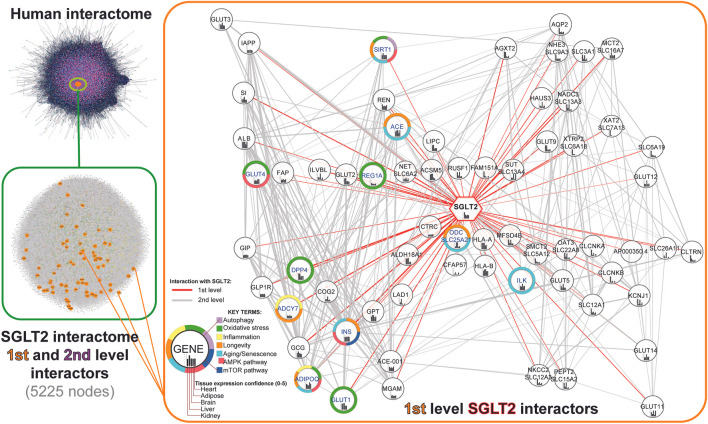
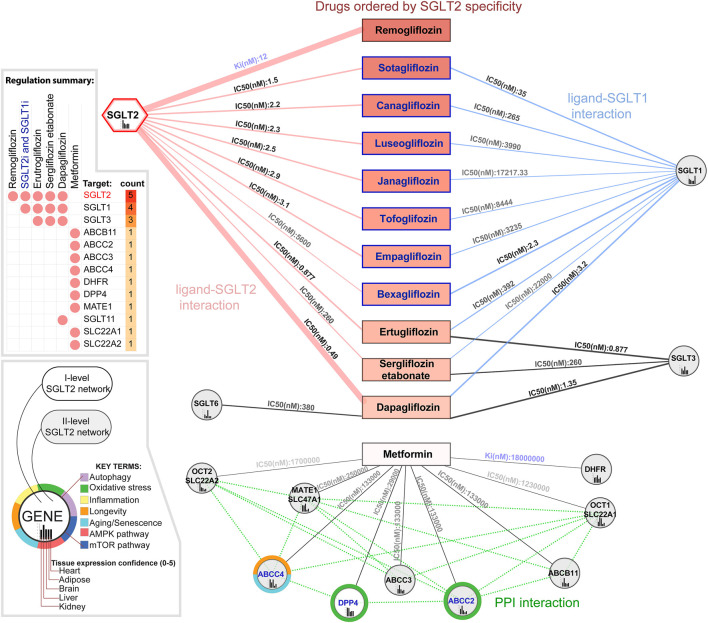
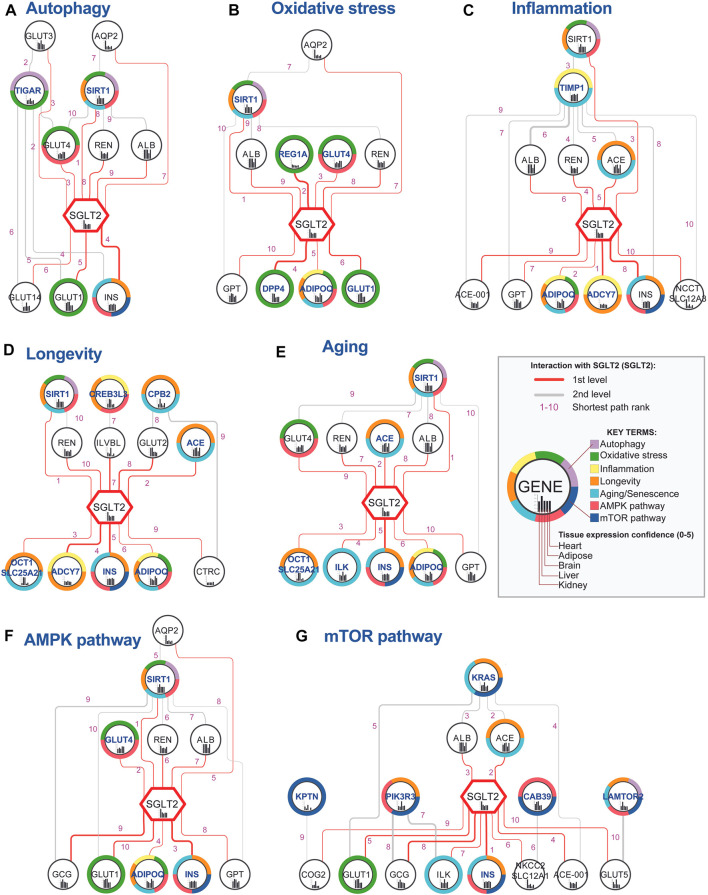
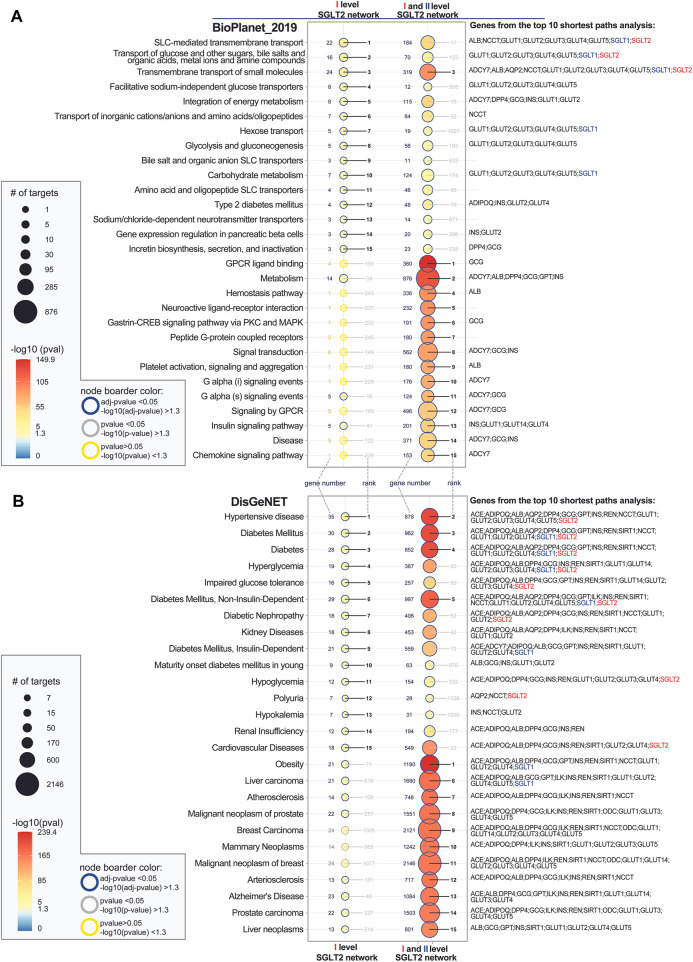
Background: Sodium-glucose cotransporter 2 (SGLT2), also known as solute carrier family 5 member 2 (SLC5A2), is a promising target for a new class of drugs primarily established as kidney-targeting, effective glucose-lowering agents used in diabetes mellitus (DM) patients. Increasing evidence indicates that besides renal effects, SGLT2 inhibitors (SGLT2i) have also a systemic impact via indirectly targeting the heart and other tissues. Our hypothesis states that the pleiotropic effects of SGLT2i are associated with their binding force, location of targets in the SGLT2 networks, targets involvement in signaling pathways, and their tissue-specific expression. Methods: Thus, to investigate differences in SGLT2i impact on human organisms, we re-created the SGLT2 interaction network incorporating its inhibitors and metformin and analyzed its tissue-specific expression using publicly available datasets. We analyzed it in the context of the so-called key terms ( autophagy, oxidative stress, aging, senescence, inflammation, AMPK pathways, and mTOR pathways) which seem to be crucial to elucidating the SGLT2 role in a variety of clinical manifestations. Results: Analysis of SGLT2 and its network components' expression confidence identified selected organs in the following order: kidney, liver, adipose tissue, blood, heart, muscle, intestine, brain, and artery according to the TISSUES database. Drug repurposing analysis of known SGLT2i pointed out the influence of SGLT1 regulators on the heart and intestine tissue. Additionally, dapagliflozin seems to also have a stronger impact on brain tissue through the regulation of SGLT3 and SLC5A11. The shortest path analysis identified interaction SIRT1-SGLT2 among the top five interactions across six from seven analyzed networks associated with the key terms. Other top first-level SGLT2 interactors associated with key terms were not only ADIPOQ, INS, GLUT4, ACE, and GLUT1 but also less recognized ILK and ADCY7. Among other interactors which appeared in multiple shortest-path analyses were GPT, COG2, and MGAM. Enrichment analysis of SGLT2 network components showed the highest overrepresentation of hypertensive disease, DM-related diseases for both levels of SGLT2 interactors. Additionally, for the extended SGLT2 network, we observed enrichment in obesity (including SGLT1), cancer-related terms, neuroactive ligand-receptor interaction, and neutrophil-mediated immunity. Conclusion: This study provides comprehensive and ranked information about the SGLT2 interaction network in the context of tissue expression and can help to predict the clinical effects of the SGLT2i.

Keywords: AMPK; SGLT2; SGLT2i; bioinformatic analysis; gene target interaction; mTOR; network; prognosis.


Conflict of interest statement

The authors declare that the research was conducted in the absence of any commercial or financial relationships that could be construed as a potential conflict of interest.

Figures

FIGURE 1
FIGURE 1
Most interesting tissues from a clinical point of view are sorted by the potential of being affected by SGLT2 and the first-level SGLT2 interaction network. These lists of tissues were generated according to the SGLT2 level, obtained from (A) The TISSUES 2.0 database expression confidence values and (B) Genotype-Tissue Expression (GTEx) project Transcripts Per Million (TPM) values. In the figure are also present expression levels of SGLT1, which is a co-target for some SGLT2 inhibitors. Legend for both panels is shown in the top right corner of panel (B).
FIGURE 2
FIGURE 2
Workflow of the SGLT2 interaction network retrieval from the human interactome. The first level SGLT2 network is visualized using a hierarchical layout, predicting the signal flow from the top to the bottom. Genes associated with specific key terms have blue labels.
FIGURE 3
FIGURE 3
Drugs modulating the SGLT2 and its network. In the figure are presented known SGLT2 ligands ordered vertically by increasing enzyme inhibition constant Ki (nM) and half maximal inhibitory concentration IC50 (nM). Additionally, we included metformin, not targeting SGLT2 but regulating other components of its network. Ki reflects the binding affinity, the smaller the Ki, the greater the binding affinity, and the smaller amount of medication needed in order to inhibit the activity of that enzyme. IC50 reflects the functional strength of the inhibitor for a drug, is dependent on the enzyme concentration, and is always larger than Ki. Genes associated with specific key terms have blue labels.
FIGURE 4
FIGURE 4
Top 10 shortest paths from 50 identified between SGLT2 (SLC2A5) and each key terms-related gene. Genes associated with specific key terms (A–G) have blue labels. The shortest path analysis was performed using the PathLinker Cytoscape app (Paths ranks are marked with pink numbers). Notice that interactions between SGLT2 and SIRT1 had very low ranks for all analyzed key terms, except for mTOR. The thickness of the edges is related to the interaction confidence level obtained from the String database.
FIGURE 5
FIGURE 5
Top 15 significantly enriched pathways (A) and diseases (B) associated with first level SGLT2 network and first and second level SGLT2 interactors. Analysis was performed using EnrichR API using the following databases Bioplanet_2019 (pathways), DisGenet (diseases). The enriched terms were ordered by the level of significance for the first level SGLT2 network and then for the extended interaction network. SGLT2 (SLC5A2) is marked with red color, and SGLT1 (SLC5A1, second-level interactor) with blue color. The adjusted p-values show categories, which are more likely to have biological meanings. The color gradient of the dots is associated with corresponding adjusted p-values. Red color indicates low p-values (high enrichment), and blue indicates high p-values (low enrichment). The size of the dots is associated with the number of enriched genes.

References

    1. Abe Y., Kikuchi T., Nagasaki K., Hiura M., Tanaka Y., Ogawa Y., et al. (2009). Usefulness of GPT for Diagnosis of Metabolic Syndrome in Obese Japanese Children. J. Atheroscler. Thromb. 16, 902–909. 10.5551/jat.1933 - DOI - PubMed
    1. Aitken-Saavedra J., Rojas-Alcayaga G., Maturana-Ramírez A., Escobar-Álvarez A., Cortes-Coloma A., Reyes-Rojas M., et al. (2015). Salivary Gland Dysfunction Markers in Type 2 Diabetes Mellitus Patients. J. Clin. Exp. Dent. 7, e501–5. 10.4317/jced.52329 - DOI - PMC - PubMed
    1. Alhaidan Y., Christesen H. T., Lundberg E., Balwi M. A. A., Brusgaard K. (2021). CRISPR/Cas9 ADCY7 Knockout Stimulates the Insulin Secretion Pathway Leading to Excessive Insulin Secretion. Front. Endocrinol. 12, 657873. 10.3389/fendo.2021.657873 - DOI - PMC - PubMed
    1. Bae J. H., Park E. G., Kim S., Kim S. G., Hahn S., Kim N. H. (2019). Effects of Sodium-Glucose Cotransporter 2 Inhibitors on Renal Outcomes in Patients with Type 2 Diabetes: A Systematic Review and Meta-Analysis of Randomized Controlled Trials. Sci. Rep. 9, 13009. 10.1038/s41598-019-49525-y - DOI - PMC - PubMed
    1. Bhatt D. L., Szarek M., Steg P. G., Cannon C. P., Leiter L. A., McGuire D. K., et al. (2021). Sotagliflozin in Patients with Diabetes and Recent Worsening Heart Failure. N. Engl. J. Med. 384, 117–128. 10.1056/NEJMoa2030183 - DOI - PubMed