. 2022 Nov 7;219(11):e20220650.
doi: 10.1084/jem.20220650. Epub 2022 Sep 1.

Broader Epstein-Barr virus-specific T cell receptor repertoire in patients with multiple sclerosis

Affiliations

Broader Epstein-Barr virus-specific T cell receptor repertoire in patients with multiple sclerosis

Tilman Schneider-Hohendorf et al. J Exp Med. .

Erratum in

  • Correction: Broader Epstein-Barr virus-specific T cell receptor repertoire in patients with multiple sclerosis.
    Schneider-Hohendorf T, Gerdes LA, Pignolet B, Gittelman R, Ostkamp P, Rubelt F, Raposo C, Tackenberg B, Riepenhausen M, Janoschka C, Wünsch C, Bucciarelli F, Flierl-Hecht A, Beltrán E, Kümpfel T, Anslinger K, Gross CC, Chapman H, Kaplan I, Brassat D, Wekerle H, Kerschensteiner M, Klotz L, Lünemann JD, Hohlfeld R, Liblau R, Wiendl H, Schwab N. Schneider-Hohendorf T, et al. J Exp Med. 2022 Nov 7;219(11):e2022065010252022c. doi: 10.1084/jem.2022065010252022c. Epub 2022 Oct 28. J Exp Med. 2022. PMID: 36305889 Free PMC article. No abstract available.

Abstract

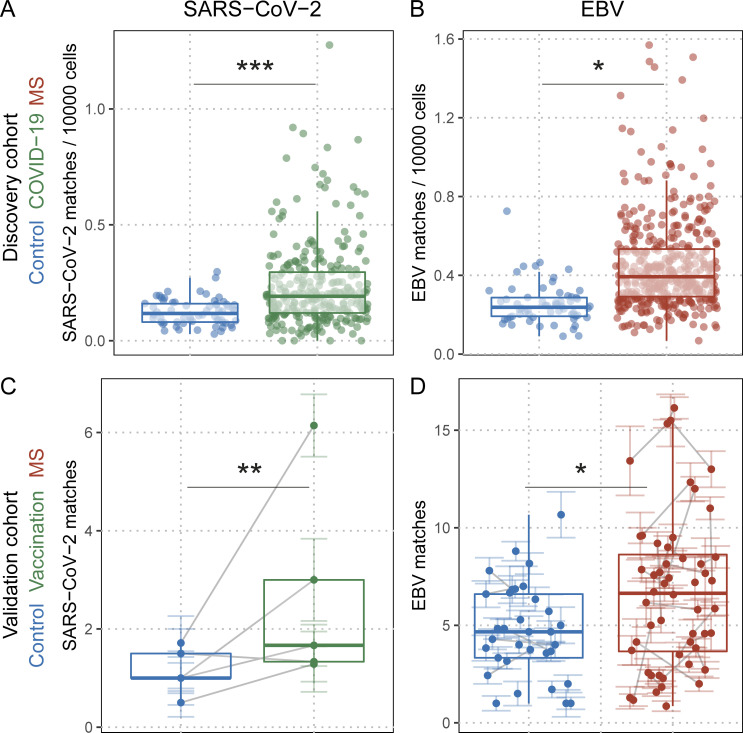
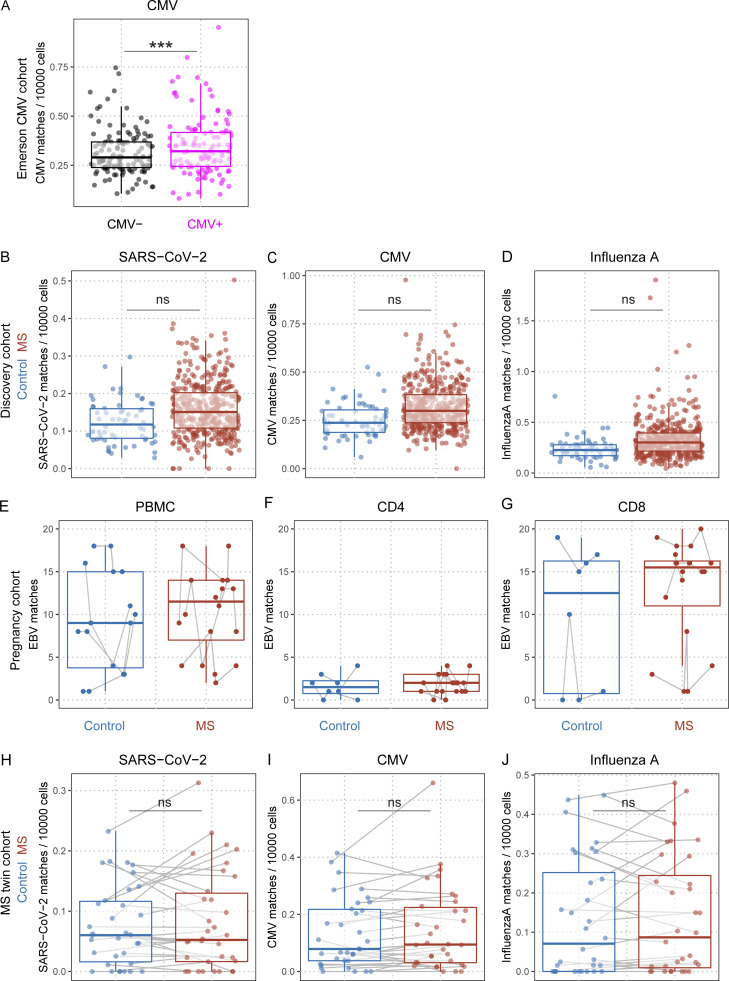
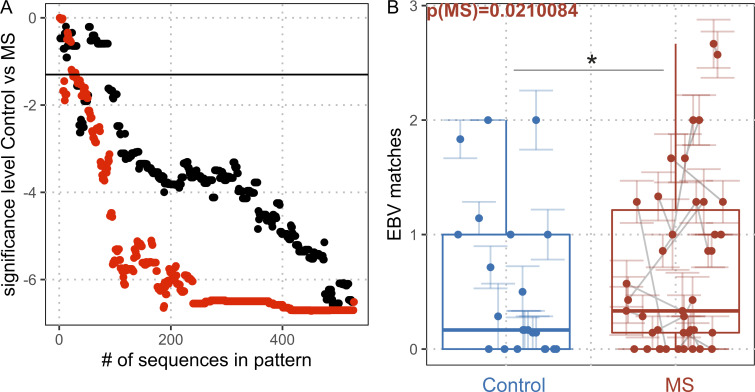
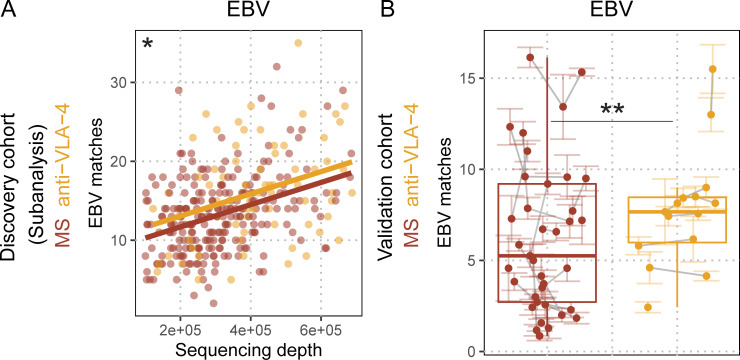
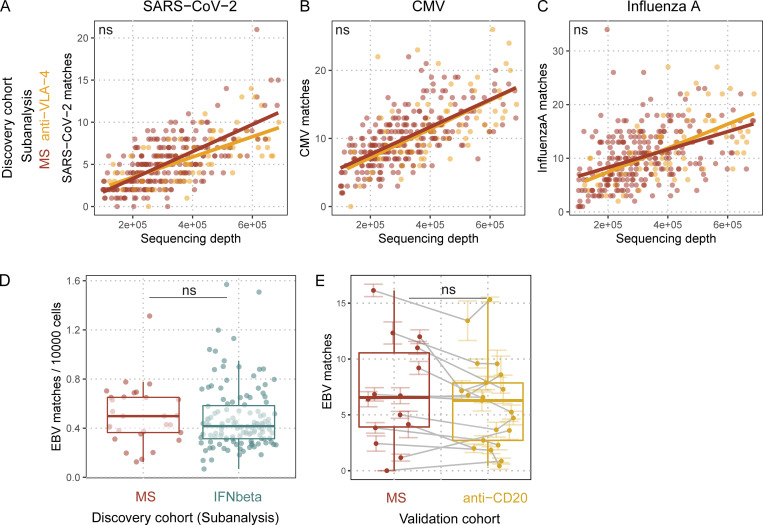
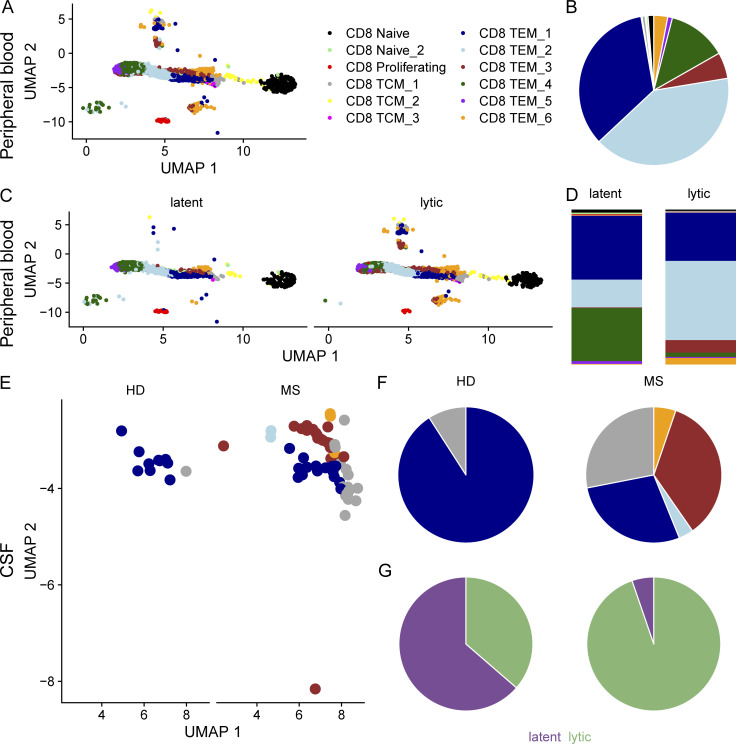
Epstein-Barr virus (EBV) infection precedes multiple sclerosis (MS) pathology and cross-reactive antibodies might link EBV infection to CNS autoimmunity. As an altered anti-EBV T cell reaction was suggested in MS, we queried peripheral blood T cell receptor β chain (TCRβ) repertoires of 1,395 MS patients, 887 controls, and 35 monozygotic, MS-discordant twin pairs for multimer-confirmed, viral antigen-specific TCRβ sequences. We detected more MHC-I-restricted EBV-specific TCRβ sequences in MS patients. Differences in genetics or upbringing could be excluded by validation in monozygotic twin pairs discordant for MS. Anti-VLA-4 treatment amplified this observation, while interferon β- or anti-CD20 treatment did not modulate EBV-specific T cell occurrence. In healthy individuals, EBV-specific CD8+ T cells were of an effector-memory phenotype in peripheral blood and cerebrospinal fluid. In MS patients, cerebrospinal fluid also contained EBV-specific central-memory CD8+ T cells, suggesting recent priming. Therefore, MS is not only preceded by EBV infection, but also associated with broader EBV-specific TCR repertoires, consistent with an ongoing anti-EBV immune reaction in MS.


Conflict of interest statement

Disclosures: R. Gittelman reported personal fees from Adaptive Biotechnologies during the conduct of the study. F. Rubelt reported a patent to US10731212B2 issued and a patent to immunoPETE related pending; and is an employee of Roche Diagnostics and receives salary, stock, and options as part of his employment compensation. C. Raposo reported being an employee and shareholder of F. Hoffmann-La Roche. B. Tackenberg reported other from F. Hoffmann-LaRoche outside the submitted work; and is a full-time employee of F. Hoffmann-LaRoche. T. Kümpfel reported personal fees from Novartis Pharma, Roche Pharma, Alexion/AstraZeneca, and Biogen for advisory boards/speaker honoraria outside the submitted work. C.C. Gross reported grants from DFG SFB/TR128 A09 during the conduct of the study; grants from DFG (single grant GR3946-3/1), IZKF (grant Kl13_010_19), Horizon2020 ReSToRe, Biogen, Roche, and Novartis Pharma; personal fees from MyLan and DIU Dresden International University GmbH; and other from Biogen, Euroimmun, MyLan, and Novartis Pharma outside the submitted work. I. Kaplan reported being an employee at Adaptive Biotechnologies during the time of this work. D. Brassat reported being a current Hoffman-La Roche employee. M. Kerschensteiner reported grants from Sanofi and personal fees from Sanofi, Biogen, Merck, Teva, Novartis, and Roche outside the submitted work. L. Klotz reported personal fees from Alexion, Bayer, Biogen, Celgene, Sanofi, Horizon, Grifols, Merck Serono, Novartis, Roche, Santhera, and Teva; and grants from German Research Foundation, IZKF Münster, IMF Münster, Biogen, Immunic AG, Novartis, and Merck Serono outside the submitted work. J.D. Lünemann reported personal fees from Abbvie, Alexion, Biogen, Novartis, Sanofi, and Takeda; and grants from Argenx, Merck, and Roche outside the submitted work. R. Liblau reported grants from GlaxoSmithKline, Foundation Bristol-Myers Squibb, Agence Nationale de la Recherche, the French MS Foundation, Cancer Research Institute, French Cancer Research Foundation, ERA-Net Narcomics, Recherche Hospitalo-Universitaire-BETPSY, and Roche; personal fees from Novartis, Sanofi-Genzyme, Biogen, Merck-Serono, and Third Rock Ventures; and other from Population Bio, Inc outside the submitted work. H. Wiendl reported personal fees for Abbvie, Alexion, Argenx, Biogen, Bristol Myers Squibb/Celgene, EMD Serono, F. Hoffmann-La Roche Ltd., Fondazione Cariplo, Genzyme, Gossamer Bio, Idorsia, Immunic, Immunovant, Janssen, Lundbeck, Merck, Neurodiem, NexGen, Novartis, PSI CRO, Roche Pharma AG, Sanofi, Swiss Multiple Sclerosis Society TEVA, UCB Biopharma, WebMD Global, and Worldwide Clinical Trials outside the submitted work. He reported grants by the DFG (CRC128 A09 and 445569437) during the conduct of the study, and funding by German Federal Ministry for Education and Research (BMBF), Deutsche Myasthenie Gesellschaft e.V., Alexion, Amicus Therapeutics Inc., Argenx, Biogen, CSL Behring, Roche, Genzyme, Merck, Novartis Pharma, Roche Pharma, and UCB Biopharma outside of the submitted work. N. Schwab reported grants from DFG, Biogen, and Roche during the conduct of the study. No other disclosures were reported.

Figures

Figure 1.
Figure 1.
Quantification of SARS-CoV-2– and EBV-specific T cell rearrangements in TCRβ repertoires of the discovery cohort and the validation cohort. (A and B) SARS-CoV-2 (qCOVID-19 = 4e−05; nHD = 62; nCOVID-19 = 278; A) and EBV (qMS = 0.01088; nHD = 62; nMS = 430; B) TCRβ sequence matches quantified in HD (blue dots), patients with acute COVID-19 (COVID-19, green dots), and MS patients (red dots); q values indicate adjusted significance of disease state (COVID-19 or MS) in linear models with the covariates sequencing depth, age, sex, and HLA. (C) SARS-CoV-2 TCRβ sequence matches quantified in HD before their first (blue dots) and after their second SARS-CoV-2 vaccination (green dots; qVaccination = 0.00196; n = 5). Colored lines indicate standard error of the mean of the biological replicates (sequencing pools) for the respective sample, and gray lines connect samples from the same individual. q values indicate adjusted significance of vaccination in linear mixed models with the covariates sequencing depth, vaccination status, and sequencing pools nested within samples within individuals. (D) EBV TCRβ sequence matches quantified in control donors (blue dots), and MS patients (red dots; qMS = 0.0298172; nControl = 27; nMS = 25). Colored lines indicate standard error of the mean of the sequencing pools for the respective sample, and gray lines connect samples from the same individual. q values indicate adjusted significance of MS in linear mixed models with the covariates sequencing depth, age, sex, treatment, and sequencing pools nested within samples within individuals.
Figure S1.
Figure S1.
Quantification of pathogen-specific TCRβ sequences in TCRβ repertoires. (A) CMV TCRβ sequence matches quantified in CMV-seronegative HD (black dots) and CMV-seropositive HD (magenta dots; Emerson et al., 2017) (pCMV Serostatus = 3e−07; nCMV− = 129; nCMV+ = 115); P value indicates significance of serostatus in linear models with the covariates sequencing depth, age, sex, and HLA. (B–D) SARS-CoV-2 (B), CMV (C), and influenza A (D). TCRβ sequence matches quantified in HD (blue dots) and MS patients (red dots; qMS = 1; nControl = 62; nMS = 430); q values indicate adjusted significance of disease state (MS) in linear models with the covariates sequencing depth, age, sex, and HLA. (E–G) EBV-specific TCRβ sequence matches quantified in pregnant HD (blue dots and boxes) and pregnant MS patients (red dots and boxes; pMS = 0.0001047, nControl = 4, nMS = 4; pCD4 = 2e−06, nControl = 2, nMS = 4; pCD8 = 0.0093175, nControl = 2, nMS = 4); gray lines connect samples from the same individual; P values indicate adjusted significance of MS (MS mean higher than HD mean), CD4 (CD4 mean lower than PBMC mean), and CD8 (CD8 mean higher than PBMC mean), in a combined linear mixed model with the covariates sequencing depth, age, pregnancy phase, cell subset, and HLA. (H–J) SARS-CoV-2 (H), CMV (I), and influenza A (J). TCRβ sequence matches quantified in monozygotic twins discordant for MS (healthy twin siblings, blue dots; and MS twin siblings, red dots; qMS = 1; nControl = 35; nMS = 35); gray lines indicate twinship; q values indicate adjusted significance of disease state (MS) in a linear mixed model with the covariates sequencing depth, age, disease status (HD, MS), symptomatic EBV infection in childhood, HLA, and twinship.
Figure S2.
Figure S2.
MS association of EBV-specific TCR sequences. (A) Shown is log10 of the P value (control versus MS) within the validation cohort when quantifying matches of 1–528 EBV-specific sequences. The sequences were added incrementally either randomly (black dots) or according to their MS association determined within the discovery cohort using lasso regression models (red dots, MS as target variable, adjustment for HLA background). The black line is drawn at log10 of 0.05 as the level of significance. (B) The top seven MS-associated EBV TCRβ sequences matched in control donors (blue dots) and MS patients (red dots) of the validation cohort; pMS = 0.0210084; nControl = 27; nMS = 25). Colored lines indicate standard error of the mean of the sequencing pools for the respective sample; gray lines connect samples from the same individual. P value indicates adjusted significance of MS in linear mixed models with the covariates sequencing depth, age, sex, treatment, and sequencing pools nested within samples within individuals.
Figure 2.
Figure 2.
Higher number of EBV matches in the TCRβ repertoires of the siblings with MS in monozygotic twins discordant for MS. EBV-specific TCRβ sequence matches quantified in syngeneic twins discordant for MS (healthy twin siblings, blue dots; and MS twin siblings, red dots; qMS = 0.02868; nControl = 35; nMS = 35); gray lines indicate twinship, q values indicate adjusted significance of disease state (MS) in a linear mixed model with the covariates sequencing depth, age, disease status (HD, MS), symptomatic EBV infection in childhood, HLA, and twinship.
Figure 3.
Figure 3.
Treatment with anti–VLA-4 blocking antibody sequesters EBV-specific T cells. (A) EBV TCRβ sequence matches quantified in untreated MS patients (red dots and line) and anti–VLA-4 blocking antibody-treated MS patients (orange dots and line) against sequencing depth (number of productive templates in the sample; qanti-VLA-4 = 0.04156; nMS = 248; nanti-VLA-4 = 73); lines indicate linear regressions, q values indicate adjusted significance of treatment in linear models with the covariates sequencing depth, age, sex, and HLA. (B) EBV TCRβ sequence matches quantified in MS patients (red dots) and anti-VLA–treated MS patients (orange dots; qanti-VLA-4 = 0.0081492; nMS = 17; nanti-VLA-4 = 8). Colored lines indicate standard error of the mean of the sequencing pools for the respective sample; gray lines connect samples from the same individual. q values indicate adjusted significance of anti-VLA–treatment in linear mixed models with the covariates sequencing depth, age, sex, treatment, and sequencing pools nested within samples within individuals.
Figure S3.
Figure S3.
Quantification of pathogen-specific TCRβ sequences in TCRβ repertoires with regard to MS treatments. (A–C) SARS-CoV-2 (A), CMV (B), and influenza A (C). TCRβ sequence matches quantified in untreated MS patients (red dots and line) and anti-VLA-4–treated MS patients (orange dots and line) against sequencing depth (number of productive templates in the sample; SARS-CoV-2:qanti-VLA-4 = 0.41808; CMV:qanti-VLA-4 = 1; influenza A:qanti-VLA-4 = 1; nMS = 248; nanti-VLA-4 = 73); lines indicate linear regressions; q values indicate adjusted significance of treatment in linear models with the covariates sequencing depth, age, sex, and HLA. (D) EBV TCRβ sequence matches quantified in treatment-naive MS patients (red dots) and MS patients only treated with IFNβ (cyan dots; qIFNbeta = 1; nMS = 29; nIFNbeta = 123); q values indicate adjusted significance of treatment in linear models with the covariates sequencing depth, age, sex, and HLA. (E) EBV TCRβ sequence matches quantified in MS patients before their anti-CD20 treatment (red dots), and after their anti-CD20 treatment (yellow dots; qanti-CD20 = 0.068; nMS = 14; nanti-CD20 = 14). Colored lines indicate standard error of the mean of the sequencing pools for the respective sample; gray lines connect samples from the same individual. q values indicate adjusted significance of anti-CD20 treatment in linear mixed models with the covariates sequencing depth, age, sex, treatment, and sequencing pools nested within samples within individuals.
Figure 4.
Figure 4.
scRNAseq analysis illustrates phenotype of the EBV-specific CD8+ T cells in HD and MS patients. (A) UMAP plot of the level-3 granularity mapped CD8+ T cells of four deeply sequenced healthy controls previously described by Boutet et al. (2019). Color indicates cluster annotation. (B) Quantification of the cluster affiliation of EBV-specific CD8+ T cells. (C) UMAP plot of the level-3 granularity mapped EBV-specific CD8+ T cells, split according to their specificity against latent or lytic EBV epitopes. (D) Quantification of latent (left) and lytic (right) cluster affiliation. (E) UMAP plot of the level-3 granularity mapped CSF cells from 6 HD and 5 MS patients from Pappalardo et al. (2020). Only EBV sequence–matched CD8+ T cells are shown. (F) Quantification of the cluster affiliation of EBV-specific CSF cells from HD (left) and MS patients (right). (G) Quantification of the specificity against either latent (purple) or lytic (green) proteins of EBV-specific CSF cells from HD (left) and MS patients (right).

References

    1. Abrahamyan, S., Eberspacher B., Hoshi M.M., Aly L., Luessi F., Groppa S., Klotz L., Meuth S.G., Schroeder C., Gruter T., et al. . 2020. Complete Epstein-Barr virus seropositivity in a large cohort of patients with early multiple sclerosis. J. Neurol. Neurosurg. Psychiatr. 91:681–686. 10.1136/jnnp-2020-322941 - DOI - PMC - PubMed
    1. Aloisi, F., and Salvetti M.. 2022. Epstein-barr virus and multiple sclerosis: Supporting causality. Lancet Neurol. 21:300–301. 10.1016/S1474-4422(22)00086-2 - DOI - PubMed
    1. Angelini, D.F., Serafini B., Piras E., Severa M., Coccia E.M., Rosicarelli B., Ruggieri S., Gasperini C., Buttari F., Centonze D., et al. . 2013. Increased CD8+ T cell response to epstein-barr virus lytic antigens in the active phase of multiple sclerosis. PLoS Pathog. 9:e1003220. 10.1371/journal.ppat.1003220 - DOI - PMC - PubMed
    1. Bagaev, D.V., Vroomans R.M.A., Samir J., Stervbo U., Rius C., Dolton G., Greenshields-Watson A., Attaf M., Egorov E.S., Zvyagin I.V., et al. . 2020. VDJdb in 2019: Database extension, new analysis infrastructure and a T-cell receptor motif compendium. Nucleic Acids Res. 48:D1057–D1062. 10.1093/nar/gkz874 - DOI - PMC - PubMed
    1. Bar-Or, A., Pender M.P., Khanna R., Steinman L., Hartung H.P., Maniar T., Croze E., Aftab B.T., Giovannoni G., and Joshi M.A.. 2021. Epstein-barr virus in multiple sclerosis: Theory and emerging immunotherapies: (Trends in molecular medicine, 26:3 p:296-310, 2020). Trends Mol. Med. 27:410–411. 10.1016/j.molmed.2021.01.004 - DOI - PMC - PubMed

Publication types

MeSH terms

Substances