. 2023 Feb 8;76(3):e561-e570.
doi: 10.1093/cid/ciac717.

Severe Mycobacterial Immune Reconstitution Inflammatory Syndrome (IRIS) in Advanced Human Immunodeficiency Virus (HIV) Has Features of Hemophagocytic Lymphohistiocytosis and Requires Prolonged Immune Suppression

Affiliations

Severe Mycobacterial Immune Reconstitution Inflammatory Syndrome (IRIS) in Advanced Human Immunodeficiency Virus (HIV) Has Features of Hemophagocytic Lymphohistiocytosis and Requires Prolonged Immune Suppression

Joseph M Rocco et al. Clin Infect Dis. .

Abstract

Background: People with HIV and mycobacterial infections can develop immune reconstitution inflammatory syndrome (IRIS) after starting antiretroviral therapy (ART). Severe mycobacterial IRIS has an overlapping clinical phenotype with hemophagocytic lymphohistiocytosis (HLH). We evaluated the pathophysiologic similarities between mycobacterial IRIS and HLH to identify clinical and immune predictors of mycobacterial IRIS severity.

Methods: HLH criteria were applied to a longitudinal cohort of 80 patients with HIV (CD4 <100 cells/µL) and mycobacterial infections. Participants were subdivided into IRIS meeting HLH criteria (HLH-IRIS), IRIS without HLH (IRIS), and those without IRIS (non-IRIS). Clinical outcomes were evaluated by regression analyses. Soluble biomarkers and T-cell subsets were assessed at baseline and IRIS-equivalent time points.

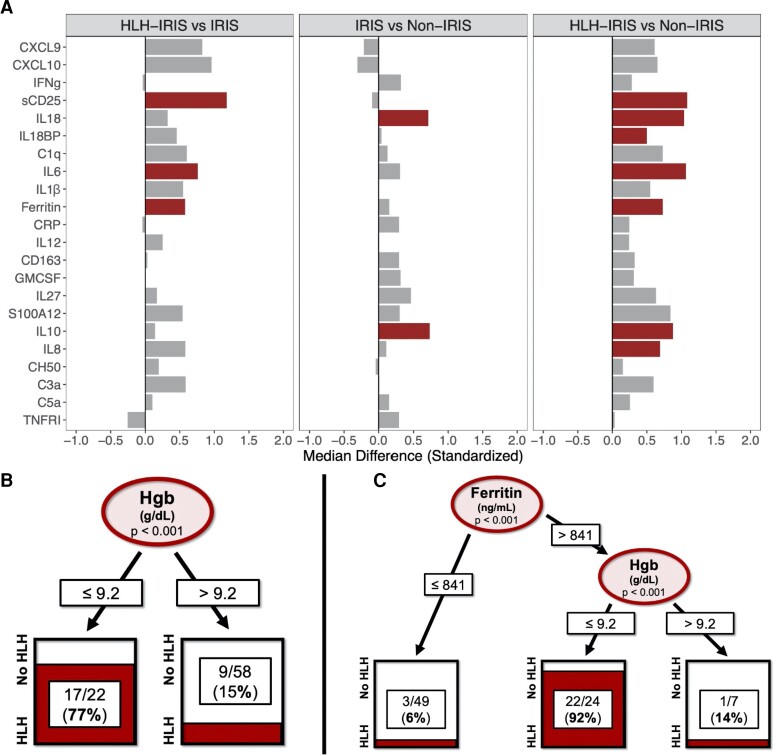
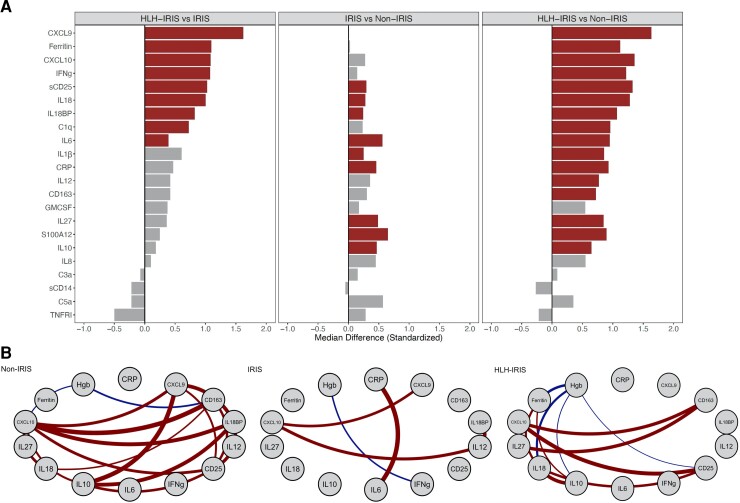
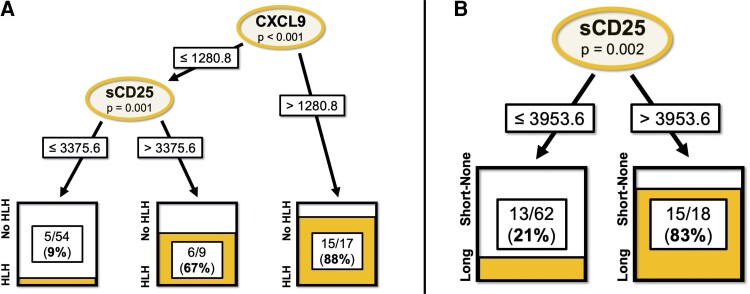
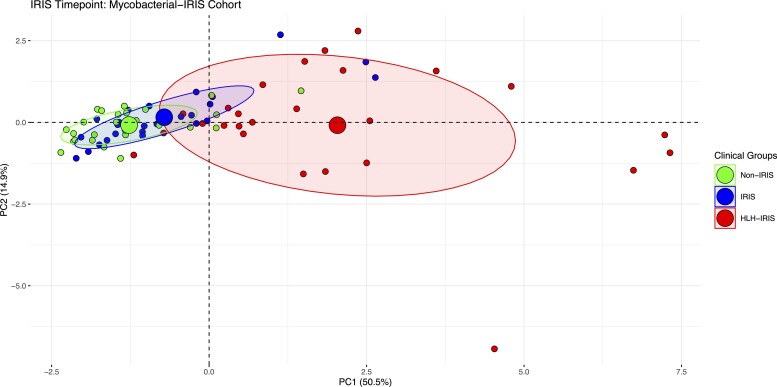
Results: HLH-IRIS patients required corticosteroids more frequently (OR: 21.5; 95%CI: 5.6-114.8) and for longer duration (21.2; 95%CI: 10.7-31.7 weeks) than those not meeting HLH criteria. Utilizing decision tree analyses, hemoglobin <9.2 g/dL was the best predictor of HLH-IRIS before ART, whereas ferritin, CXCL9 and sCD25 were most diagnostic for HLH at IRIS onset. At the IRIS timepoint, but not baseline, HLH-IRIS patients had lower regulatory and higher activated T cells along with greater production of IFNγ-IL-18 axis biomarkers compared with both IRIS and non-IRIS groups. Principal component analysis corroborated the distinct clustering of HLH-IRIS patients.

Conclusions: Severe mycobacterial IRIS and HLH have an overlapping pathogenesis involving IFNγ and unopposed T-cell activation causing severe inflammatory disease clinically distinguished by hyperferritinemia (hyperferritinemic IRIS [FIRIS]). Hemoglobin, ferritin, CXCL9, and sCD25 identify high-risk patients and may improve risk stratification and therapeutic strategies for mycobacterial IRIS.

Keywords: human immunodeficiency virus; immune reconstitution inflammatory syndrome; macrophage activation syndrome; mycobacteria; tuberculosis.


Conflict of interest statement

Potential conflicts of interest. I. S. reports a patent, unrelated to this work, “Methods for the treatment of Kaposi's sarcoma or KSHV-induced lymphoma using immunomodulatory compounds, and uses of biomarkers (WO 2016210262 A1)”. All other authors report no potential conflicts. All authors have submitted the ICMJE Form for Disclosure of Potential Conflicts of Interest. Conflicts that the editors consider relevant to the content of the manuscript have been disclosed.

Figures

Figure 1.
Figure 1.
Comparison of biomarkers at the baseline time point between the groups and decision-tree analyses for HLH-IRIS using biomarkers or clinical variables. A, Biomarkers were standardized using median and interquartile ranges, and bar plots are displayed as fold-differences between groups. Differences that reached statistical significance after adjustment for multiple comparisons (adjusted P < .05) are represented in colored bars. There was no increase in IFNγ or its associated markers in the HLH-IRIS group. Soluble CD25, IL-6, and ferritin remained elevated when HLH-IRIS was compared with both the IRIS and non-IRIS groups. Only IL-10 and IL-18 were elevated in both the HLH-IRIS and IRIS groups when compared with the non-IRIS group. Decision trees predicting HLH-IRIS were performed using (B) all available clinical laboratory tests, which included baseline hemoglobin and clinical laboratory values at IRIS onset (white blood cell count, hemoglobin, platelets, ferritin, fibrinogen, triglycerides, and aspartate aminotransferase), and (C) all 14 markers used in the initial decision tree (IFNγ, CXCL9, CXCL10, IL-18, IL-18BP, sCD25, CD163, IL-6, CRP, IL-10, IL-27, C1q, hemoglobin, ferritin), except from the baseline time point. Potential splits are only included in the tree model if they met the Bonferroni-adjusted P value for statistical significance (P < .05). Ovals indicate a split in the prediction rule on a specific variable, along with the corresponding P value. Each square shows the percentage of observations within that branch that met the outcome variable. Hemoglobin values are represented as g/dL and ferritin as ng/mL. Abbreviations: BP, binding protein; CRP, C-reactive protein; CXCL, C-X-C motif chemokine ligand; GMCSF, granulocyte-macrophage colony–stimulating factor; Hgb, hemoglobin; HLH, hemophagocytic lymphohistiocytosis; IFNγ (IFNg), interferon-γ; IL, interleukin; IRIS, immune reconstitution inflammatory syndrome; sCD25, soluble CD25; TNFRI, tumor necrosis factor α receptor I.
Figure 2.
Figure 2.
Comparison of biomarkers between the groups at the IRIS time point and Spearman correlation network analyses of each group at IRIS onset or the week 4 time point. A, Biomarkers were standardized using medians and interquartile ranges, and bar plots are displayed as fold-differences between groups. Differences that reached statistical significance after adjustment for multiple comparisons (adjusted P < .05) are represented as colored bars. A strong IFNγ signature (IFNγ, CXCL9, CXCL10, IL-18BP) was noted in the HLH-IRIS group when compared with the IRIS and non-IRIS groups. Comparison between IRIS and non-IRIS groups showed an absence of this IFNγ signature but differences in innate immune/myeloid activation markers (CRP, IL-6, IL-10, IL-27). B, Spearman correlation network analyses were performed within each group. Connecting lines represent statistically significant correlations (P < .001) with a correlation coefficient of r > 0.4 or r < −0.4. Red connecting lines represent positive correlations while blue lines infer negative correlations. Significant differences in inflammatory networks were identified with a balanced pattern of correlations in the non-IRIS group, which dramatically decreased in the patients with IRIS. Only the IRIS group demonstrated a strong correlation between CRP and IL-6. The HLH-IRIS group showed a redistribution of the inflammatory network with significant associations between CXCL10 with CD163 and sCD25. Ferritin correlated strongly with IL-18 and both of these markers were negatively associated with hemoglobin. Abbreviations: BP, binding protein; CRP, C-reactive protein; CXCL, C-X-C motif chemokine ligand; GMCSF, granulocyte-macrophage colony–stimulating factor; Hgb, hemoglobin; HLH, hemophagocytic lymphohistiocytosis; IFNγ (IFNg), interferon-γ; IL, interleukin; IRIS, immune reconstitution inflammatory syndrome; sCD25, soluble CD25; TNFRI, tumor necrosis factor α receptor I.
Figure 3.
Figure 3.
Decision-tree analyses predicting (A) HLH-IRIS and (B) prolonged (>8 weeks) corticosteroid course at the IRIS time point. Decision trees were constructed using 12 biomarkers (IFNγ, CXCL9, CXCL10, IL-18, IL-18BP, sCD25, CD163, IL-6, CRP, IL-10, IL-27, C1q) and 2 clinical laboratory tests (ferritin, hemoglobin) with the R “ctree” package (version 4.1.2; R Foundation for Statistical Computing). Potential splits are only included in the tree model if they met the Bonferroni-adjusted P value for statistical significance (P < .05). Ovals indicate a split in the prediction rule on a specific variable, along with the corresponding P value. Each rectangle shows the percentage of observations within that branch that met the outcome variable. The binary outcomes of HLH versus no HLH and steroids >8 weeks (Long) versus steroids <8 weeks or no steroids (Short-None) were evaluated. Biomarker values are represented as pg/mL. Abbreviations: BP, binding protein; CRP, C-reactive protein; CXCL, C-X-C motif chemokine ligand; Hgb, hemoglobin; HLH, hemophagocytic lymphohistiocytosis; IFNγ, interferon-γ; IL, interleukin; IRIS, immune reconstitution inflammatory syndrome; sCD25, soluble CD25.
Figure 4.
Figure 4.
T-cell counts and phenotypes across the 3 study groups at the IRIS-equivalent timepoint. Data are presented as boxplots with medians and interquartile ranges. Groups were compared using the Kruskal–Wallis test and significant differences (P < .05) were further evaluated with pairwise Wilcoxon and Holm correction. No significant differences were noted in the percentage or absolute CD4 and CD8 T-cell counts (A, B, D, E). A statistically significant increase in activated CD4 (CD4+CD38+HLA-DR+) and CD8 (CD8+CD38+HLA-DR+) T cells was identified in the HLH-IRIS group (C, F). Regulatory (CD4+CD25+FOXP3+) T cells (Tregs) were decreased in HLH-IRIS compared with the other groups (G), and there was an increase in the activated CD4 T-cell to Treg ratio in the HLH-IRIS cohort using cell percentages and absolute numbers (H, I). Abbreviations: HLH, hemophagocytic lymphohistiocytosis; IRIS, immune reconstitution inflammatory syndrome; ns, not significant. *P < .05; **P < .01; ***P < .001; ****P < .0001.
Figure 5.
Figure 5.
Multidimensional analysis of biomarkers and T-cell phenotypes distinguishes patients with HLH-IRIS from those with IRIS not meeting HLH criteria. Principal component analysis combining the IFNγ–IL-18 axis biomarkers and T-cell phenotypes (activated CD4+, CD8+ T cells, and regulatory T cells) depicting the clustering of patients across the study groups at the IRIS time point. Individuals are represented by small colored circles for each group, whereas the overall group is represented by large colored circles. The week 4 time point was used for the non-IRIS cohort. There is a distinct separation of the HLH-IRIS cluster, emphasizing the unique pathophysiology in this subset of patients, which portends more severe inflammatory disease and the need for greater immunosuppression and close clinical monitoring. Analysis was performed in R using the FactoMineR and factoextra packages (R Foundation for Statistical Computing). Abbreviations: HLH, hemophagocytic lymphohistiocytosis; IFNγ, interferon-γ; IL, interleukin; IRIS, immune reconstitution inflammatory syndrome; PC, principal component.

Similar articles

Cited by

References

    1. Sereti I, Sheikh V, Shaffer D, et al. . Prospective international study of incidence and predictors of immune reconstitution inflammatory syndrome and death in people living with human immunodeficiency virus and severe lymphopenia. Clin Infect Dis 2020; 71:652–60. - PMC - PubMed
    1. Benda R, David M, Franchel F, Kahn M. Multiple brain cold abscesses during pulmonary tuberculosis treated by antibiotics; proof of their tuberculous origin furnished by the surgical specimens. Bull Mem Soc Med Hop Paris 1954; 70:802–6. - PubMed
    1. World Health Organization . Consolidated guidelines on HIV prevention, testing, treatment, service delivery and monitoring: recommendations for a public health approach, 2021 update. Geneva, Switzerland: World Health Organization, 2021. - PubMed
    1. Quinn CM, Poplin V, Kasibante J, et al. . Tuberculosis IRIS: pathogenesis, presentation, and management across the spectrum of disease. Life (Basel) 2020; 10:262. - PMC - PubMed
    1. Tan HY, Yong YK, Shankar EM, et al. . Aberrant inflammasome activation characterizes tuberculosis-associated immune reconstitution inflammatory syndrome. J Immunol 2016; 196:4052–63. - PubMed

Publication types

MeSH terms

Grants and funding