. 2022 Oct 17;132(20):e160152.
doi: 10.1172/JCI160152.

Targeting acetylcholine signaling modulates persistent drug tolerance in EGFR-mutant lung cancer and impedes tumor relapse

Affiliations

Targeting acetylcholine signaling modulates persistent drug tolerance in EGFR-mutant lung cancer and impedes tumor relapse

Meng Nie et al. J Clin Invest. .

Abstract

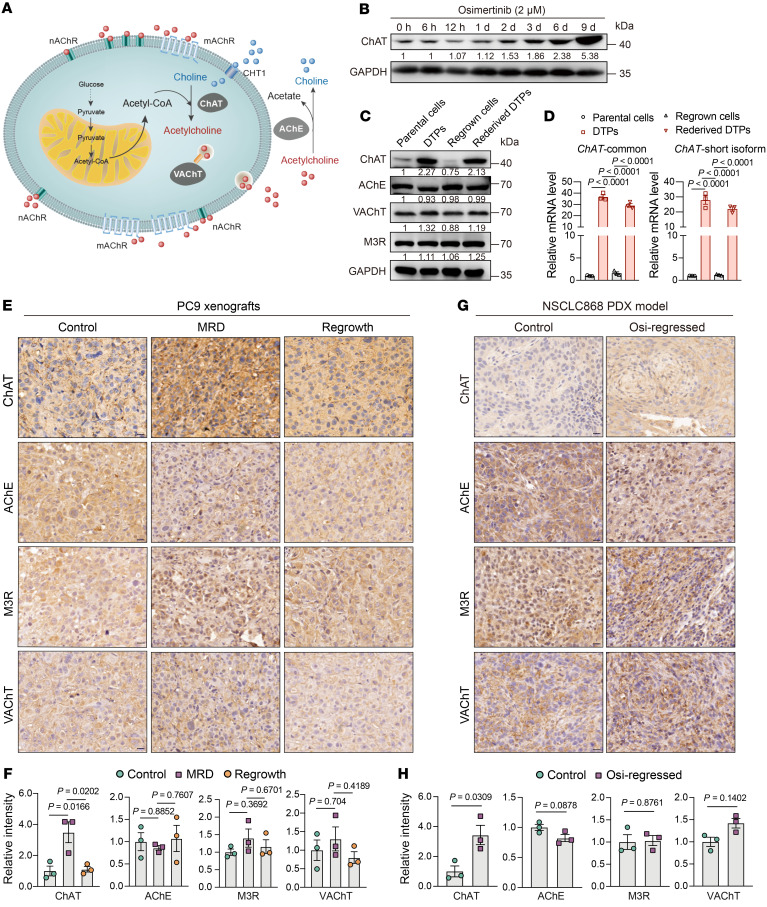
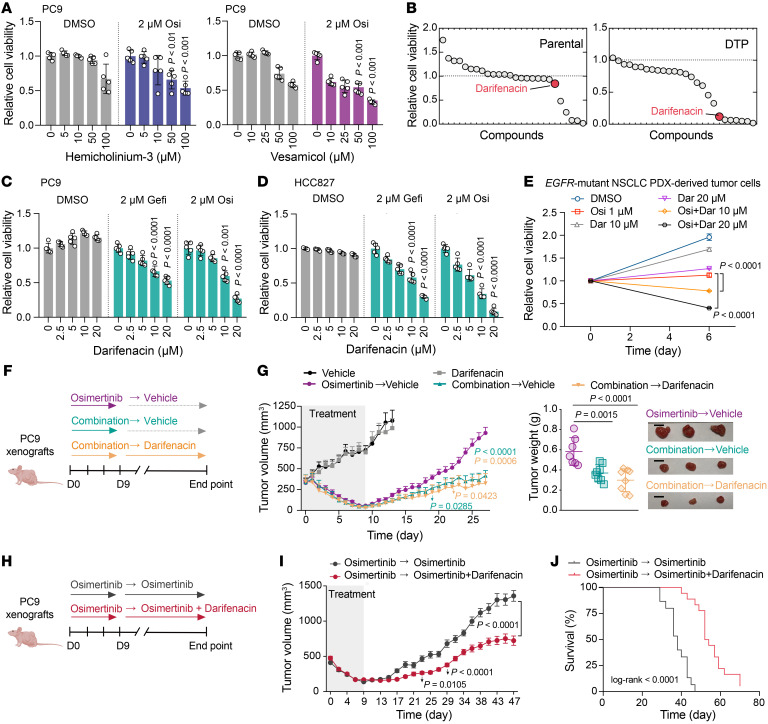
Although first-line epidermal growth factor receptor (EGFR) tyrosine kinase inhibitor (TKI) therapy is effective for treating EGFR-mutant non-small cell lung cancer (NSCLC), it is now understood that drug-tolerant persister (DTP) cells escaping from initial treatment eventually drives drug resistance. Here, through integration of metabolomics and transcriptomics, we found that the neurotransmitter acetylcholine (ACh) was specifically accumulated in DTP cells, and demonstrated that treatment with EGFR-TKI heightened the expression of the rate-limiting enzyme choline acetyltransferase (ChAT) in ACh biosynthesis via YAP mediation. Genetic and pharmacological manipulation of ACh biosynthesis or ACh signaling could predictably regulate the extent of DTP formation in vitro and in vivo. Strikingly, pharmacologically targeting ACh/M3R signaling with an FDA-approved drug, darifenacin, retarded tumor relapse in vivo. Mechanistically, upregulated ACh metabolism mediated drug tolerance in part through activating WNT signaling via ACh muscarinic receptor 3 (M3R). Importantly, we showed that aberrant ACh metabolism in patients with NSCLC played a potential role in predicting EGFR-TKI response rate and progression-free survival. Our study therefore defines a therapeutic strategy - targeting the ACh/M3R/WNT axis - for manipulating EGFR TKI drug tolerance in the treatment of NSCLC.

Keywords: Drug therapy; Lung cancer; Metabolism; Oncology; Tolerance.


Figures

Figure 1
Figure 1. Accumulation of neurotransmitter ACh in EGFR-TKI–induced DTP cells and regressed tumors from NSCLC mouse xenografts.
(A) Top: Schematic representation of the establishment of DTP cells. Bottom: Dose-response curves of parental and DTP cells incubated in increasing concentrations of osimertinib for 72 hours (n = 5). (B) Metabolites differentiating between parental and DTP cells (FDR < 0.05, fold change > 1.5 or < 0.67). Top 10 upregulated or downregulated metabolites with absolute log2(fold change) > 2 are shown. (C) Changes in metabolites associated with choline metabolism in PC9-derived and HCC827-derived DTP cells relative to parental PC9 and HCC827 cells. Log2(fold change) (DTP cells/parental cells) of metabolites are represented by color intensity. (D) GO analysis of upregulated genes in PC9-derived DTP cells compared with parental PC9 cells. (E) Quantification of ACh and choline levels in control and osimertinib-regressed tumors derived from NSCLC645 mouse PDX models. n = 3 mice; 3 fragments were harvested for analysis in each tumor of controls. (F) Quantification of ACh and choline levels in control and osimertinib-regressed tumors derived from NSCLC868 mouse PDX models. n = 3 or 4 mice; 3 fragments were harvested for analysis in each tumor of controls. In A, E, and F, data are shown as mean ± SEM. Significance was assessed using 2-way ANOVA adjusted by Bonferroni’s correction (A) or 2-tailed Student’s t test (E and F).
Figure 2
Figure 2. The reversible ACh levels and metabolic profiles of drug tolerance state in vivo.
(A) Quantification of ACh levels in PC9 cells treated with 2 μM osimertinib for various time periods (n = 5). (B) PC9-xenograft mice were treated with 5 mg/kg osimertinib alone for 9 days and then osimertinib was withdrawn. Tissue samples were collected from control (n = 9), MRD (n = 6), and regrown (n = 9) tumors. (C) t-SNE plot of control (n = 9), MRD (n = 6), and regrown (n = 9) tumors according to metabolites detected from targeted metabolomics. (D) Clustering of metabolites detected in control (n = 9), MRD (n = 6), and regrown (n = 9) tumors. Black lines represent the average trajectory for each cluster. (E) Heatmap showing the abundance of differential metabolites (FDR < 0.05, fold change > 1.5 or < 0.67) with reversibility among control, MRD, and regrown tumors. Color intensity represents metabolite abundance. (F) Quantification of ACh and choline levels in control (n = 9), MRD (n = 6), and regrown tumors (n = 9) derived from PC9-xenograft model. In A and F, data are shown as mean ± SEM. Significance was assessed using 1-way ANOVA with Tukey’s test.
Figure 3
Figure 3. EGFR-TKI treatment heightens the expression of ChAT.
(A) Schematic of the ACh biosynthesis, secretion, signaling activation, and degradation. (B) Relative protein levels of the short ChAT isoform in PC9 cells treated with 2 μM osimertinib for various time periods. (C) Relative protein levels of ACh metabolism modulators in parental PC9 cells, DTPs, regrown cells, and rederived DTPs. (D) Relative ChAT mRNA levels in parental PC9 cells, DTPs, regrown cells, and rederived DTPs analyzed by qPCR with primers for common and short isoform–specific exons of ChAT (n = 3). (E and F) Representative image and quantification of immunohistochemical staining of ChAT, VAChT, M3R, and AChE on the indicated control, MRD, and regrown tumor sections from PC9 xenografts (n = 3 mice per group). Scale bars: 20 μm. (G and H) Representative image and quantification of immunohistochemical staining of ChAT, VAChT, M3R, and AChE on the indicated control and osimertinib-regressed tumor sections from the PDX model (n = 3 mice per group). Scale bars: 20 μm. In D, F, and H, data are shown as mean ± SEM. Significance was assessed using 1-way ANOVA with Tukey’s test (D and F) or 2-tailed Student’s t test (H).
Figure 4
Figure 4. ChAT expression is activated transcriptionally through YAP mediation.
(A) Microscopic image showing the uncloned PC9 cells or cells from 5 different single-cell-derived PC9 clones treated with 2 μM osimertinib for 9 days to identify DTPs. (B) Quantification of ACh levels in 5 different single-cell-derived PC9 clones treated with 2 μM osimertinib for 9 days (n = 5). (C) Protein levels of the short ChAT isoform in 5 different single-cell-derived PC9 clones treated with 2 μM osimertinib for 9 days. (D) ChIP-qPCR analyses in PC9 cells showing YAP bound to the enhancers 1 and 3 of the ChAT gene after 2 μM osimertinib treatment for 48 hours (n = 4). (E) Luciferase reporter assay in PC9 cells with stable silencing of YAP or control shRNA (shCtrl) treated with 2 μM osimertinib for 72 hours (n = 3). (F) Relative ChAT mRNA levels in PC9 cells with shYAP or shCtrl treated with 2 μM osimertinib for 9 days. Gene silencing was confirmed by Western blot on the left. (G) Relative protein levels of the short ChAT isoform in PC9 cells with shYAP or shCtrl treated with 2 μM osimertinib for 9 days. (H) Quantification of ACh levels in PC9 cells with shYAP or shCtrl treated with 2 μM osimertinib for 9 days (n = 5). In B, DF, and H, data are shown as mean ± SEM. Significance was assessed using 2-way ANOVA with Tukey’s test (B, D, E, and H) or 1-way ANOVA with Tukey’s test (F).
Figure 5
Figure 5. Activated ACh metabolism and signaling promotes tolerance to EGFR inhibition in vitro and in vivo.
(A) Colony formation assay of cells treated with indicated drugs (n = 3). (B) Relative viability of cells treated with osimertinib and 10 μM ACh (n = 5). (C) Linear regression analysis of correlation between short ChAT isoform levels and osimertinib sensitivity log10(IC50). (D) Colony formation assay of PC9 single-cell clones exposed to osimertinib (n = 3). (E) Colony formation assay of Flag-ChAT short isoform overexpression (ChAT-OE, 41 kDa) and negative control (NC) cells treated with osimertinib (n = 3). (F) PC9-xenograft mice injected with ChAT-OE or NC cells were treated with 5 mg/kg osimertinib for 9 days or with vehicle. n = 7 or 8 per group. (G) Relative viability of PC9 WT and ChAT-knockout cells treated with osimertinib and 10 μM ACh (n = 6). (H) Colony formation assay of PC9 WT and ChAT-knockout cells treated with osimertinib and ACh (n = 3). (I) PC9-xenograft mice injected with WT and ChAT-knockout cells were treated with 5 mg/kg osimertinib for 9 days or with vehicle. ACh was injected subcutaneously once daily (n = 7). (J) PC9-xenograft mice injected with WT and ChAT-knockout cells were treated with 1 mg/kg osimertinib or with vehicle. n = 5 or 6 per vehicle group, n = 11 or 14 per osimertinib treatment group. (K) Percentage survival curve generated from PC9-xenograft mice. In A, B, and DJ, data are shown as mean ± SEM. Significance was assessed using 1-way ANOVA with Dunnett’s test (A), 2-way ANOVA with Tukey’s test (B and G), 1-way ANOVA with Tukey’s test (D, E and H), 2-way ANOVA adjusted by Bonferroni’s correction (F, I and J), or 2-sided log-rank test (K).
Figure 6
Figure 6. Pharmacological inhibition of ACh/M3R signaling suppresses DTP formation and retards tumor relapse.
(A) Relative viability of PC9 cells cotreated with osimertinib and the indicated concentrations of hemicholinium-3 or vesamicol for 6 days (n = 5). (B) Drug screen in parental and PC9-derived DTP cells. Compounds were added in DMSO-containing (as parental cells group) or 2 μM EGFR-TKI–containing medium (as DTP cells group) for 6 days (n = 5). (C and D) Relative viability of cells cotreated with osimertinib or gefitinib and darifenacin for 6 days (n = 5). (E) Relative viability of tumor cells derived from the EGFR-mutant NSCLC645 PDX xenografts treated with osimertinib and darifenacin, alone or in combination for 6 days (n = 4 or 6). (F and G) PC9-xenograft mice were treated with 5 mg/kg osimertinib alone or in combination with 5 mg/kg darifenacin for 9 days, after which osimertinib was then withdrawn (osimertinib → vehicle, n = 7), combination of drugs was withdrawn (combination → vehicle, n = 8), or osimertinib was withdrawn and darifenacin treatment was continued (combination → darifenacin, n = 8) until the end of the experiment. Average tumor weights and image of relapsed tumors are shown on the right. Scale bars: 1 cm. (H and I) PC9-xenograft tumors were treated with 1 mg/kg osimertinib for 9 days followed by 1 mg/kg osimertinib (n = 15) or in combination with 5 mg/kg darifenacin (n = 18). (J) Percentage survival curve generated from PC9-xenograft mice that were treated with osimertinib alone (n = 15) or osimertinib for 9 days followed by combination with darifenacin (n = 18). In A, CE, G, and I, data are shown as mean ± SEM. Significance was assessed using 1-way ANOVA with Dunnett’s test (A, C, and D), 2-way ANOVA with Dunnett’s test (E), 2-way ANOVA adjusted by Bonferroni’s correction (G and I), or 2-sided log-rank test (J).
Figure 7
Figure 7. ACh modulates DTP cell formation through activating WNT signaling.
(A) Heatmap of WNT signaling–related gene expression values in PC9-derived DTP versus parental PC9 cells (n = 2) with RNA-seq. Rows are z scores calculated for each gene in both cell types. (B) Log2-transformed fold change in the expression of WNT ligands and WNT target genes comparing PC9-derived DTP cells to parental PC9 cells with RNA-seq. (C) Relative mRNA levels of CD133, AXIN2, WNT3A, and WNT6 in control (n = 4) and MRD (n = 3) PC9 xenografts. (D and E) Representative image and quantification of immunohistochemical staining of WNT6 and WNT9A on the indicated control and MRD tumor sections from PC9 xenografts. n = 3 mice per group. Scale bar: 50 μm. (F) Relative mRNA levels of WNT signaling–related genes in PC9 cells treated with osimertinib or indicated concentrations of darifenacin alone or in combination for 6 days (n = 3). (G) Western blot showing β-catenin and nonphosphorylated β-catenin in nuclear extract (NE) and cytosol extract (CE) of PC9 cells treated with 2 μM osimertinib or DMSO, alone or in combination with 20 μM darifenacin or 20 μM vesamicol. (H) Relative viability of PC9-derived DTP cells cotreated with darifenacin and WNT signaling activator CHIR99021 or WNT3A (n = 5 or 6). (I) Relative viability of PC9 cells treated with 2 μM osimertinib and indicated concentrations of darifenacin and WNT signaling inhibitor LGK974 or ICG-001, alone or in combination, for 6 days (n = 5). In C, E, F, H, and I, data are shown as mean ± SEM. Significance was assessed using 2-tailed Student’s t test (C and E) or 1-way ANOVA with Tukey’s test (F, H, and I).
Figure 8
Figure 8. Tumor ChAT expression and plasma ACh levels correlate with drug response to EGFR-TKI in human NSCLC patients.
(A) Representative image of immunohistochemical staining of ChAT and AChE on tumor sections collected from human NSCLC patients before and after EGFR-TKI treatment. Scale bar: 20 μm. (B) The proportion of responders and nonresponders to EGFR-TKI among patients according to ChAT and AChE levels (high, top 50%; low, bottom 50%) before EGFR-TKI treatment. (C) Changes in ChAT and AChE on tumor sections collected from human NSCLC patients before and after EGFR-TKI treatment. Ratios of ChAT and AChE levels (Post versus Pre) with significant changes were labeled as red (increase) and blue (decrease), or others labeled as black. (D) Pretreatment plasma samples were collected from human NSCLC patients for ACh detection. The illustration was created with BioRender.com. (E) The proportion of responders and nonresponders to EGFR-TKI among patients with low (bottom 25%, n = 19), medium (medium 50%, n = 40), and high (top 25%, n = 19) levels of pretreatment plasma ACh. (F) Kaplan-Meier survival of patients with high, medium, and low levels of pretreatment plasma ACh. Significance was assessed using the χ2 test (B and E) or Gehan-Breslow-Wilcoxon test (F).

References

    1. Hirsch FR, et al. Lung cancer: current therapies and new targeted treatments. Lancet. 2017;389(10066):299–311. doi: 10.1016/S0140-6736(16)30958-8. - DOI - PubMed
    1. Boumahdi S, de Sauvage FJ. The great escape: tumour cell plasticity in resistance to targeted therapy. Nat Rev Drug Discov. 2019;19(1):39–56. - PubMed
    1. Rotow J, Bivona TG. Understanding and targeting resistance mechanisms in NSCLC. Nat Rev Cancer. 2017;17(11):637–658. doi: 10.1038/nrc.2017.84. - DOI - PubMed
    1. Sharma SV, et al. A chromatin-mediated reversible drug-tolerant state in cancer cell subpopulations. Cell. 2010;141(1):69–80. doi: 10.1016/j.cell.2010.02.027. - DOI - PMC - PubMed
    1. Raha D, et al. The cancer stem cell marker aldehyde dehydrogenase is required to maintain a drug-tolerant tumor cell subpopulation. Cancer Res. 2014;74(13):3579–3590. doi: 10.1158/0008-5472.CAN-13-3456. - DOI - PubMed

Publication types

MeSH terms