. 2022 Oct;28(10):2016-2026.
doi: 10.3201/eid2810.212567. Epub 2022 Sep 1.

Improving Estimates of Social Contact Patterns for Airborne Transmission of Respiratory Pathogens

Improving Estimates of Social Contact Patterns for Airborne Transmission of Respiratory Pathogens

Nicky McCreesh et al. Emerg Infect Dis. 2022 Oct.

Abstract

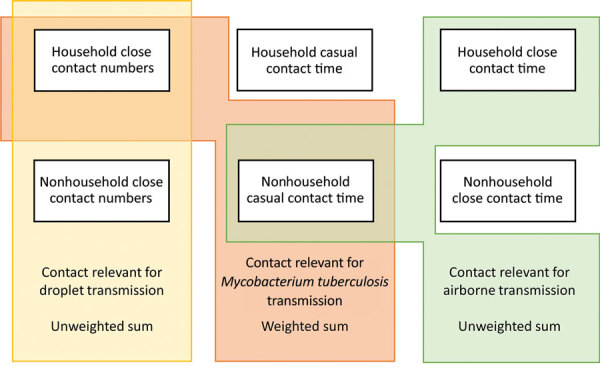
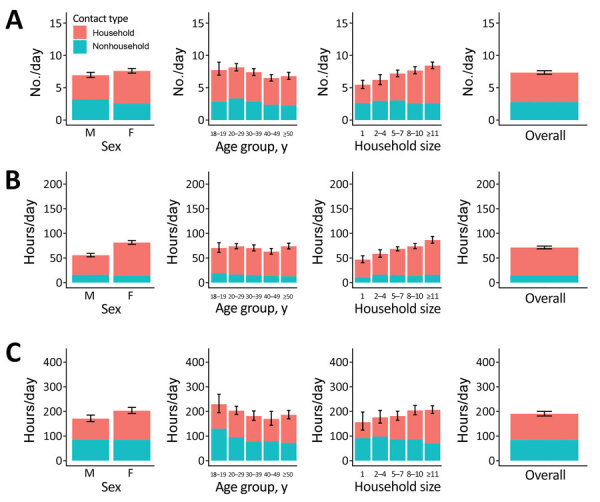
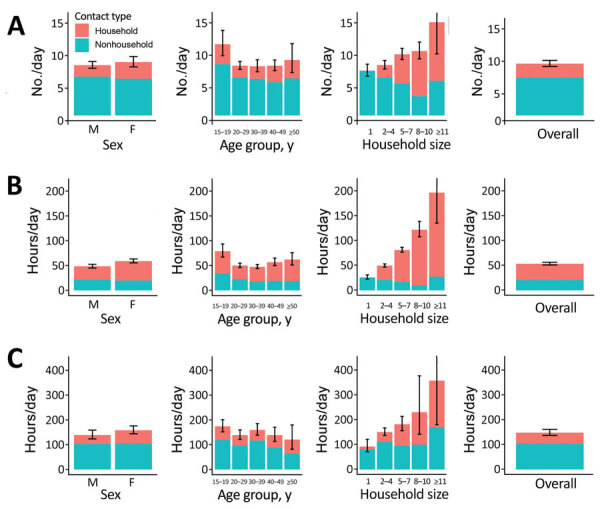
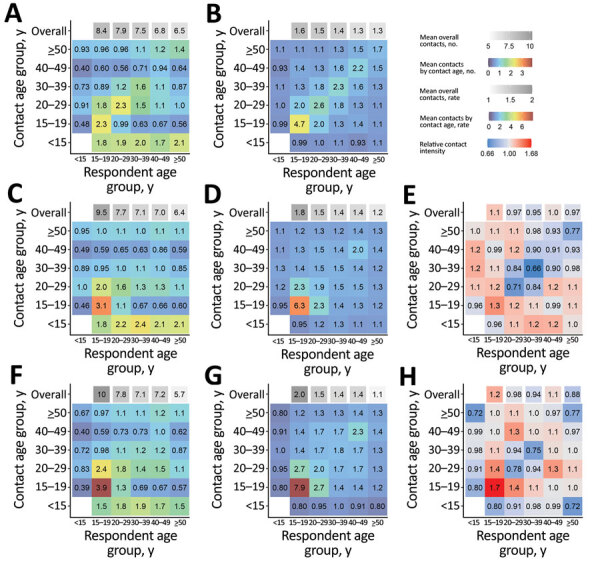
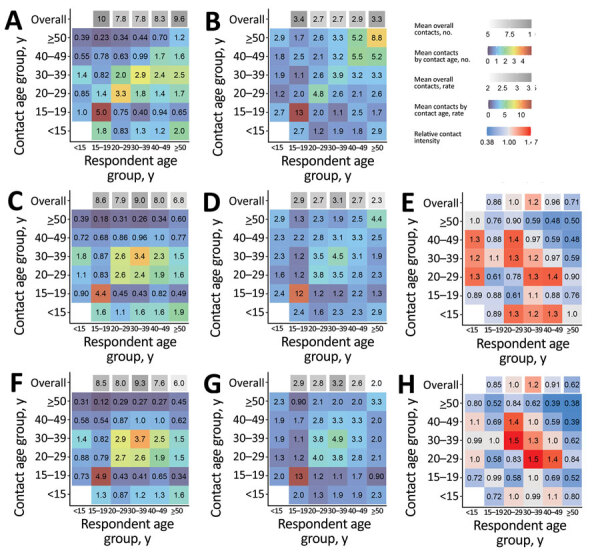
Data on social contact patterns are widely used to parameterize age-mixing matrices in mathematical models of infectious diseases. Most studies focus on close contacts only (i.e., persons spoken with face-to-face). This focus may be appropriate for studies of droplet and short-range aerosol transmission but neglects casual or shared air contacts, who may be at risk from airborne transmission. Using data from 2 provinces in South Africa, we estimated age mixing patterns relevant for droplet transmission, nonsaturating airborne transmission, and Mycobacterium tuberculosis transmission, an airborne infection where saturation of household contacts occurs. Estimated contact patterns by age did not vary greatly between the infection types, indicating that widespread use of close contact data may not be resulting in major inaccuracies. However, contact in persons >50 years of age was lower when we considered casual contacts, and therefore the contribution of older age groups to airborne transmission may be overestimated.

Keywords: South Africa; age-mixing; airborne; mathematical modelling; respiratory infections; social contact; tuberculosis; tuberculosis and other mycobacteria.


Figures

Figure 1
Figure 1
Summary of data used to estimate age-mixing matrices for a study of social contact patterns for airborne transmission of respiratory pathogens, KwaZulu Natal and Western Cape Provinces, South Africa, 2019. Diagram showing how age-mixing matrices relevant for the transmission of droplet infections, airborne infections, and Mycobacterium tuberculosis were estimated using empirical data on close contact numbers, close contact time, and casual contact time.
Figure 2
Figure 2
Household and nonhousehold close contact numbers (A), close contact time (B), and casual contact time (C) for study of social contact patterns for airborne transmission of respiratory pathogens, KwaZulu-Natal Province, South Africa, by sex, age group, and household size. Error bars show 95% CIs for total contact numbers or time. For KwaZulu-Natal, household size data were taken from census data and did not always correspond exactly with respondents’ views of who they considered to be household members. For this reason, some contact with household members was reported by respondents who we recorded as having a household size of 1.
Figure 3
Figure 3
Household and nonhousehold close contact numbers (A), close contact time (B), and casual contact time (C) in Western Cape Province, South Africa, by sex, age, and household size, for study of social contact patterns for airborne transmission of respiratory pathogens. Error bars show 95% CIs for total contact numbers or time. In Western Cape, contact with household members was reported by a small proportion of respondents who had reported having no household members, most likely reflecting errors in the data.
Figure 4
Figure 4
Age-mixing matrices relevant for droplet transmission (A,B), nonsaturating airborne transmission (C,D), and Mycobacterium tuberculosis transmission (F,G) for study of social contact patterns for airborne transmission of respiratory pathogens, KwaZulu-Natal Province, South Africa. Panels A, C, and F show absolute contact intensities between respondents and contacts in each age group; panels B, D, and G show intensities of contact between each member of each age group; panels E and H show intensities for airborne infections and M. tuberculosis compared with intensities for droplet infections, respectively. Numbers shown in panel A are the mean number of contacts respondents in each age group have with contacts in each age group per day. Numbers shown in panel B are the rate of contact between each person in the population per day, expressed as rates × 105. Numbers and rates in panels C, D, F, and G are standardized so that the mean overall contact intensity by reported by adult respondents is the same as the mean number of overall close contacts reported by adult respondents (panel A). Contact numbers between child respondents and contacts in each age group were estimated from data on contact between adult respondents and child contacts.
Figure 5
Figure 5
Age-mixing matrices relevant for droplet transmission (A,B), nonsaturating airborne transmission (C,D), and Mycobacterium tuberculosis transmission (F,G) for study of social contact patterns for airborne transmission of respiratory pathogens, Western Cape Province, South Africa. Panels A, C, and F show absolute contact intensities between respondents and contacts in each age group; panels B, D, and G show intensities of contact between each member of each age group; panels E and H show intensities for airborne infections and Mycobacterium tuberculosis compared with intensities for droplet infections, respectively. Numbers shown in panel A are the mean number of contacts respondents in each age group have with contacts in each age group per day. Numbers shown in panel B are the rate of contact between each person in the population per day, expressed as rates × 105. Numbers and rates in panels C, D, F, and G are standardized so that the mean overall contact intensity by reported by adult respondents is the same as the mean number of overall close contacts reported by adult respondents (panel A). Contact numbers between child respondents and contacts in each age group were estimated from data on contact between adult respondents and child contacts.

References

    1. Prem K, Cook AR, Jit M. Projecting social contact matrices in 152 countries using contact surveys and demographic data. PLOS Comput Biol. 2017;13:e1005697. 10.1371/journal.pcbi.1005697 - DOI - PMC - PubMed
    1. Hoang T, Coletti P, Melegaro A, Wallinga J, Grijalva CG, Edmunds JW, et al. A systematic review of social contact surveys to inform transmission models of close contact infections. Epidemiology. 2019;30:723–36. 10.1097/EDE.0000000000001047 - DOI - PMC - PubMed
    1. Raffalli J, Sepkowitz KA, Armstrong D. Community-based outbreaks of tuberculosis. Arch Intern Med. 1996;156:1053–60. 10.1001/archinte.1996.00040041053002 - DOI - PubMed
    1. Ku C-C, MacPherson P, Khundi M, Nzawa R, Feasey HR, Nliwasa M, et al. Estimated durations of asymptomatic, symptomatic, and care-seeking phases of tuberculosis disease. BMC Med. 2021;19:298. 10.1186/s12916-021-02128-9 - DOI - PMC - PubMed
    1. McCreesh N, White RG. An explanation for the low proportion of tuberculosis that results from transmission between household and known social contacts. Sci Rep. 2018;8:5382. 10.1038/s41598-018-23797-2 - DOI - PMC - PubMed

Publication types

LinkOut - more resources