. 2023 Apr;19(4):1221-1238.
doi: 10.1080/15548627.2022.2119353. Epub 2022 Sep 13.

Isoginkgetin, a potential CDK6 inhibitor, suppresses SLC2A1/GLUT1 enhancer activity to induce AMPK-ULK1-mediated cytotoxic autophagy in hepatocellular carcinoma

Affiliations

Isoginkgetin, a potential CDK6 inhibitor, suppresses SLC2A1/GLUT1 enhancer activity to induce AMPK-ULK1-mediated cytotoxic autophagy in hepatocellular carcinoma

Jie Yao et al. Autophagy. 2023 Apr.

Abstract

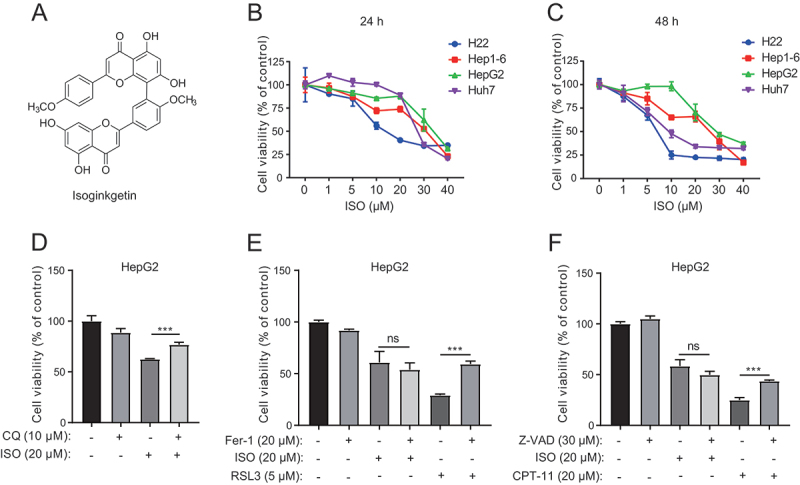
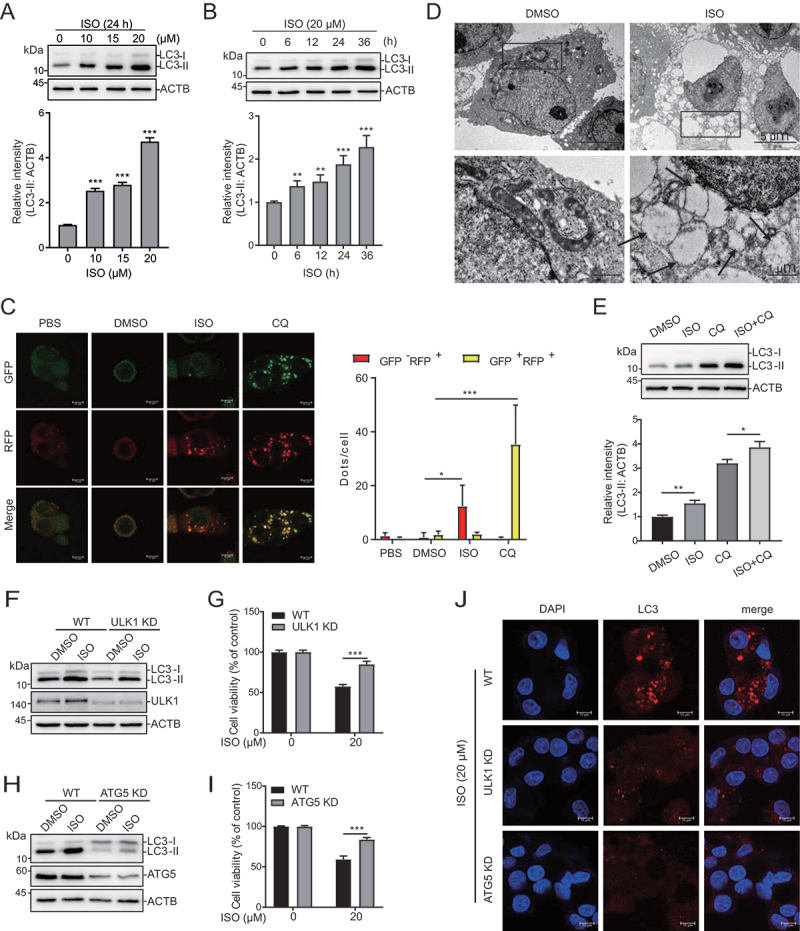
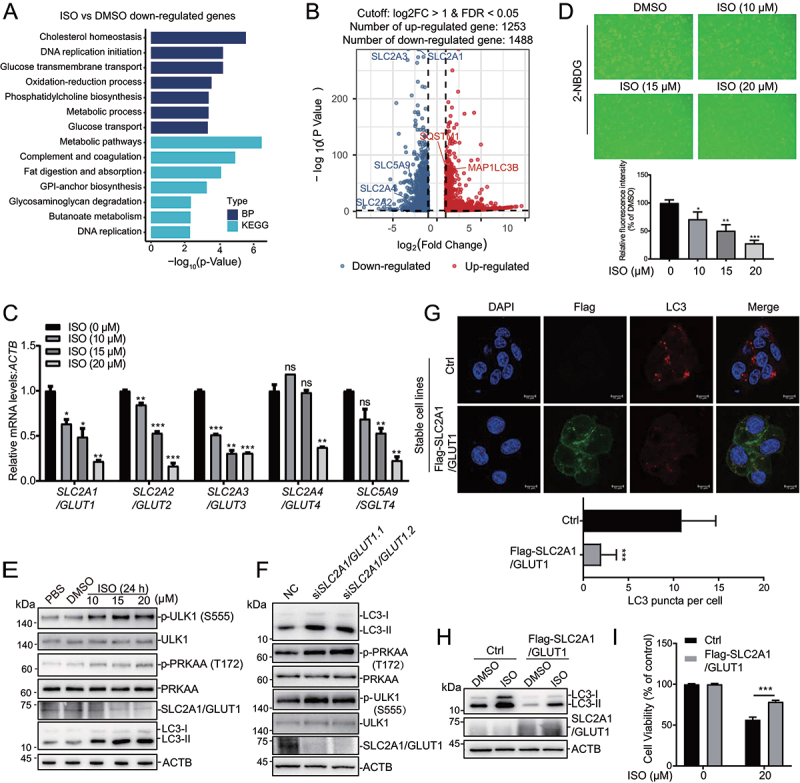
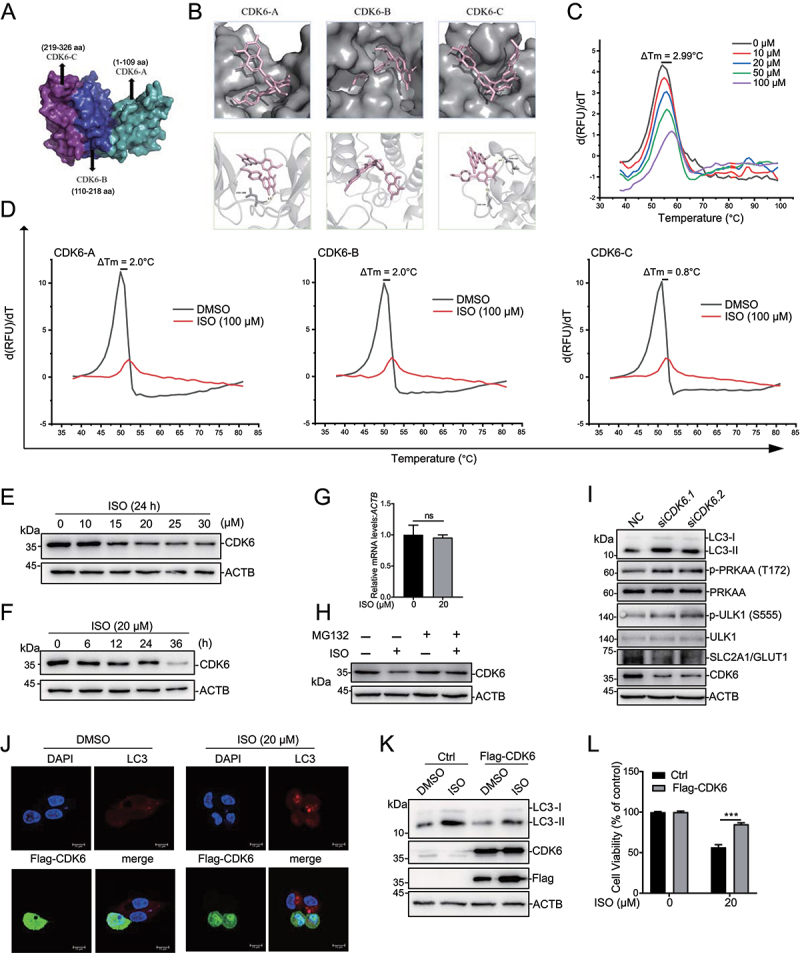
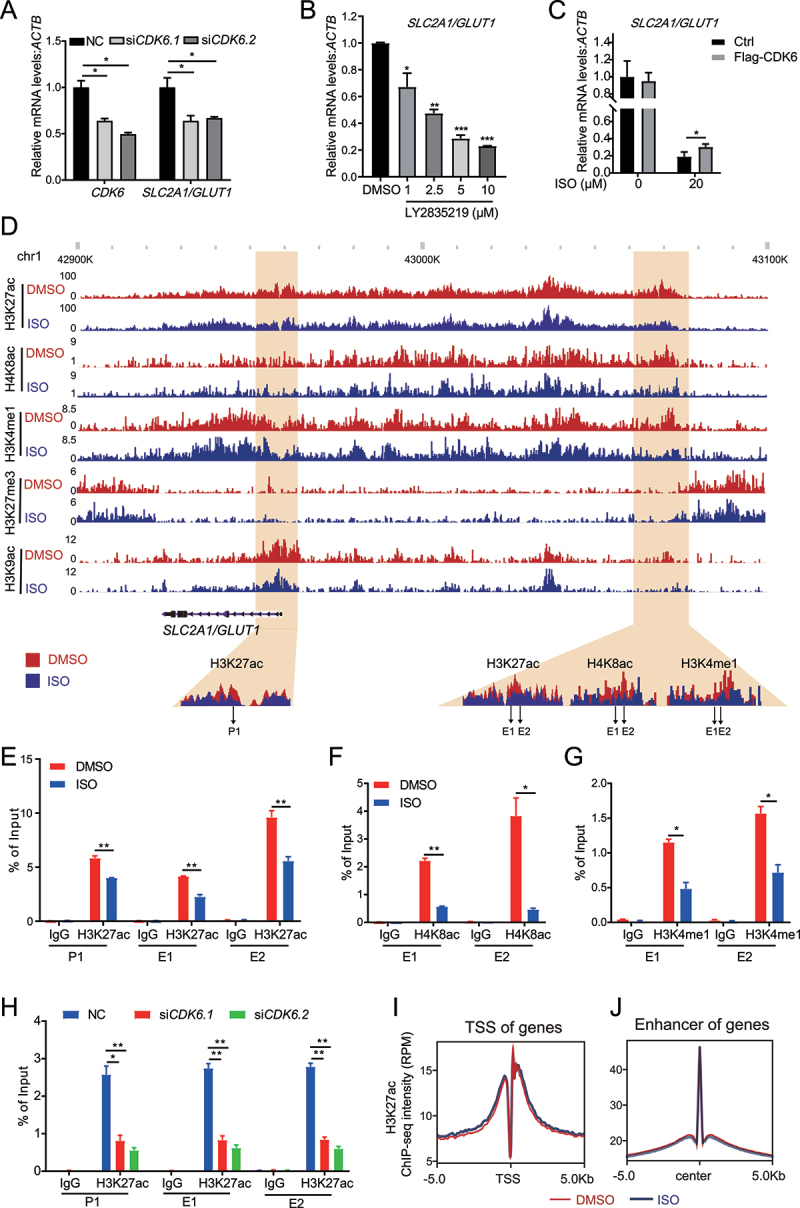
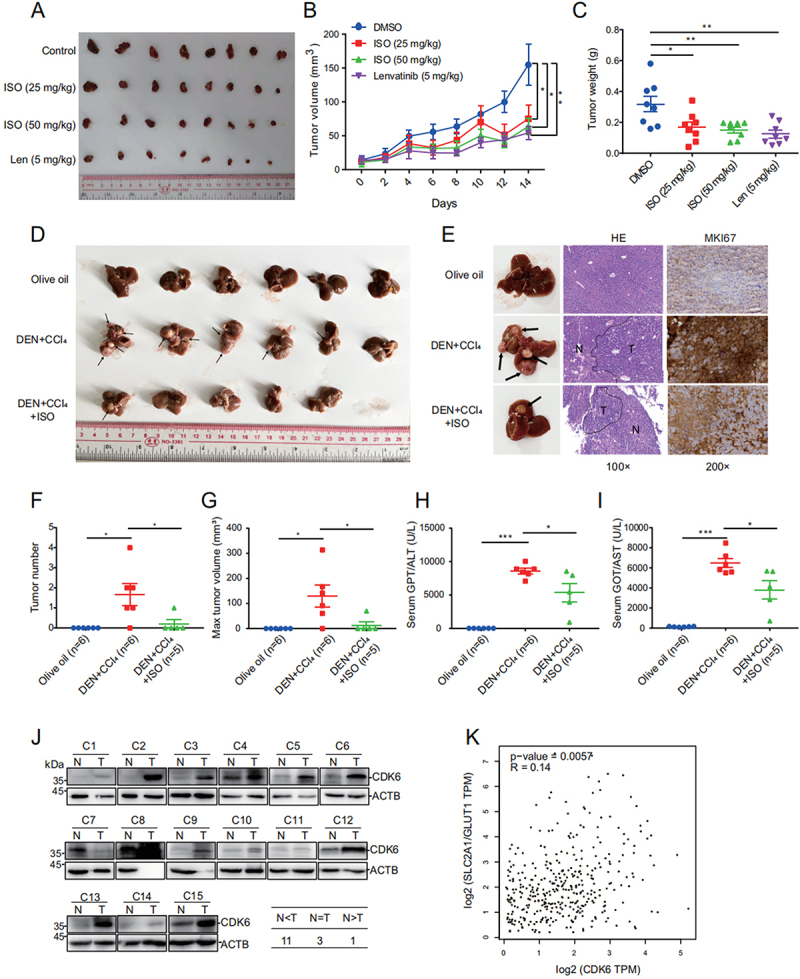
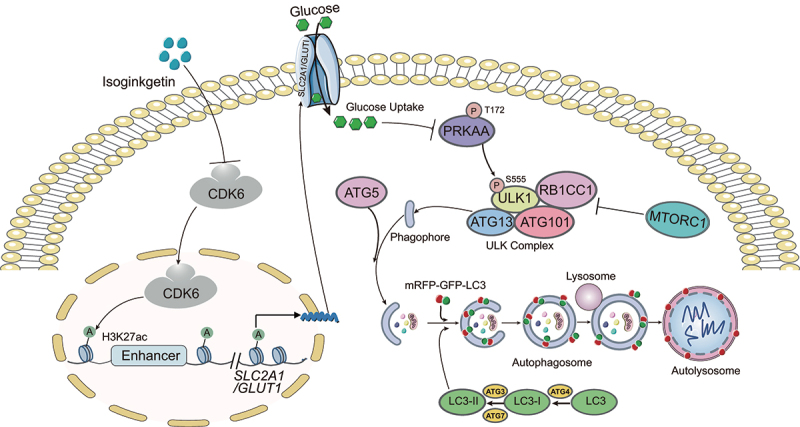
Isoginkgetin (ISO), a natural biflavonoid, exhibited cytotoxic activity against several types of cancer cells. However, its effects on hepatocellular carcinoma (HCC) cells and mechanism remain unclear. Here, we revealed that ISO effectively inhibited HCC cell proliferation and migration in vitro. LC3-II expression and autophagosomes were increased under ISO treatment. In addition, ISO-induced cell death was attenuated by treatment with chloroquine or knockdown of autophagy-related genes (ATG5 or ULK1). ISO significantly suppressed SLC2A1/GLUT1 (solute carrier family 2 member 1) expression and glucose uptake, leading to activation of the AMPK-ULK1 axis in HepG2 cells. Overexpression of SLC2A1/GLUT1 abrogated ISO-induced autophagy. Combining molecular docking with thermal shift analysis, we confirmed that ISO directly bound to the N terminus of CDK6 (cyclin-dependent kinase 6) and promoted its degradation. Overexpression of CDK6 abrogated ISO-induced inhibition of SLC2A1/GLUT1 transcription and induction of autophagy. Furthermore, ISO treatment significantly decreased the H3K27ac, H4K8ac and H3K4me1 levels on the SLC2A1/GLUT1 enhancer in HepG2 cells. Finally, ISO suppressed the hepatocarcinogenesis in the HepG2 xenograft mice and the diethylnitrosamine+carbon tetrachloride (DEN+CCl4)-induced primary HCC mice and we confirmed SLC2A1/GLUT1 and CDK6 as promising oncogenes in HCC by analysis of TCGA data and human HCC tissues. Our results provide a new molecular mechanism by which ISO treatment or CDK6 deletion promotes autophagy; that is, ISO targeting the N terminus of CDK6 for degradation inhibits the expression of SLC2A1/GLUT1 by decreasing the enhancer activity of SLC2A1/GLUT1, resulting in decreased glucose levels and inducing the AMPK-ULK1 pathway.

Keywords: Autophagy; CDK6; SLC2A1/GLUT1; hepatocellular carcinoma; isoginkgetin.


Conflict of interest statement

No potential conflict of interest was reported by the author(s).

Figures

Figure 1.
Figure 1.
Isoginkgetin represses liver cancer cell growth. (A) Chemical structure of ISO. (B and C) Cells were exposed to ISO at the indicated doses for 24 h (B) and 48 h (C), and the dose-escalation effects of ISO were assessed by CCK-8 assays. (D) HepG2 cells were treated with ISO and CQ at the indicated doses for 48 h, and cell viability was measured with the CCK-8 assay. (E) HepG2 cells were treated with ISO, ferrostatin-1 (Fer-1) and RSL3 at the indicated doses for 48 h, and cell viability was measured with the CCK-8 assay. (F) HepG2 cells were treated with ISO, Z-VAD, and CPT-11 at the indicated doses for 48 h, and cell viability was measured with the CCK-8 assay. **p value ≤0.01, ***p value ≤0.001 (t-test). Histograms are presented as the mean ± s.D. Of three biological replicates.
Figure 2.
Figure 2.
Isoginkgetin induces cytotoxic autophagy in liver cancer cells. (A and B) HepG2 cells were treated with ISO at the indicated doses for 24 h (A) or treated with ISO (20 μM) for the indicated time periods (B). ISO induces autophagosome formation in HepG2 cells in a dose-dependent and time-dependent manner, as revealed by western blotting. Quantifications are shown below. (C) HepG2 cells stably transfected with mRFP-GFP-LC3B plasmid were treated with PBS, 0.05% DMSO, 20 μM ISO and 10 μM CQ respectively for 24 h, fixed and subjected to confocal microscopy. Scale bar: 10 μm. 50 cells were imaged and the numbers of yellow LC3B and red LC3B dots per cell in each condition were quantified. (D) HepG2 cells were treated with ISO (20 μM) for 24 h, fixed and examined using transmission electron microscopy. Higher power magnification of the cell images revealed autophagosomes or autolysosome (arrows). Scale bar: 1 μm. (E) HepG2 cells were treated with 20 μM ISO together with 10 μM CQ for 24 h, and the protein levels of LC3 were assessed by western blotting. ImageJ densitometric analysis of the LC3-II:GAPDH ratio from LC3 immunoblots is shown below. (F and H) ULK1 and ATG5 were stably knocked down in HepG2 cells using CRISPR/Cas9. Wild-type (WT), ULK1 knockdown (ULK1 KD) and ATG5 knockdown (ATG5 KD) HepG2 cells were treated with 20 μM ISO for 24 h, and cell lysates were immunoblotted with the indicated antibodies. (G and I) WT, ULK1 KD and ATG5 KD cells were treated with 20 μM ISO for 48 h, and cell viability was assessed by CCK-8 assays. (J) WT, ULK1 KD and ATG5 KD cells were treated with 20 μM ISO for 24 h and then subjected to confocal microscopy using an LC3A/B antibody. Scale bar: 10 μm. *p value ≤0.05, **p value ≤0.01, ***p value ≤0.001 (t-test). Histograms are presented as the mean ± s.D. Of three biological replicates.
Figure 3.
Figure 3.
SLC2A1/GLUT1 plays an important role in isoginkgetin-mediated cytotoxic autophagy. (A) HepG2 cells were treated with 20 μM ISO for 24 h, and RNA-seq was performed. The top 7 enriched GO biological processes and KEGG pathway enrichment analysis of ISO-repressed DEGs. (B) Volcano plot displaying 1253 genes with upregulated and 1488 with downregulated expression after ISO treatment compared to DMSO treatment. (C) HepG2 cells were treated with ISO at the indicated doses for 24 h. The expression of SLC2A1/GLUT1, SLC2A2/GLUT2, SLC2A3/GLUT3, SLC2A4/GLUT4 and SLC5A9/SGLT4 was determined by qRT-PCR. (D) Fluorescent images show 2-NBDG uptake after treatment with 20 μM ISO for 24 h in HepG2 cells. More than 300 cells were analyzed and quantified for each treatment. Quantifications were shown below. (E) HepG2 cells were exposed to ISO at the indicated doses for 24 h, and cell lysates were immunoblotted with the indicated antibodies. (F) HepG2 cells were transfected with two different siRnas targeting SLC2A1/GLUT1 for 48 h, and cell lysates were immunoblotted with the indicated antibodies. (G) HepG2 cells stably transfected with Flag-SLC2A1/GLUT1 were treated with 20 μM ISO for 24 h and stained with the indicated antibodies. Scale bar: 10 μm. More than 50 cells were analyzed and quantified for each treatment. Quantifications were shown below. (H) HepG2 control (Ctrl) and stable Flag-SLC2A1/GLUT1-expressing (Flag-SLC2A1/GLUT1) cells were treated with 20 μM ISO for 24 h, and the expression of LC3 was determined by western blotting. (I) HepG2 control (Ctrl) and stable Flag-SLC2A1/GLUT1-expressing (Flag-SLC2A1/GLUT1) cells were treated with 20 μM ISO for 48 h, and cell viability was assessed by CCK-8 assays. *p value ≤0.05, **p value ≤0.01, ***p value ≤0.001 (t-test). Histograms are presented as the mean ± s.D. Of three biological replicates.
Figure 4.
Figure 4.
Isoginkgetin induces autophagy by targeting CDK6. (A) Structural overview of the CDK6 protein and its three truncations. (B) Binding pose of ISO in complex with CDK6 generated by induced-fit docking. Below, details of the interaction. ISO is shown as pink sticks, and protein is shown as a gray cartoon with key residues highlighted in sticks. Dashed lines represent hydrogen bonds. (C) in vitro binding of ISO to wild-type GST-CDK6 as determined by thermal shift assays. (D) in vitro binding of ISO to GST-CDK6 truncations as determined by thermal shift assays. (E and F) HepG2 cells were treated with ISO at the indicated doses for 24 h (E) or treated with ISO (20 μM) for the indicated time periods (F), and cell lysates were immunoblotted with the indicated antibodies. (G) HepG2 cells were treated with ISO at the indicated doses for 24 h, and the expression of CDK6 was determined by qRT-PCR. (H) HepG2 cells were treated with DMSO alone, 20 μM ISO alone for 24 h, or pretreated with DMSO or ISO for 20 h, followed by the addition of 10 μM MG132 for an additional 4 h. Cell lysates were harvested and subjected to western blotting with the indicated antibodies. (I) HepG2 cells were transfected with two different siRnas targeting CDK6 for 48 h. Cell lysates were harvested and subjected to western blotting with the indicated antibodies. (J) HepG2 cells transiently transfected with Flag-CDK6 were treated with 20 μM ISO for 24 h and stained with the indicated antibodies. Scale bar: 10 μm. (K and L) HepG2 cells were prepared as described in 4J. Cell lysates were harvested and subjected to western blotting with the indicated antibodies (K), and cell viability was measured with the CCK-8 assay (L). ns >0.05, ***p value ≤0.001 (t-test). Histograms are presented as the mean ± s.D. Of three biological replicates.
Figure 5.
Figure 5.
Targeting CDK6 represses enhancer activation of SLC2A1/GLUT1. (A) HepG2 cells were transfected with two different siRnas targeting CDK6 for 48 h, and the expression of SLC2A1/GLUT1 was determined by qRT-PCR. (B) HepG2 cells were treated with LY2835219 at the indicated doses for 24 h, and the expression of SLC2A1/GLUT1 was determined by qRT-PCR. (C) HepG2 cells were prepared as described in 4J, and the expression of SLC2A1/GLUT1 was determined by qRT-PCR. (D) the Wash U epigenome browser view shows H3K27ac, H4K8ac, H3K4me1, H3K27me3 and H3K9ac enrichment around SLC2A1/GLUT1 after 20 μM ISO treatment for 24 h. The primer sets for qPCR are indicated using the arrow at the bottom. (E-G) ChIP analysis shows H3K27ac (E), H4K8ac (F) and H3K4me1 (G) enrichment on SLC2A1/GLUT1 enhancers after 20 μM ISO treatment for 24 h. (H) HepG2 cells were prepared as in 4I. ChIP analysis shows H3K27ac enrichment on SLC2A1/GLUT1 enhancers. (I) Metagene plot representation of the mean H3K27ac ChIP-seq density across TSSs. Metagene analysis is centered on TSS regions. (J) Metagene plot representation of the mean H3K27ac ChIP-seq density across enhancers. Metagene plot is centered on the enhancer regions. *p value ≤0.05, **p value ≤0.01, ***p value ≤0.001 (t-test). Histograms are presented as the mean ± s.D. Of three biological replicates.
Figure 6.
Figure 6.
Isoginkgetin inhibits liver cancer growth and angiogenesis in vivo. (A-C) HepG2 cells were injected into nude mice. When tumors reached a size of 10 mm3, mice were treated daily for 14 days with the indicated concentration of ISO. Tumors were imaged (A), and growth curves (B) and tumor weights (C) are shown as the mean ± SEM of eight mice in each group. (D) Liver image in DEN+CCl4-induced HCC mice, black arrows indicate tumors in liver. (E) Representative images of livers, hematoxylin-eosin (HE) staining images of livers and MKI67/Ki67 staining in liver. Black-dotted lines indicate the boundary of normal tissues and tumor tissues. N, normal tissue; T, tumor tissue. (F and G) Quantification of total tumor numbers and the max tumor volume. (H and I) Serum levels of GPT/ALT and GOT/AST. (J) CDK6 protein levels in 15 pairs of HCC tumor and adjacent nontumor tissues detected by western blotting. (K) the correlation of CDK6 and SLC2A1/GLUT1 in liver cancer tissues was analyzed by an interactive web portal, GEPIA (http://gepia.Cancer-pku.Cn). Data are presented as the mean ± SEM. *p value ≤0.05, **p value ≤0.01, ***p value ≤0.001 (t-test.
Figure 7.
Figure 7.
Schematic illustration of ISO-induced cytotoxic autophagy in HepG2 cells. ISO induces cytotoxic autophagy through the CDK6-SLC2A1/GLUT1-PRKAA-ULK1 signaling pathway in HepG2 cells. Briefly, ISO targeting CDK6 for degradation inhibits the expression of SLC2A1/GLUT1 by decreasing the enhancer activity of SLC2A1/GLUT1, resulting in decreased glucose and inducing the AMPK-ULK1 pathway. The activated AMPK-ULK1 pathway further induced autophagy.

Similar articles

Cited by

References

    1. Villanueva A, Longo DL.. Hepatocellular Carcinoma. N Engl J Med. 2019;380(15):1450–1462. 10.1056/NEJMra1713263 - DOI - PubMed
    1. Sung H, Ferlay J, Siegel RL, et al. Global cancer statistics 2020: gLOBOCAN estimates of incidence and mortality worldwide for 36 cancers in 185 countries. CA Cancer J Clin. 2021;71(3):209–249. 10.3322/caac.21660 - DOI - PubMed
    1. . European Association For The Study Of The Liver, European Organisation For Research And Treatment Of Cancer EASL-EORTC clinical practice guidelines: management of hepatocellular carcinoma. J Hepatol. 2012;56(4):908–943. 10.1016/j.jhep.2011.12.001. - DOI - PubMed
    1. Kudo M, Finn RS, Qin S, et al. Lenvatinib versus sorafenib in first-line treatment of patients with unresectable hepatocellular carcinoma: a randomised phase 3 non-inferiority trial. Lancet. 2018;391(10126):1163–1173. 10.1016/S0140-6736(18)30207-1 - DOI - PubMed
    1. Mizushima N, Komatsu M. Autophagy: renovation of cells and tissues. Cell. 2011;147(4):728–741. 10.1016/j.cell.2011.10.026 - DOI - PubMed

Publication types

MeSH terms