. 2022 Sep 1;17(9):e0271886.
doi: 10.1371/journal.pone.0271886. eCollection 2022.

Estimation of Ebola's spillover infection exposure in Sierra Leone based on sociodemographic and economic factors

Affiliations

Estimation of Ebola's spillover infection exposure in Sierra Leone based on sociodemographic and economic factors

Sena Mursel et al. PLoS One. .

Abstract

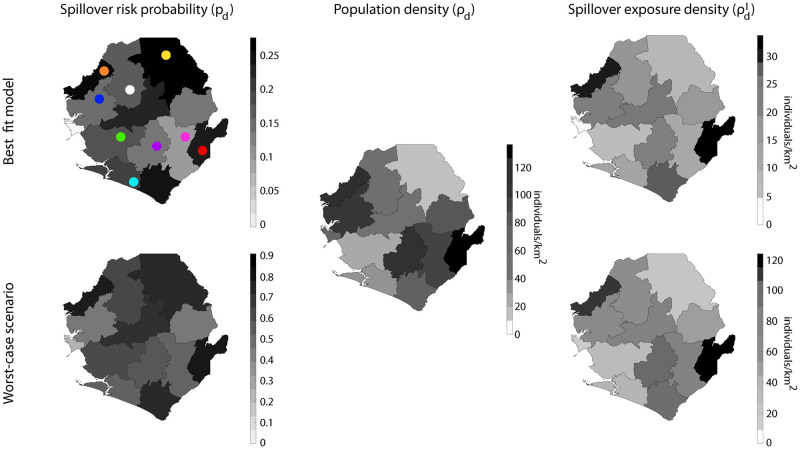
Zoonotic diseases spread through pathogens-infected animal carriers. In the case of Ebola Virus Disease (EVD), evidence supports that the main carriers are fruit bats and non-human primates. Further, EVD spread is a multi-factorial problem that depends on sociodemographic and economic (SDE) factors. Here we inquire into this phenomenon and aim at determining, quantitatively, the Ebola spillover infection exposure map and try to link it to SDE factors. To that end, we designed and conducted a survey in Sierra Leone and implement a pipeline to analyze data using regression and machine learning techniques. Our methodology is able (1) to identify the features that are best predictors of an individual's tendency to partake in behaviors that can expose them to Ebola infection, (2) to develop a predictive model about the spillover risk statistics that can be calibrated for different regions and future times, and (3) to compute a spillover exposure map for Sierra Leone. Our results and conclusions are relevant to identify the regions in Sierra Leone at risk of EVD spillover and, consequently, to design and implement policies for an effective deployment of resources (e.g., drug supplies) and other preventative measures (e.g., educational campaigns).


Conflict of interest statement

The authors have declared that no competing interests exist.

Figures

Fig 1
Fig 1. Methodological pipeline.
We designed a survey that combines questions about behavioral practices that could expose individuals to Ebola infection and questions to measure sociodemographic and economic (SDE) factors. The survey was administered in Sierra Leone in the Bombali rural region. We analyzed our data by different means and developed a regression model that measures the spillover risk probability as a function of a number of SDE features. Once the model was calibrated, we extrapolated the results at the national level using surveyed data from Statistics Sierra Leone (SSL) to generate the infection spillover exposure map.
Fig 2
Fig 2. Survey locations in Sierra Leone.
The survey was conducted in the district of Bombali over a period of three weeks. Ten different locations (red dots) were selected to obtain a representative sample of the population in rural areas of the country.
Fig 3
Fig 3. Comparison of the distributions in rural areas between our survey (Bombali district), SLIHS 2018 in rural areas at the country level, and SLIHS 2018 in the Bombali district.
From top to bottom and from left to right: education level, relative income, cell phone ownership, gender, work environment, water acquisition method, internet use, and boxplot of age (median: central red line; bottom and top box edges: 25th and 75th percentiles, respectively; outliers: plus symbols).
Fig 4
Fig 4
A: AIC values as a function of the number of variables (features). Either starting from a null model and increasing the number of features (forward stepwise logistic regression) or from a complete model and decreasing the number of features (backward stepwise logistic regression), we consistently found that a model with six variables shows a global minimum for AIC (minimum prediction error). B: Graphical representation of the logistic regression coefficients. Magnitude of the βi coefficients (normalized to the maximum) and their sign (positive/negative: red/green). The selected features balance SDE factors that increase or decrease the spillover risk. C: Graphical representation of the correlation matrix among variables. Our analysis indicates that there is no significant correlation among variables (red text stand for the selected features in the logistic regression).
Fig 5
Fig 5
A: Box plot of the accuracy of the logistic model. The accuracy, measured as the fraction of correctly predicted spillover risk, is 0.657±0.07. In the plot the wide black line indicates the median. The box delimits the (25%, 75%) percentile interval, and the whiskers represent the minimum and maximum values (no outliers were present in this case). The accuracy analysis was performed repeating a 10-fold cross validation three times (see text). B: Predicted versus observed spillover risk scores. The green dotted line is the expected behavior of a perfect classifier and the circles represent the results obtained from our model (see text). The black dotted line is the linear fitting of the points. C: ROC curve. As a function of the classifier threshold (color scale) the true versus false positive rate is plotted. The model deviates clearly from a random classifier (red dotted line). Analyses with a threshold larger/smaller than 0.73/0.02 accumulate in top left/bottom right corner of the plot.
Fig 6
Fig 6. Estimation of the infection spillover map in Sierra Leone by districts.
From left to right the figure shows the spillover risk probability (pd), the population density (ρd), and the infection spillover exposure (ρdI) respectively. In the case of pd and ρd the maps showed on the top stand for the cases of the best fit logistic model and on the bottom the worst-case scenario (see text). District color codes (as shown on top left): Bo (purple), Bombali (white), Bonthe (cyan), Kailahum (red), Kambia (orange), Kenema (pink), Koinadugu (yellow), Moyanba (green), and Port Loko (blue).

Similar articles

Cited by

References

    1. Muñoz-Fontela C, McElroy AK. In: Mühlberger E, Hensley LL, Towner JS, editors. Ebola Virus Disease in Humans: Pathophysiology and Immunity. Cham: Springer International Publishing; 2017. p. 141–169. - PMC - PubMed
    1. Jacob ST, Crozier I, Fischer WA, Hewlett A, Kraft CS, de La Vega MA, et al.. Ebola virus disease. Nature reviews Disease primers. 2020;6(1):1–31. doi: 10.1038/s41572-020-0147-3 - DOI - PMC - PubMed
    1. Chippaux JP. Outbreaks of Ebola virus disease in Africa: the beginnings of a tragic saga. Journal of venomous animals and toxins including tropical diseases. 2014;20:02–14. doi: 10.1186/1678-9199-20-44 - DOI - PMC - PubMed
    1. Iliyasu G, Ogoina D, Otu AA, Dayyab FM, Ebenso B, Otokpa D, et al.. A Multi-Site Knowledge Attitude and Practice Survey of Ebola Virus Disease in Nigeria. PLOS ONE. 2015;10:e0135955. doi: 10.1371/journal.pone.0135955 - DOI - PMC - PubMed
    1. Feldman H, Jones S, Klenk HD, Schnittler HJ. Ebola virus: from discovery to vaccine. Nature Reviews Immunology. 2003;3:677–685. doi: 10.1038/nri1154 - DOI - PubMed

Publication types