

Genetic diversity and population structure of wild and cultivated Crotalaria species based on genotyping-by-sequencing
- PMID: 36048841
- PMCID: PMC9436042
- DOI: 10.1371/journal.pone.0272955
Genetic diversity and population structure of wild and cultivated Crotalaria species based on genotyping-by-sequencing
Abstract
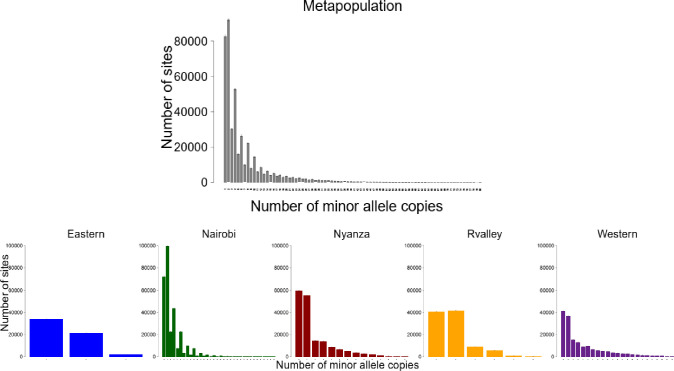
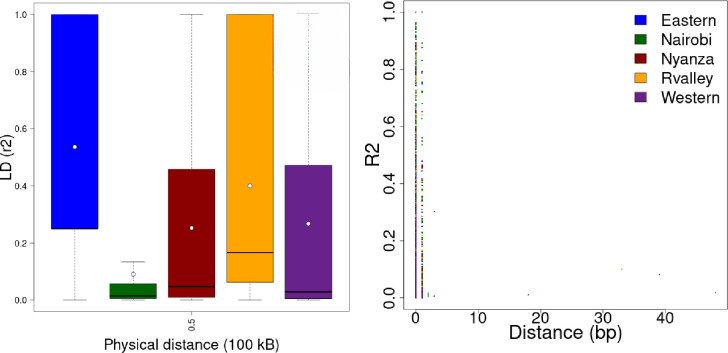
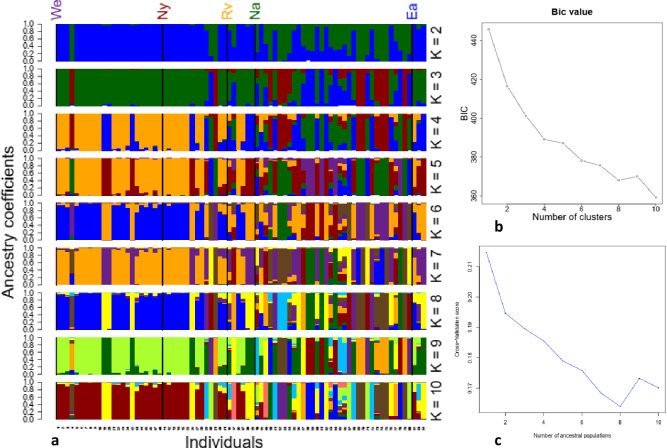
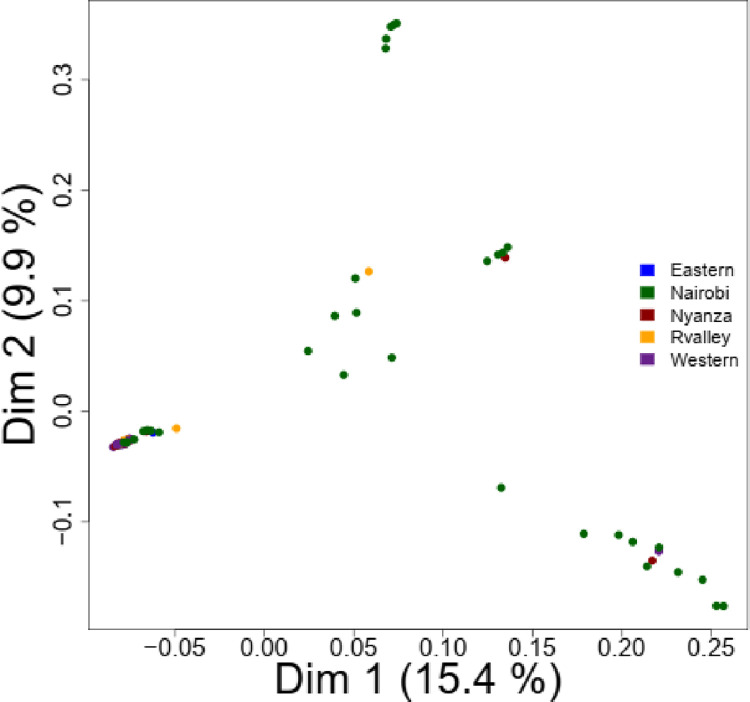
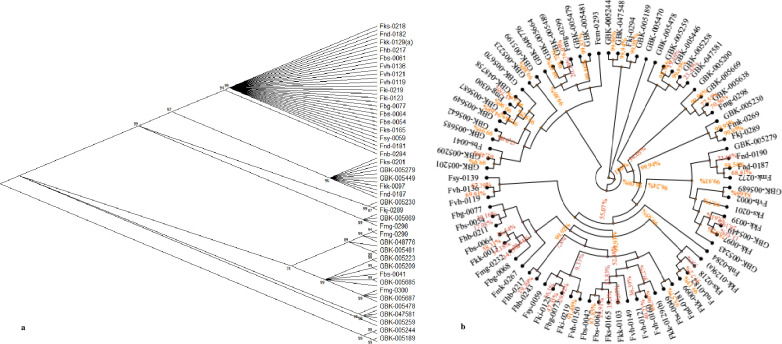
Crotalaria is a plant genus that is found all over the world, with over 700 species of herbs and shrubs. The species are potential alternative food and industrial crops due to their adaptability to different environments. Currently, information on the genetic diversity and population structure of these species is scanty. Genotyping-by-sequencing (GBS) is a cost-effective high-throughput technique in diversity evaluation of plant species that have not been fully sequenced. In the current study, de novo GBS was used to characterize 80 Crotalaria accessions from five geographical regions in Kenya. A total of 9820 single nucleotide polymorphism (SNP) markers were obtained after thinning and filtering, which were then used for the analysis of genetic diversity and population structure in Crotalaria. The proportion of SNPs with a minor allele frequency (maf) > = 0.05 was 45.08%, while the Guanine-Cytosine (GC) content was 0.45, from an average sequence depth of 455,909 reads per base. The transition vs transversion ratio was 1.81 and Heterozygosity (He) ranged between 0.01-0.07 in all the sites and 0.04 to 0.52 in the segregating sites. The mean Tajima's D value for the population was -0.094, suggesting an excess of rare alleles. The fixation index (Fst) between the different populations based on the Wright Fst (1943) ranged from 0.0119 to 0.066 for the Eastern-Western and Nairobi-Western populations. Model based techniques of population structure analysis including structure, k-means and cross-entropy depicted eight clusters in the study accessions. Non-model based techniques especially DAPC depicted poor population stratification. Correspondence Analysis (CA), Principal coordinate analyses (PCoA) and phylogenetic analysis identified a moderate level of population stratification. Results from this study will help conservationists and breeders understand the genetic diversity of Crotalaria. The study also provides valuable information for genetic improvement of domesticated species.
Conflict of interest statement
Author George N. Michuki is an employee of Africa Genomics Center and Consultancy, a commercial entity that is based in Nairobi, Kenya. The entity provides NGS sequencing and bioinformatic support. Sequencing in this study was done in Hong Kong at BGI Tech Solutions Ltd with knowledge and consent from all authors. The remaining authors declare that the research was conducted in the absence of any commercial or financial relationships that could be construed as a potential conflict of interest.
Figures
References
-
- Marianne le Roux M, Boatwright JS, van Wyk BE. A global infrageneric classification system for the genus Crotalaria (Leguminosae) based on molecular and morphological evidence. Taxon. 2013;62(5):957–71.
-
- Muli JK, Neondo JO, Kamau PK, Budambula NLM. Genetic diversity and use of African indigenous vegetables especially slender leaf. International Journal of Vegetable Science. Taylor & Francis; 2020. p. 1–19. Available from: 10.1080/19315260.2020.1829768 - DOI
-
- FAO. FAO, The Future of Food and Agriculture: Trends and Challenges. Food and Agriculture Organization of the United Nations. 2017. Available from: www.fao.org/publications
-
- Satya P, Banerjee R, Karan M, Mukhopadhyay E, Chaudhary B, Bera A, et al.. Insight into genetic relation and diversity of cultivated and semi-domesticated under-utilized Crotalaria species gained using start codon targeted (SCoT) markers. Biochem Syst Ecol. 2016;66:24–32.
Publication types
MeSH terms
LinkOut - more resources
Full Text Sources
Miscellaneous
