. 2022 Sep 19;35(9):1467-1481.
doi: 10.1021/acs.chemrestox.2c00057. Epub 2022 Sep 1.

Cytochromes P450 2C8 and 3A Catalyze the Metabolic Activation of the Tyrosine Kinase Inhibitor Masitinib

Affiliations

Cytochromes P450 2C8 and 3A Catalyze the Metabolic Activation of the Tyrosine Kinase Inhibitor Masitinib

Bethany D Latham et al. Chem Res Toxicol. .

Abstract

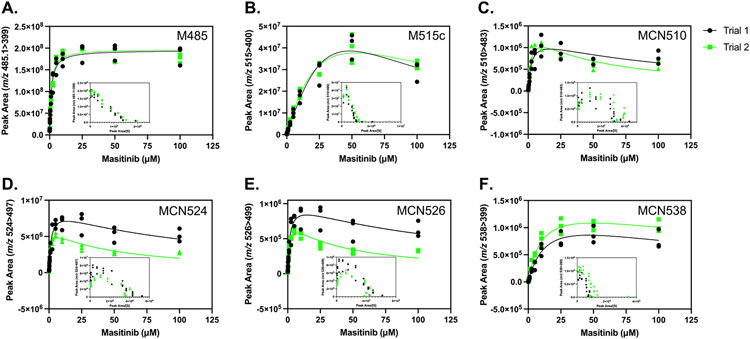
Masitinib is a small molecule tyrosine kinase inhibitor under investigation for the treatment of amyotrophic lateral sclerosis, mastocytosis, and COVID-19. Hepatotoxicity has been reported in some patients while taking masitinib. The liver injury is thought to involve hepatic metabolism of masitinib by cytochrome P450 (P450) enzymes to form chemically reactive, potentially toxic metabolites. The goal of the current investigation was to determine the P450 enzymes involved in the metabolic activation of masitinib in vitro. In initial studies, masitinib (30 μM) was incubated with pooled human liver microsomes in the presence of NADPH and potassium cyanide to trap reactive iminium ion metabolites as cyano adducts. Masitinib metabolites and cyano adducts were analyzed using reversed-phase liquid chromatography-tandem mass spectrometry. The primary active metabolite, N-desmethyl masitinib (M485), and several oxygenated metabolites were detected along with four reactive metabolite cyano adducts (MCN510, MCN524, MCN526, and MCN538). To determine which P450 enzymes were involved in metabolite formation, reaction phenotyping experiments were conducted by incubation of masitinib (2 μM) with a panel of recombinant human P450 enzymes and by incubation of masitinib with human liver microsomes in the presence of P450-selective chemical inhibitors. In addition, enzyme kinetic assays were conducted to determine the relative kinetic parameters (apparent Km and Vmax) of masitinib metabolism and cyano adduct formation. Integrated analysis of the results from these experiments indicates that masitinib metabolic activation is catalyzed primarily by P450 3A4 and 2C8, with minor contributions from P450 3A5 and 2D6. These findings provide further insight into the pathways involved in the generation of reactive, potentially toxic metabolites of masitinib. Future studies are needed to evaluate the impact of masitinib metabolism on the toxicity of the drug in vivo.

Trial registration: ClinicalTrials.gov NCT03127267 NCT04333108 NCT05441488 NCT05047783 NCT04622865 NCT05449444.


Figures

Figure 1.
Figure 1.
Masitinib metabolite formation by recombinant P450 enzymes: (A) M485, (B) M515c, (C) MCN510, (D) MCN524, (E) MCN526, and (F) MCN538. Masitinib (2 μM) was incubated with a panel of recombinant human P450 Supersomes (20 nM) and potassium cyanide (KCN 1 mM) in the presence of an NADPH regenerating system for 15 min. Masitinib metabolites were analyzed by LC–MS/MS analysis utilizing MRM. The MRM peak areas are shown for each metabolite. The results are shown from two independent experiments (trials 1 and 2) performed in triplicate each. The bar shown is the grand mean, and data points are the individual values from each replicate.
Figure 2.
Figure 2.
Effect of time-dependent P450 inhibitors on masitinib metabolite formation: (A) M485, (B) M515c, (C) MCN510, (D) MCN524, (E) MCN526, and (F) MCN538. Masitinib (2 μM) was incubated with pooled HLM (0.1 mg/mL) and KCN (1 mM) following preincubation in the presence or absence of time-dependent P450-selective chemical inhibitors. The following chemical inhibitors were used to block the respective P450: gemfibrozil O-β-glucuronide, Gem-O-Gluc (64 μM, P450 2C8, 30 min preincubation), furafylline (25 μM, P450 1A2, 10 min preincubation), ketoconazole (1 μM, P450 3A), and CYP3cide (2 μM, P450 3A4, 5 min preincubation). Control incubations were carried out with the appropriate vehicle solvent control in the absence of an inhibitor. Relative levels of metabolite formed were measured by LC–MS/MS. Percent (%) metabolite formation was based on comparison to vehicle control. The results are from two independent experiments performed in triplicate (n = 3 per experiment). The bar shown is the grand mean, and data points are the individual values from each replicate. Outliers were removed based on Grubbs’ outlier test (α = 0.05) using GraphPad Prism 9.0 software. Comparisons of inhibitor vs vehicle control were performed by the unpaired two-tailed t test (GraphPad Prism 9.0 Software). *P < 0.05, **P < 0.01, ***P < 0.001, and ****P < 0.0001.
Figure 3.
Figure 3.
Effect of P450 inhibitors on masitinib metabolite formation: (A) M485, (B) M515c, (C) MCN510, (D) MCN526, (E) MCN524, and (F) MCN538. Masitinib (2 μM) was incubated with pooled HLM (0.25 mg/mL) supplemented with NADPH and KCN (1 mM) in the presence or absence of P450-selective chemical inhibitors to block the respective P450 enzymes. (See the Experiments Section for details). Control incubations were conducted with the vehicle solvent control in the absence of an inhibitor. Relative levels of metabolites formed were measured by LC–MS/MS. Percent (%) metabolite formation was based on comparison to vehicle control. The results are from two independent experiments performed in triplicate (n = 3). The bar shown is the grand mean, and data points are the individual values from each replicate. Outliers were removed based on Grubbs’ outlier test (α = 0.05) using GraphPad Prism 9 software. Comparisons of inhibitor vs vehicle control were performed by the unpaired two-tailed t test. *P < 0.05, **P < 0.01, ***P < 0.001, and ****P < 0.0001.
Figure 4.
Figure 4.
Kinetic analysis of masitinib metabolite formation in pooled HLM: (A) M485, (B) M515c, (C) MCN510, (D) MCN524, (E) MCN526, and (F) MCN538. Masitinib (0.05, 0.1, 0.25, 0.5, 1, 2.5, 5, 10, 25, 50, and 100 μM) was incubated with pooled HLM (0.25 mg/mL) supplemented with NADPH and potassium cyanide (KCN 1 mM). Relative levels of metabolites formed were measured by LC–MS/MS. The results shown are from two independent experiments (trials 1 and 2) conducted in triplicate each (n = 3). Data points shown are from individual replicates. Data were graphed as peak area versus substrate concentration [S] (A–F) and using the Eadie–Hofstee transformation as peak area versus peak area/[S] (inset A–F). Based on comparison of kinetic model fits using the corrected Akaike’s information criterion (AICc) method in GraphPad Prism 9.0 software, the Michaelis–Menten model was selected as the preferred model for M485 (A), and substrate inhibition was the preferred model for M515c, MCN510, MCN524, MCN526, and MCN538 (B–F). Therefore, data for (A) were fit to the Michaelis–Menten model, and data for (B–F) were fit to the substrate inhibition model using nonlinear regression analysis with GraphPad Prism 9.0 software.
Figure 5.
Figure 5.
Timedependent inactivation of P450 3A by (A) imatinib and (B–C) masitinib. Pooled HLM (0.3 mg protein/mL) were preincubated with imatinib (2, 10 μM), masitinib (2, 15, 30 μM), or vehicle control (1:9 DMSO/acetonitrile) for 0, 5, 15, and 30 min in the presence and absence of the NADPH regenerating system, respectively. Following each time point, the preincubation mixture was diluted 10-fold into a secondary reaction containing midazolam (10 μM) and the NADPH regenerating system to evaluate the remaining P450 3A activity. Data are graphed as the natural logarithm of percentage (%) remaining P450 3A activity normalized to 0 min preincubation with vehicle + NADPH. Preincubations with 30 μM masitinib are graphed separately for clarity. The results shown are from two independent experiments conducted in triplicate each (n = 3). Data were graphed using simple linear regression with GraphPad Prism 9 software.
Figure 6.
Figure 6.
Time-, concentration-, and NADPH-dependent inactivation of P450 3A by masitinib. Pooled HLM (0.3 mg protein/mL) were preincubated with masitinib (2.5, 5, 12.5, 25, and 50 μM) or vehicle control (1:9 DMSO/acetonitrile) for 0, 5, 10, 20, and 30 min in the presence and absence of the NADPH regenerating system. Following each time point, the preincubation mixture was diluted 10-fold into a secondary reaction containing P450 3A probe substrate midazolam (10 μM) and the NADPH regenerating system to evaluate the remaining P450 3A activity. Data are graphed as the natural logarithm of percentage (%) remaining P450 3A activity normalized to 0 min preincubation with vehicle + NADPH (A) or without NADPH (B). The results shown are the mean ± SD from two independent experiments conducted in triplicate each for preincubations + NADPH, and single replicates per experiment were conducted for preincubations minus (−) NADPH. Data were analyzed by simple linear regression using GraphPad Prism 9.0 to determine the slopes of the decline in P450 3A activity over time at each masitinib concentration. The slopes were used to estimate the observed inactivation rate (kobs), and kobs is plotted versus masitinib concentration (C).
Figure 7.
Figure 7.
Formation of putative lactam metabolite M499 in human liver S9. Masitinib (30 μM) was incubated at 37 °C for 60 min with human liver S9 (2 mg/mL) in potassium phosphate buffer (100 mM, pH 7.4) with or without AO inhibitor hydralazine (25 μM; 25 min preincubation) in the presence or absence of NADPH (2 mM). Formation of the putative lactam metabolite M499 was analyzed by LC–MS/MS using the MRM transition m/z 499 > 399 at retention time 4.75 min. The results shown are from a single experiment conducted in triplicate (mean ± SD).
Scheme 1.
Scheme 1.
Proposed Metabolic Pathway of Masitiniba aThe predicted primary oxidative metabolites are shown.
Scheme 2.
Scheme 2.
Proposed Metabolic Activation Pathway of Masitinib by Cytochrome P450 Enzymesa aThe metabolic scheme is based on pathways proposed by Amer et al. and Li et al. The enzymes indicated are based on the results described herein.

Similar articles

Cited by

References

    1. Dubreuil P; Letard S; Ciufolini M; Gros L; Humbert M; Casteran N; Borge L; Hajem B; Lermet A; Sippl W; Voisset E; Arock M; Auclair C; Leventhal PS; Mansfield CD; Moussy A; Hermine O Masitinib (AB1010), a potent and selective tyrosine kinase inhibitor targeting KIT. PLoS One 2009, 4, No. e7258. - PMC - PubMed
    1. Anastassiadis T; Deacon SW; Devarajan K; Ma H; Peterson JR Comprehensive assay of kinase catalytic activity reveals features of kinase inhibitor selectivity. Nat. Biotechnol 2011, 29, 1039–1045. - PMC - PubMed
    1. Mora JS; Genge A; Chio A; Estol CJ; Chaverri D; Hernández M; Marín S; Mascias J; Rodriguez GE; Povedano M; Paipa A; Dominguez R; Gamez J; Salvado M; Lunetta C; Ballario C; Riva N; Mandrioli J; Moussy A; Kinet JP; Auclair C; Dubreuil P; Arnold V; Mansfield CD; Hermine O; on behalf of the AB10015 STUDY GROUP. Masitinib as an add-on therapy to riluzole in patients with amyotrophic lateral sclerosis: a randomized clinical trial. Amyotroph. Lateral Scler. Frontotemporal Degener 2020, 21, 5–14. - PubMed
    1. Mora JS; Bradley WG; Chaverri D; Hernández-Barral M; Mascias J; Gamez J; Gargiulo-Monachelli GM; Moussy A; Mansfield CD; Hermine O; Ludolph AC Long-term survival analysis of masitinib in amyotrophic lateral sclerosis. Ther. Adv. Neurol. Disord 2021, 14, No. 17562864211030365. - PMC - PubMed
    1. Adenis A; Blay JY; Bui-Nguyen B; Bouché O; Bertucci F; Isambert N; Bompas E; Chaigneau L; Domont J; Ray-Coquard I; Blésius A; Van Tine BA; Bulusu VR; Dubreuil P; Mansfield CD; Acin Y; Moussy A; Hermine O; Le Cesne A Masitinib in advanced gastrointestinal stromal tumor (GIST) after failure of imatinib: a randomized controlled open-label trial. Ann. Oncol 2014, 25, 1762–1769. - PMC - PubMed

Publication types

Associated data