. 2022 Sep 20;119(38):e2209514119.
doi: 10.1073/pnas.2209514119. Epub 2022 Sep 1.

SARS-CoV-2 requires acidic pH to infect cells

Affiliations

SARS-CoV-2 requires acidic pH to infect cells

Alex J B Kreutzberger et al. Proc Natl Acad Sci U S A. .

Expression of concern in

Abstract

Severe acute respiratory syndrome coronavirus 2 (SARS-CoV-2) cell entry starts with membrane attachment and ends with spike (S) protein-catalyzed membrane fusion depending on two cleavage steps, namely, one usually by furin in producing cells and the second by TMPRSS2 on target cells. Endosomal cathepsins can carry out both. Using real-time three-dimensional single-virion tracking, we show that fusion and genome penetration require virion exposure to an acidic milieu of pH 6.2 to 6.8, even when furin and TMPRSS2 cleavages have occurred. We detect the sequential steps of S1-fragment dissociation, fusion, and content release from the cell surface in TMPRRS2-overexpressing cells only when exposed to acidic pH. We define a key role of an acidic environment for successful infection, found in endosomal compartments and at the surface of TMPRSS2-expressing cells in the acidic milieu of the nasal cavity.

Keywords: 3D imaging; SARS-CoV-2; infection route; live-cell imaging; virus entry.


Conflict of interest statement

Competing interest statement: T.K. is a member of the Medical Advisory Board of AI Therapeutics, Inc.

Figures
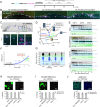
Fig. 1.
Fig. 1.
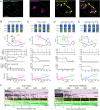
SARS-CoV-2 infection requires endocytosis. (A) Schematic of live-cell volumetric LLSM imaging experiments (BG) used to obtain 3D time series of VSV-eGFP-P-SARS-CoV-2-S-Atto 565 entry into Vero TMPRSS2 cells during early stages of infection using an MOI of 2. For each experiment, three cells were consecutively imaged volumetrically every 4.7 s for 10 min. (B) Maximum intensity projections showing fluorescently tagged VSV-SARS-CoV-2 within 1 μm in thickness optical sections from the first frame of the time series acquired for representative cells 1, 2, and 3. (C) Representative single-virion trajectories of VSV-eGFP-P-SARS-CoV-2-S-Atto 565 within a 1-μm optical slice of a time series acquired during the first 10-min of cell 1. Traces highlight particles at the cell surface (black) and within the cell volume after endocytosis (blue), in both cases containing colocalized eGFP-P and S-Atto 565; it also shows traces in the cytosol (green) containing eGFP-P upon its separation from the Atto565 signal (light blue). Single images highlighting these events are shown in the panels below. (D) Orthogonal projection of the traced event highlighted in C. (E) Representative summary of 266 virion traces analyzed during cell entry. Data from single coverslips (out of five) obtained per each cell type are shown. Vertical traces highlight the transfer of virions from the cell surface to the cell interior (assumed to be in endosomes because the colocalization of the eGFP-P with S-Atto 565 signals) or from endosomes to the cytosol (upon loss of colocalization of the eGFP-P and S-Atto 565 signals). Events corresponding to a step-wise loss of the S-Atto 565 signal at the cell surface are indicated (yellow). (F) Representative plot illustrating the MSD for the trajectory depicted in D when the particle is at the cell surface (black), in endosomes (blue), or in the cytosol upon separation of eGFP-P in the cytosol (green) from S-Atto565 that remains in endosomes (light blue). (G) Summary dot plot showing the diffusion mode (α) for 1,692 virion trajectories and corresponding 139 penetration events; all penetration events occurred from endosomes except for 1 event at the cell surface in a single Vero TMRSS2 cell. The plot highlights the confined motion (α < 0.80) of virions at the cell surface, trajected motion (α > 1.2) in endosomes, and Brownian motion (0.80 < α < 1.2) in the cytosol. (HJ) Effect of inhibition of endocytosis in the infection by VSV-eGFP-SARS-CoV-2 (H and I) or a human isolate of SARS-CoV-2 (J). Top panel shows examples of infection observed in representative fields of Vero TMPRSS2 overexpressing or not the dominant-negative dynamin K44A mutant or treated or not with 40 µM dynasore-OH. Images in the Top panels were obtained using spinning-disk confocal microscopy and show maximum intensity projections. Results from similar infections obtained with different cell types are shown in the Bottom panel. The difference of results between control conditions and inhibition of endocytosis by K44A dynamin overexpression or incubation with dynasore-OH incubation was statistically significant with a P value of <0.001 using an unpaired t test.
Fig. 2.
Fig. 2.
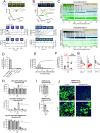
Endocytic entry routes of VSV-SARS-CoV-2. VSV-eGFP-P-SARS-CoV-2 was used to infect SVG-A gene edited to express early endosomal antigen 1 fused to the fluorescent protein Scarlet (EEA1-Scarlet) as an early endosomal marker and for late endosomal/lysosomal compartments a Halo-tagged version of the cholesterol transporter Niemann Pick C1 (NPC1-Halo) together with ectopic expression of ACE2 and TMPRSS2 and volumetrically imaged using LLSM according to Fig. 1. (A) Representative 2-µm projection from the first frame of the time series acquired 8 min after inoculation. (BE) Representative examples of single trajectories of VSV-eGFP-P-SARS-CoV-2 highlighting the extent of colocalization between eGFP-P and EEA1 or between eGFP-P and NPC-1 Halo labeled with JFX646 (Top panel), the orthogonal projection of the trajectory (Middle panel), and corresponding plots for the number of VSV particles on the spot and extent of colocalizations and MSD (Bottom panels). Additional examples are found in related SI Appendix, Figs. S11–S16. (F) Representative summary of results for 257 and 373 virion traces analyzed during cell entry from single coverslips (out of a total of five) plated with SVG-A ACE2 or SVG-A ACE2 TMPRSS2. Vertical and diagonal traces highlight the transfer of virions from the cell surface to its interior and associated with early or late endosomes/lysosomes as defined by colocalization of eGFP-P with EEA1-Scarlet or eGFP-P with NPC1-Halo, respectively.
Fig. 3.
Fig. 3.
Surface entry route of SARS-CoV-2. (AG) VSV-eGFP-P-SARS-CoV-2-S-Atto 565 was used to infect Vero TMPRSS2 cells and used to study the effect by acidic pH in the medium on the TMPRSS2-mediated surface release of the S-fragment, on the cellular location of fusion and genome delivery and on infectivity. (A and B) Single-virion trajectories of VSV-eGFP-P-SARS-CoV-2-Atto565 in a Vero TMPRSS2 cell incubated at pH 6.8 showing in A an example of S-release at the surface without subsequent fusion and in B an example of S-release followed by penetration of eGFP-P to the cytosol. Orthogonal views of the tracings and corresponding time-dependent fluorescent intensities for S-Atto 565 and eGFP-P are shown. (C) Representative summary from 237 virion traces analyzed during cell entry. Data from single coverslips (out of 5) obtained per each pH condition in the medium are shown. Vertical traces of cells incubated at 6.8 highlight the efficient transfer of virions from the cell surface to the cell interior (based on loss of signal colocalization between eGFP-P and S-Atto 565 and corresponding change of diffusion from constrained to directed). Events of stepwise partial loss of S-Atto 565 are indicated (yellow). Similar data with cells incubated at pH 6.2 show an accumulation of virions in endosomes, complete absence of fusion events from the cell surface, and limited number of fusion events from endosomes. (D) Data showing the fraction of virions that released the S-fragment from virions at the cell surface of Vero TMPRSS2 cells incubated at pH 6.8 in the absence or presence of 10 μM Camostat or of Vero E6, Caco-2, or Calu-3 cells also at pH 6.8 and in the absence of Camostat. The difference of results between control and all other conditions was statistically significant with a P value of <0.0001 using an unpaired t test. (E) Cumulative plot corresponding to the dwell time between the stepwise partial drop of the S-Atto 565 signal of a virion at the cell surface and fusion defined by surface spreading of the remaining Atto 565 signal and transfer into the cytosol of eGFP-P. Data from 86 traces and from 5 experiments. (F) Effect of extracellular pH on the transfer of eGFP-P of virions from the cell surface (red) or from endosomes (black) to the cytosol. Each dot represents average ± SD from 5 coverslips with 3 cells imaged per coverslip and at least 600 virus tracked per condition. The line across each box represents the median of distribution, and the Top and Bottom lines represent the quartiles. (G) Effect of extracellular pH of the cell medium on the mode of diffusion of the eGFP-P signal associated with a virion before and after delivery from the surface (red) or from endosomes (black) to the cytosol. (H) pH bypass infection experiments to test the effect of extracellular acidic pH on the extent of infection of Vero or Vero TMPRSS2 cells by VSV-eGFP-SARS-CoV-2 alone or treated for 30 min with 1 µg/mL trypsin; experiments carried in the absence (Top panel) or presence (Middle and Bottom panels) of 40 μM dynasore-OH. Each data point represents an experiment. In each case, the values determined at pH 6.8 and 7.4 are significantly different with a P value of at least <0.0003 using an unpaired t test. (I) pH bypass infection experiment using authentic SARS-CoV-2 and Vero TMPRSS2* cells in the absence or presence of 40 μM dynasore-OH. Each data point represents an experiment. No statistical difference was observed in the absence of dynasore-OH between pH 6.8 and pH 7.4 (P = 0.13); the difference was statistically significant in the presence of dynasore-OH (P < 0.0001) using an unpaired t test. (J) Representative immunofluorescence images showing the effect of dynasore-OH on the infection by authentic SARS-CoV-2 of Vero TMPRSS2* cells at different pHs used to generate the data shown in I. The extent of infection determined by immunofluorescence (green) with an antibody specific for the N protein of SARS-CoV-2 and nuclear staining (blue) with DAPI is shown.
Fig. 4.
Fig. 4.
Entry routes of VSV-SARS-CoV-2 variants are conserved. (AC) Effect of extracellular pH and type of cells infected with the indicated variants of VSV-eGFP-P-SARS-CoV-2 on (A) the extent of S-fragment release from the cell surface and of (B) fusion from the cell surface or (C) from endosomes. (D) Experiments to determine the effect of extracellular pH on the extent of infection by the Delta and Omicron variants of VSV-SARS-CoV-2 in the presence of 40 μM dynasore-OH. The pH bypass experiments in the Right panel were done with trypsin-cleaved virions. The Bottom two rows compare results obtained with the Omicron variant grown in MA104 or Vero TMPRSS2 cells. Western blot shows cleavage states of the S protein of VSV-SARS-CoV-2-Omicron grown in different cell types. The bypass pH experiments in the Left panels show statistical differences between pH 6.8 and pH 7.4 (P < 0.0001) for Delta and Omicron grown in Vero TMPRSS2 and of minimal significance for Omicron grown MA 104 using an unpaired t test. Similar analyses for the experiments in the Right panels show statistical differences between pH 6.8 and pH 7.4 for Delta (P < 0.0001) and for Omicron grown in Vero TMPRSS2 (P < 0.0001) or MA 104 (P = 0.0015). (E) Nasal pH values determined from 17 healthy individuals. Each dot represents a single pH determination by the pH catheter at the lower turbinate of the right and left nostrils.
Fig. 5.
Fig. 5.
Schematic representation of the principal entry routes SARS-CoV-2 uses for infection. Entry starts with membrane attachment and ends with S protein–catalyzed membrane fusion releasing the viral contents into the cytosol. Fusion activity depends on two proteolytic cleavage steps, namely, one typically carried out by furin in the producing cell and the second by TMPRSS2 on the cell surface on in endosomes of the target cell. Alternatively, endosomal cathepsins can carry out both cleavages. Exposure of the virus to an acidic milieu is essential for membrane fusion, genome penetration, and productive infection. Fusion and penetration occur only in acidic early and late endosomal/lysosomal compartments but not at the cell surface, even when the furin and TMPRSS2 cleavages have both occurred. Fusion and penetration can occur at the cell surface of cells expressing TMPRSS2 if the extracellular pH is ∼6.8.

Update of

References

    1. Hoffmann M., et al. , SARS-CoV-2 cell entry depends on ACE2 and TMPRSS2 and is blocked by a clinically proven protease inhibitor. Cell 181, 271–280.e8 (2020). - PMC - PubMed
    1. Wrapp D., et al. , Cryo-EM structure of the 2019-nCoV spike in the prefusion conformation. Science 367, 1260–1263 (2020). - PMC - PubMed
    1. Yang J., et al. , Molecular interaction and inhibition of SARS-CoV-2 binding to the ACE2 receptor. Nat. Commun. 11, 4541 (2020). - PMC - PubMed
    1. Yan R., et al. , Structural basis for the recognition of SARS-CoV-2 by full-length human ACE2. Science 367, 1444–1448 (2020). - PMC - PubMed
    1. Shang J., et al. , Cell entry mechanisms of SARS-CoV-2. Proc. Natl. Acad. Sci. U.S.A. 117, 11727–11734 (2020). - PMC - PubMed

Publication types