. 2022 Sep 2;377(6610):eabp9186.
doi: 10.1126/science.abp9186. Epub 2022 Sep 2.

Cell-type profiling in salamanders identifies innovations in vertebrate forebrain evolution

Affiliations

Cell-type profiling in salamanders identifies innovations in vertebrate forebrain evolution

Jamie Woych et al. Science. .

Abstract

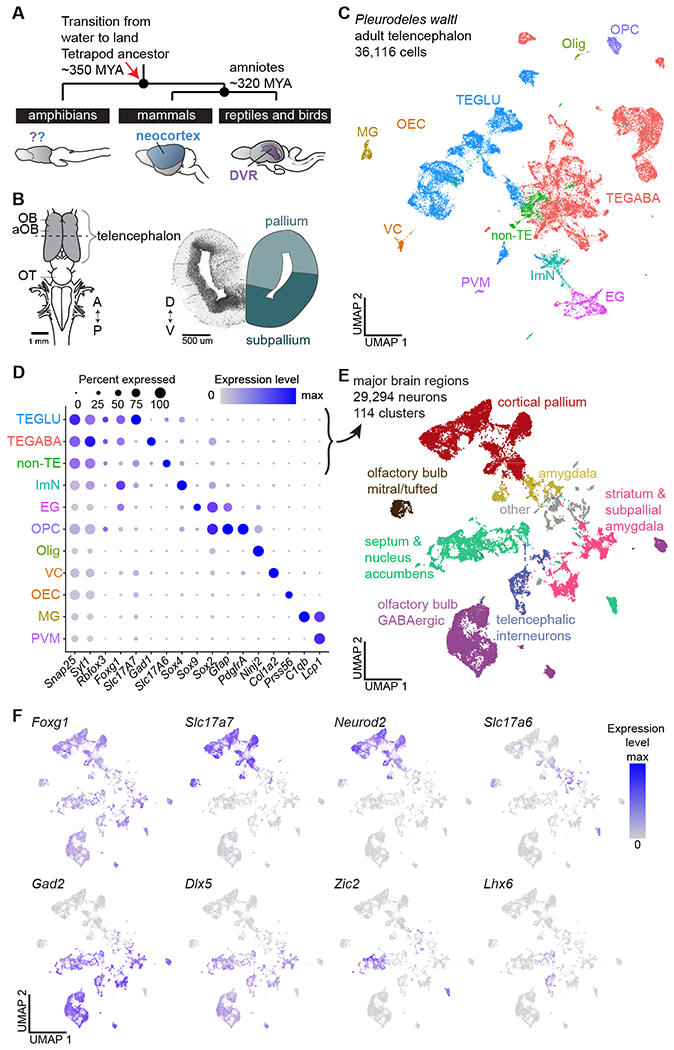
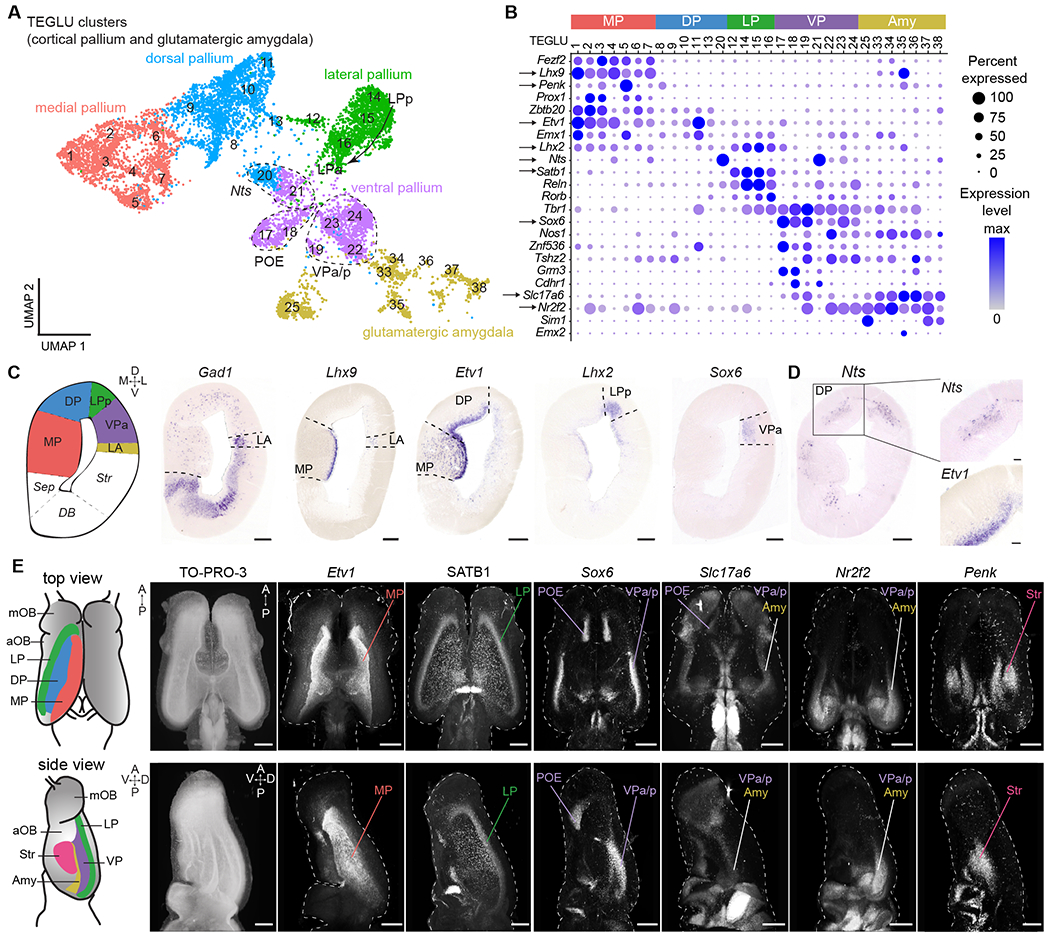
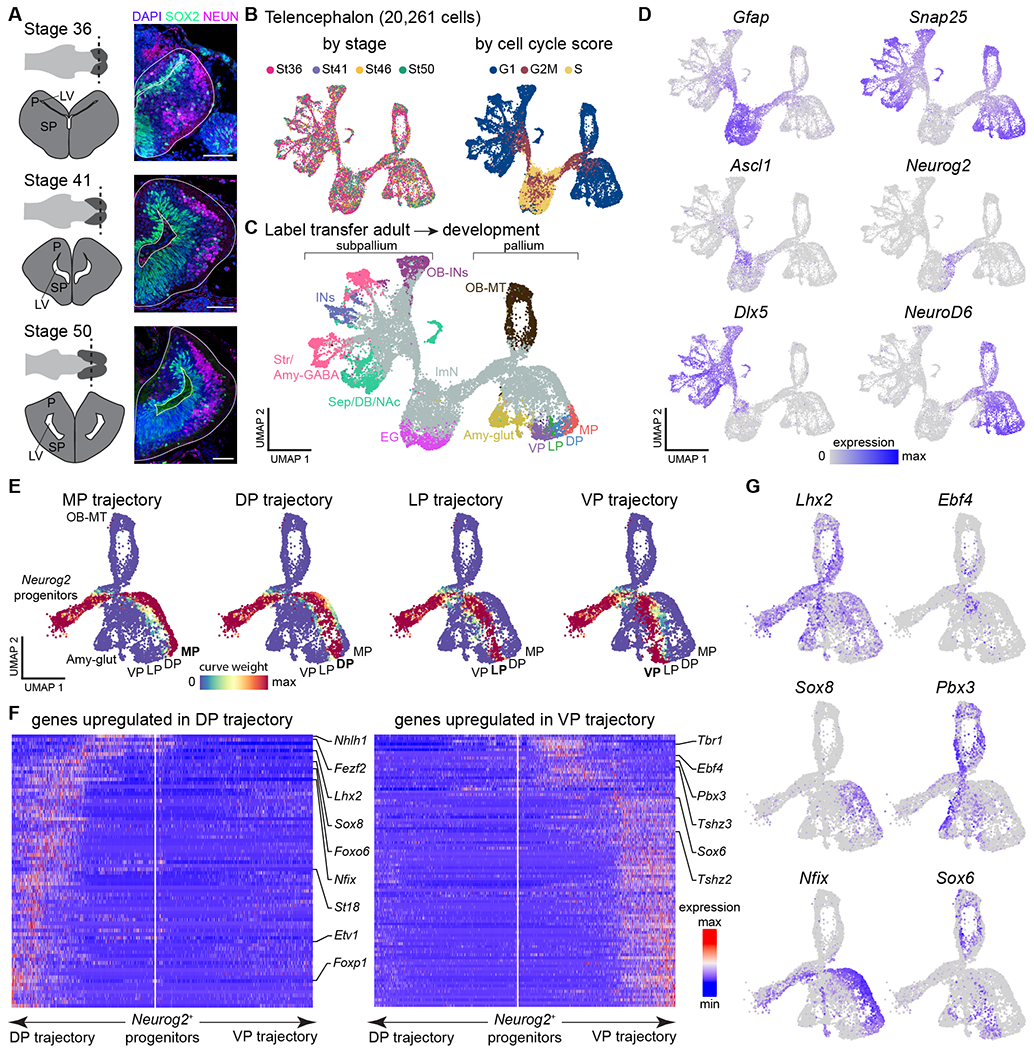
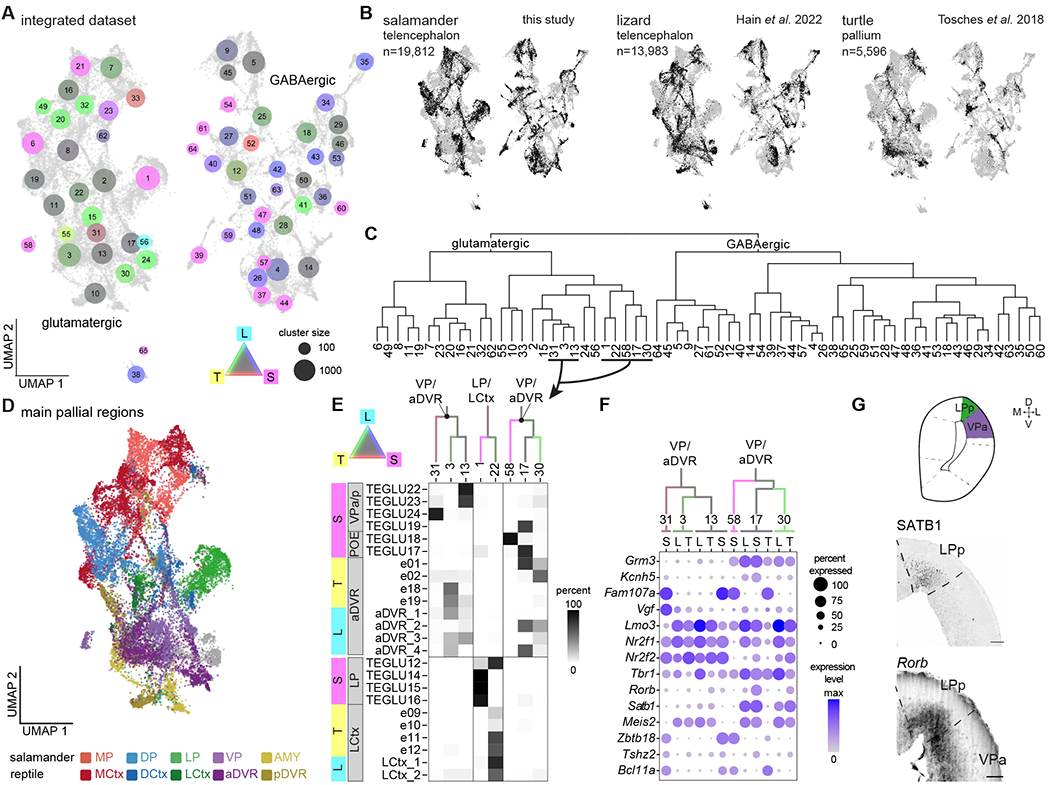
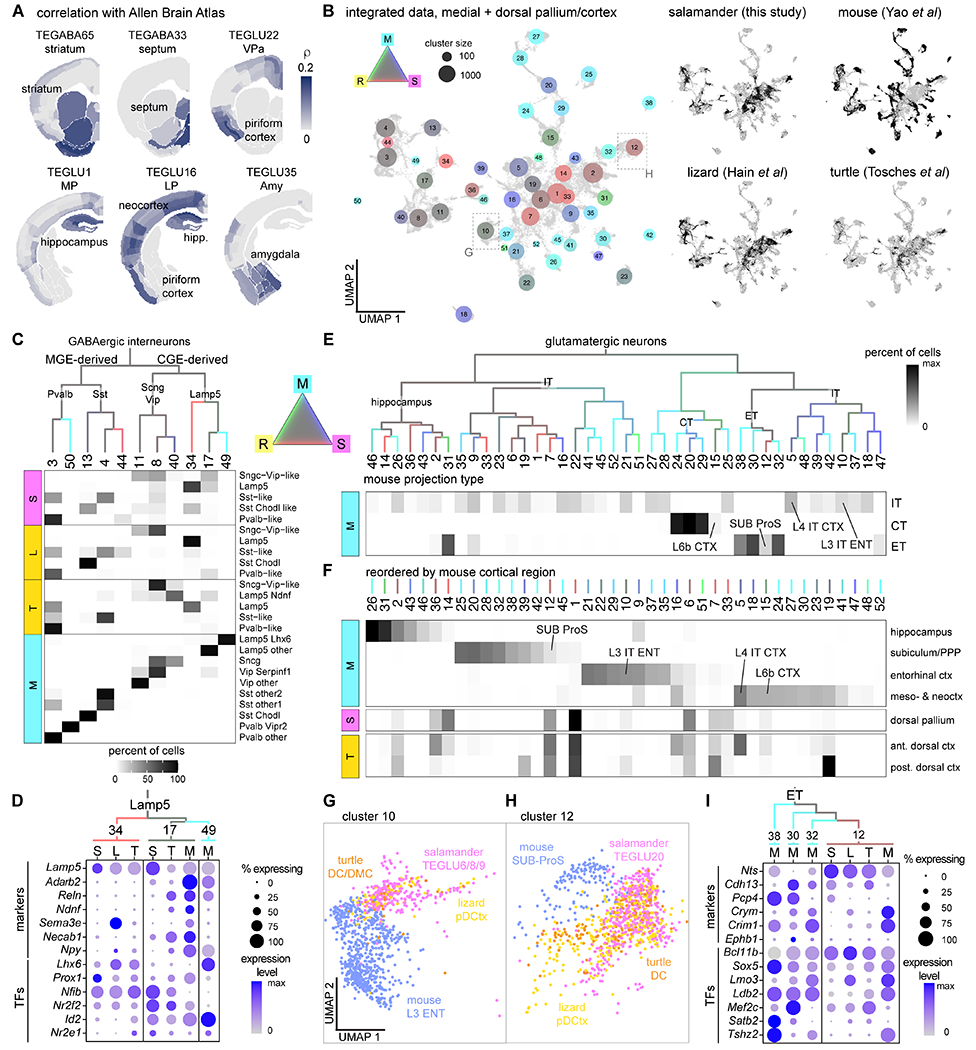
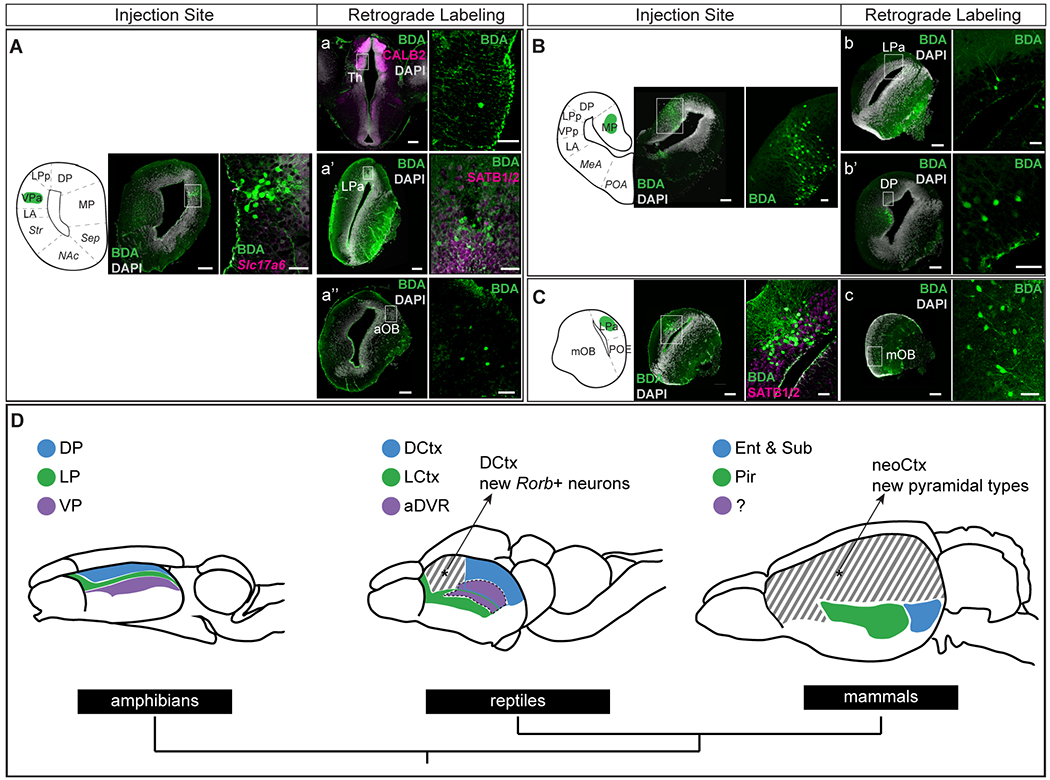
The evolution of advanced cognition in vertebrates is associated with two independent innovations in the forebrain: the six-layered neocortex in mammals and the dorsal ventricular ridge (DVR) in sauropsids (reptiles and birds). How these innovations arose in vertebrate ancestors remains unclear. To reconstruct forebrain evolution in tetrapods, we built a cell-type atlas of the telencephalon of the salamander Pleurodeles waltl. Our molecular, developmental, and connectivity data indicate that parts of the sauropsid DVR trace back to tetrapod ancestors. By contrast, the salamander dorsal pallium is devoid of cellular and molecular characteristics of the mammalian neocortex yet shares similarities with the entorhinal cortex and subiculum. Our findings chart the series of innovations that resulted in the emergence of the mammalian six-layered neocortex and the sauropsid DVR.


Conflict of interest statement

Competing interests: Authors declare that they have no competing interests.

Figures

Fig. 1.
Fig. 1.. Neuronal diversity in the Pleurodeles telencephalon.
(A) Schematic highlighting the phylogenetic position of amphibians, the mammalian neocortex, and the reptilian DVR. (B) Left: schematic of the Pleurodeles waltl brain (dorsal view). Dotted line indicates section plane for coronal slice on the right. (C) UMAP (Uniform Manifold Approximation and Projection) plot of 36,116 salamander single-cell transcriptomes, colors indicate cell classes. (D) DotPlot showing the expression of marker genes used to annotate the telencephalic dataset in (C). (E) UMAP plot of 29,294 single-cell transcriptomes of salamander neurons, colors indicate major brain regions. (F) UMAP plots showing expression of key markers of glutamatergic and GABAergic neurons in the neuronal dataset. Abbreviations: A, anterior; aOB, accessory olfactory bulb; D, dorsal; DVR, dorsal ventricular ridge; EG, ependymoglia; GLU, glutamatergic; ImN, immature neurons; MG, microglia; MYA, million years ago; OB, olfactory bulb; OEC, olfactory ensheathing cells; Olig, oligodendrocytes; OPC, oligodendrocyte precursor cells; OT, optic tectum; P, posterior; PVM, perivascular macrophages; TE, telencephalic; V, ventral; VC, vascular cells
Fig. 2.
Fig. 2.. Spatial mapping of pallial neurons in Pleurodeles.
(A) UMAP plot of clusters from cortical pallium and amygdala, annotated by the inferred pallial region. (B) DotPlot showing the expression of key marker genes defining distinct pallial regions. Arrows: genes shown in C-E. (C) Left to right: schematic of a coronal section at mid-telencephalic level, expression of Gad1, marker of the subpallium, and of transcription factors labeling distinct pallial regions along the mediolateral axis. Scale bars: 200 um. (D) Expression of Nts and Etv1 in layers, boxed areas indicate magnifications on the right. Scale bars in right panels: 50 um. (E) Left: schematics of dorsal and lateral surfaces of the salamander telencephalon. Right: dorsal and lateral views of whole-mount immunohistochemistry or HCR stainings for telencephalic markers. Panels show maximum intensity projections of brains after clearing and volumetric light-sheet imaging. Scale bars: 500 um. See methods for specifics on SATB1 antibody. For full list of abbreviations, see Fig. S1; Amy, amygdala; TEGLU, telencephalic glutamatergic.
Fig. 3.
Fig. 3.. Developmental trajectories in the Pleurodeles telencephalon.
(A) Overview of telencephalic development in Pleurodeles. Right: coronal sections through the telencephalon showing SOX2+ radial glia and interneurons, and NEUN+ differentiated neurons. Scale bars: 100 um. (B) UMAP plots of 20,261 telencephalic cells colored by developmental stage (left) and cell cycle score (right). (C) UMAP plot of the developing telencephalon, colored according to cell classes after label transfer from the adult dataset. (D) UMAP plots colored by the expression of Gfap (radial glia), Snap25 (differentiated neurons), Ascl1 and Neurog2 (committed subpallial and pallial progenitors), and Dlx5 and NeuroD6 (postmitotic subpallial and pallial neurons). (E) UMAP plots showing the assignment of cells to each of the trajectories based on curve weights, which represent the likelihood that a cell belongs to a given principle curve calculated by Slingshot. (F) Heatmaps of genes differentially expressed along the trajectories of the dorsal and ventral pallium, with transcription factors highlighted on the side. White line in the middle of each panel indicates the position of the Neurog2+ progenitors and arrows to the left and right represent the two trajectories. Gene expression levels for each gene are scaled by root mean square ranging from −2 to 6. (G) UMAP plots showing pallial single cells color-coded by expression of transcription factors upregulated in the dorsal (left) or ventral (right) trajectory. Abbreviations: see Figs. S1, S3; EG, ependymoglia; ImN, immature neurons; LV, lateral ventricle; OB-MT, olfactory bulb mitral and tufted cells; P, pallium; SP, subpallium.
Fig. 4.
Fig. 4.. Salamander and reptile telencephalon cross-species comparison.
(A) UMAP plot after integration of scRNAseq data from the salamander and lizard telencephalon, and from the turtle pallium. Dot colors indicate species mixture in each integrated cluster (gray represents equal proportion of cells from each species). Dot size indicates the number of cells in each cluster. (B) UMAP plots of the integrated dataset showing cells from each species highlighted in black. (C) Hierarchical clustering of average expression profiles of the integrated clusters shown in (A). (D) UMAP plot of the glutamatergic clusters from the integrated dataset, colored by pallial region. (E) Top: ventrolateral portion of the dendrogram in C, with branches colored by species mixture. Bottom: percentage of cells from the original species-specific clusters (rows) in the integrated clusters (columns). (F) DotPlot showing the expression of molecular markers in aDVR or VP in the integrated clusters, with cells from each integrated cluster split by species (L, lizard; S, salamander; T, turtle). (G) Top: schematic of a coronal section at mid-telencephalic level in the Pleurodeles brain. Bottom: presence of SATB1 and expression of Rorb in the salamander lateral and ventral pallium. Scale bars: 100um.
Fig. 5.
Fig. 5.. Salamander, reptile and mouse cross-species comparison.
(A) Correlations of the transcriptome of selected Pleurodeles clusters with in situ hybridization data from the Allen Adult Mouse Brain Atlas. (B) Integration of scRNAseq data from the salamander medial and dorsal pallium, the turtle and lizard (“reptile”) medial and dorsal cortex, and the mouse hippocampus and cortex. Left: UMAP of the integrated data with dots colored by species mixture, dot size indicates cluster size. Right: UMAP plots of the integrated dataset showing cells from each species highlighted in black. (C) Top: Hierarchical clustering of average expression profiles of integrated GABAergic clusters, branches colored by species mixture (gray represents equal proportion of cells from each species). Bottom: percentage of cells from the original species-specific clusters (rows) in the integrated clusters (columns). (D) DotPlot showing expression of differentiation markers and of transcription factors (TFs) in Lamp5 interneurons (integrated clusters 34, 17, and 49). Cells from each integrated cluster split by species (L, lizard; M, mouse; S, salamander; T, turtle). (E) Top: Hierarchical clustering of average expression profiles of integrated glutamatergic clusters, branches colored by species mixture. Bottom: percentage of mouse cells in each integrated cluster (columns); mouse cells grouped by projection identity (rows). Integrated clusters including selected mouse neuron types are highlighted (ENT, entorhinal cortex; L4 IT CTX, thalamorecipient L4 neurons; SUB, subiculum). (F) Top: percentage of mouse cells in each integrated cluster (columns); mouse cells grouped by cortical area (rows), columns reordered by cortical area. Bottom: percentage of salamander DP cells and turtle dorsal cortex cells (rows) in each integrated cluster (columns). (G-H) Close-up on part of the UMAP in (B), showing cells in cluster 10 (G) or cluster 12 (H) colored by species. (I) DotPlot showing expression of differentiation markers and transcription factors (TFs) in integrated clusters 12, 38, 30, and 32, split by species.
Fig. 6.
Fig. 6.. Connectivity of the Pleurodeles pallium.
(A-C) Left: injection sites of the retrograde tracer BDA (biotinylated dextran amine). Scale bars: 200 um. Injection of 3 kD BDA into (A) VPa (n= 4), (B) MP (n=2), (C) LPa (n=2). Right: magnification of injection site with immunostaining or HCR in situ hybridization of relevant molecular markers. Scale bars: 50 um. (a-c) Left: representative coronal sections where retrogradely labeled cells were identified, with immunostaining or HCR in situ hybridization of relevant molecular markers when applicable. Right: magnification of retrogradely labeled cells, with immunostaining of relevant markers when applicable. (D) Top: schematic representation of amphibian, reptile, and mammalian brains. Colors indicate molecular and connectivity similarities of neuron types across species. Cross hatching denotes areas with cell type innovations. Medial pallium/medial cortex and hippocampus not shown; mammalian subiculum not shown in the drawing. Bottom: phylogenetic tree. For full list of abbreviations, see Fig. S1; aDVR, anterior dorsal ventricular ridge; BDA, biotinylated dextran amine; DCtx, dorsal cortex; Ent, entorhinal cortex; LCtx, lateral cortex; Pir, piriform cortex; Sub, subiculum.

Comment in

  • A mosaic of new and old cell types.
    Faltine-Gonzalez DZ, Kebschull JM. Faltine-Gonzalez DZ, et al. Science. 2022 Sep 2;377(6610):1043-1044. doi: 10.1126/science.add9465. Epub 2022 Sep 1. Science. 2022. PMID: 36048955
  • Mapping vertebrate brain evolution.
    Minton K. Minton K. Nat Rev Genet. 2022 Nov;23(11):647. doi: 10.1038/s41576-022-00535-z. Nat Rev Genet. 2022. PMID: 36167907 No abstract available.

References

    1. MacIver MA, Finlay BL, The neuroecology of the water-to-land transition and the evolution of the vertebrate brain. Philos. Trans. R. Soc. Lond. B Biol. Sci 377, 20200523 (2022). - PMC - PubMed
    1. Striedter GF, The telencephalon of tetrapods in evolution. Brain Behav. Evol 49, 179–213 (1997). - PubMed
    1. Butler AB, Molnár Z, Development and evolution of the collopallium in amniotes: a new hypothesis of field homology. Brain Res. Bull 57, 475–479 (2002). - PubMed
    1. Butler AB, Reiner A, Karten HJ, Evolution of the amniote pallium and the origins of mammalian neocortex. Ann. N. Y. Acad. Sci 1225, 14–27 (2011). - PMC - PubMed
    1. Jarvis ED, in Evolution of nervous systems (Elsevier, 2007), pp. 213–227.