

IL-6/STAT3 axis dictates the PNPLA3-mediated susceptibility to non-alcoholic fatty liver disease
- PMID: 36049612
- PMCID: PMC9772150
- DOI: 10.1016/j.jhep.2022.08.022
IL-6/STAT3 axis dictates the PNPLA3-mediated susceptibility to non-alcoholic fatty liver disease
Abstract
Background & aims: A number of genetic polymorphisms have been associated with susceptibility to or protection against non-alcoholic fatty liver disease (NAFLD), but the underlying mechanisms remain unknown. Here, we focused on the rs738409 C>G single nucleotide polymorphism (SNP), which produces the I148M variant of patatin-like phospholipase domain-containing protein 3 (PNPLA3) and is strongly associated with NAFLD.
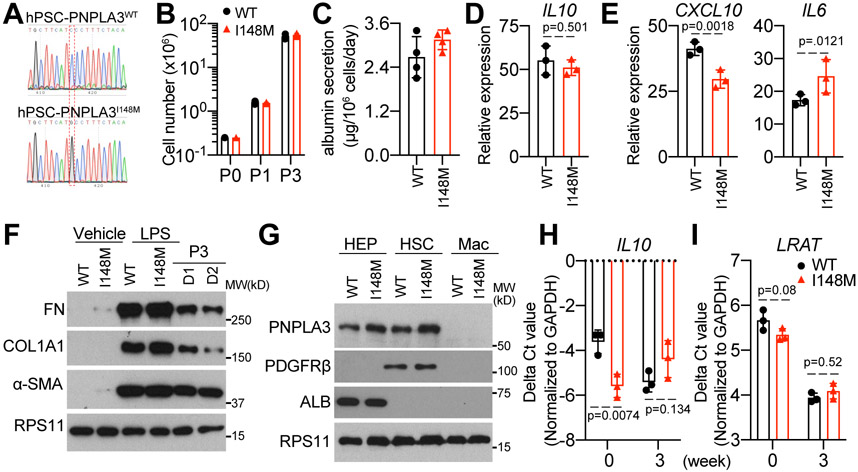
Methods: To enable mechanistic dissection, we developed a human pluripotent stem cell (hPSC)-derived multicellular liver culture by incorporating hPSC-derived hepatocytes, hepatic stellate cells, and macrophages. We first applied this liver culture to model NAFLD by utilising a lipotoxic milieu reflecting the circulating levels of disease risk factors in affected individuals. We then created an isogenic pair of liver cultures differing only at rs738049 and compared NAFLD phenotype development.
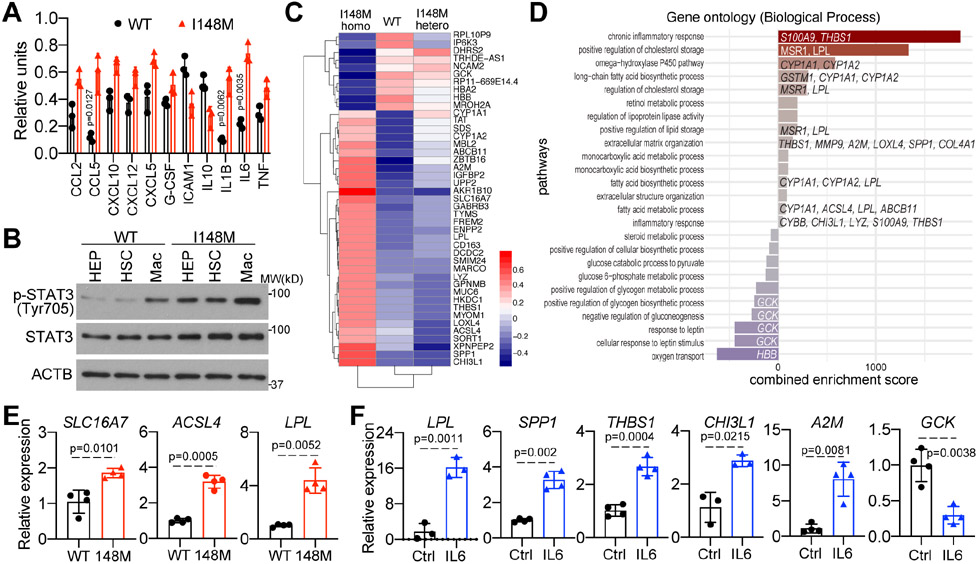
Results: Our hPSC-derived liver culture recapitulated many key characteristics of NAFLD development and progression including lipid accumulation and oxidative stress, inflammatory response, and stellate cell activation. Under the lipotoxic conditions, the I148M variant caused the enhanced development of NAFLD phenotypes. These differences were associated with elevated IL-6/signal transducer and activator of transcription 3 (STAT3) activity in liver cultures, consistent with transcriptomic data of liver biopsies from individuals carrying the rs738409 SNP. Dampening IL-6/STAT3 activity alleviated the I148M-mediated susceptibility to NAFLD, whereas boosting it in wild-type liver cultures enhanced NAFLD development. Finally, we attributed this elevated IL-6/STAT3 activity in liver cultures carrying the rs738409 SNP to increased NF-κB activity.
Conclusions: Our study thus reveals a potential causal link between elevated IL-6/STAT3 activity and 148M-mediated susceptibility to NAFLD.
Impact and implications: An increasing number of genetic variants manifest in non-alcoholic fatty liver disease (NAFLD) development and progression; however, the underlying mechanisms remain elusive. To study these variants in human-relevant systems, we developed an induced pluripotent stem cell-derived multicellular liver culture and focused on a common genetic variant (i.e. rs738409 in PNPLA3). Our findings not only provide mechanistic insight, but also a potential therapeutic strategy for NAFLD driven by this genetic variant in PNPLA3. Our liver culture is therefore a useful platform for exploring genetic variants in NAFLD development.
Keywords: Disease modelling; Genetic variant; IL-6/STAT3 signalling; Liver culture; Multicellular culture; NAFLD; PNPLA3; Stem cells.
Copyright © 2022 European Association for the Study of the Liver. Published by Elsevier B.V. All rights reserved.
Conflict of interest statement
Conflicts of interest CMR is a founder of Apath LLC; a Scientific Advisory Board member of Imvaq Therapeutics, Vir Biotechnology, and Arbutus Biopharma; and an advisor for Regulus Therapeutics and Pfizer. CEM is a cofounder of Onegevity. Please refer to the accompanying ICMJE disclosure forms for further details.
Figures


Similar articles
-
The rs2294918 E434K variant modulates patatin-like phospholipase domain-containing 3 expression and liver damage.Hepatology. 2016 Mar;63(3):787-98. doi: 10.1002/hep.28370. Epub 2016 Jan 14. Hepatology. 2016. PMID: 26605757
-
PNPLA3 variant and portal/periportal histological pattern in patients with biopsy-proven non-alcoholic fatty liver disease: a possible role for oxidative stress.Sci Rep. 2017 Nov 17;7(1):15756. doi: 10.1038/s41598-017-15943-z. Sci Rep. 2017. PMID: 29150621 Free PMC article.
-
Hepatic patatin-like phospholipase domain-containing 3 levels are increased in I148M risk allele carriers and correlate with NAFLD in humans.Hepatol Commun. 2022 Oct;6(10):2689-2701. doi: 10.1002/hep4.2032. Epub 2022 Jul 14. Hepatol Commun. 2022. PMID: 35833455 Free PMC article.
-
PNPLA3 I148M and response to treatment for hepatic steatosis: A systematic review.Liver Int. 2023 May;43(5):975-988. doi: 10.1111/liv.15533. Epub 2023 Feb 16. Liver Int. 2023. PMID: 36719059
-
PNPLA3 I148M variant in nonalcoholic fatty liver disease: demographic and ethnic characteristics and the role of the variant in nonalcoholic fatty liver fibrosis.World J Gastroenterol. 2015 Jan 21;21(3):794-802. doi: 10.3748/wjg.v21.i3.794. World J Gastroenterol. 2015. PMID: 25624712 Free PMC article. Review.
Cited by
-
The role and mechanism of pyroptosis and potential therapeutic targets in non-alcoholic fatty liver disease (NAFLD).Front Cell Dev Biol. 2024 Jul 3;12:1407738. doi: 10.3389/fcell.2024.1407738. eCollection 2024. Front Cell Dev Biol. 2024. PMID: 39022762 Free PMC article. Review.
-
SNPs Give LACTB Oncogene-Like Functions and Prompt Tumor Progression via Dual-Regulating p53.Adv Sci (Weinh). 2024 Nov;11(43):e2405907. doi: 10.1002/advs.202405907. Epub 2024 Sep 26. Adv Sci (Weinh). 2024. PMID: 39324579 Free PMC article.
-
Exploring the role of genetic variations in NAFLD: implications for disease pathogenesis and precision medicine approaches.Eur J Med Res. 2024 Mar 20;29(1):190. doi: 10.1186/s40001-024-01708-8. Eur J Med Res. 2024. PMID: 38504356 Free PMC article. Review.
-
The relationship between serum uric acid level and non-alcoholic fatty liver disease in northern China: a retrospective cohort study.BMC Public Health. 2025 Feb 21;25(1):718. doi: 10.1186/s12889-025-21943-w. BMC Public Health. 2025. PMID: 39984884 Free PMC article.
-
Fracture-Induced Immunological Cascades Trigger Rapid Systemic Bone Loss via Osteocyte-Regulated Osteoclastogenesis.Immunotargets Ther. 2025 Aug 21;14:849-875. doi: 10.2147/ITT.S533552. eCollection 2025. Immunotargets Ther. 2025. PMID: 40860346 Free PMC article.
References
Publication types
MeSH terms
Substances
Grants and funding
- R01 AI171201/AI/NIAID NIH HHS/United States
- R01 AI140718/AI/NIAID NIH HHS/United States
- R01 AI140705/AI/NIAID NIH HHS/United States
- R35 CA200422/CA/NCI NIH HHS/United States
- R01 DK125100/DK/NIDDK NIH HHS/United States
- R00 AI141742/AI/NIAID NIH HHS/United States
- R01 AI151013/AI/NIAID NIH HHS/United States
- R01 DK059466/DK/NIDDK NIH HHS/United States
- R01 DE023926/DE/NIDCR NIH HHS/United States
- R01 CA251275/CA/NCI NIH HHS/United States
- K99 AI141742/AI/NIAID NIH HHS/United States
- DP2 AI170515/AI/NIAID NIH HHS/United States
- R01 AI152190/AI/NIAID NIH HHS/United States
- R01 DE028521/DE/NIDCR NIH HHS/United States
LinkOut - more resources
Full Text Sources
Medical
Miscellaneous
