. 2022 Sep 1;13(1):5139.
doi: 10.1038/s41467-022-32805-z.

A compendium of 32,277 metagenome-assembled genomes and over 80 million genes from the early-life human gut microbiome

Affiliations

A compendium of 32,277 metagenome-assembled genomes and over 80 million genes from the early-life human gut microbiome

Shuqin Zeng et al. Nat Commun. .

Abstract

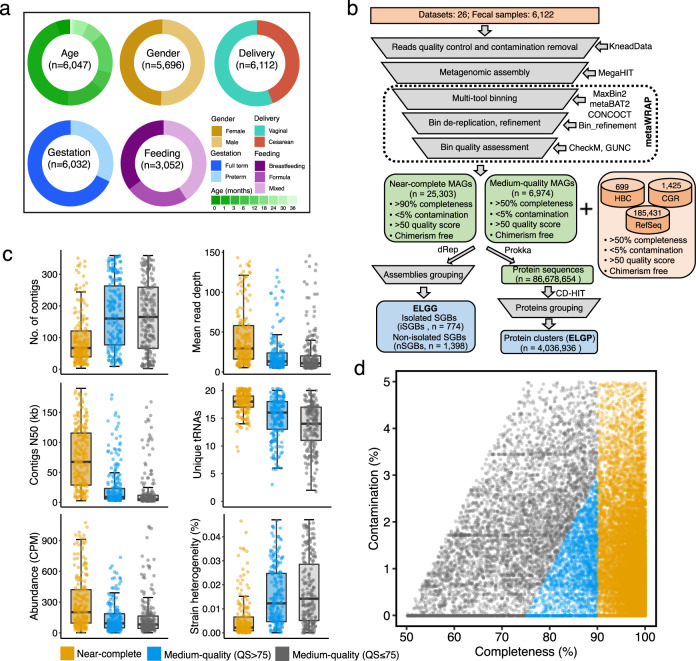
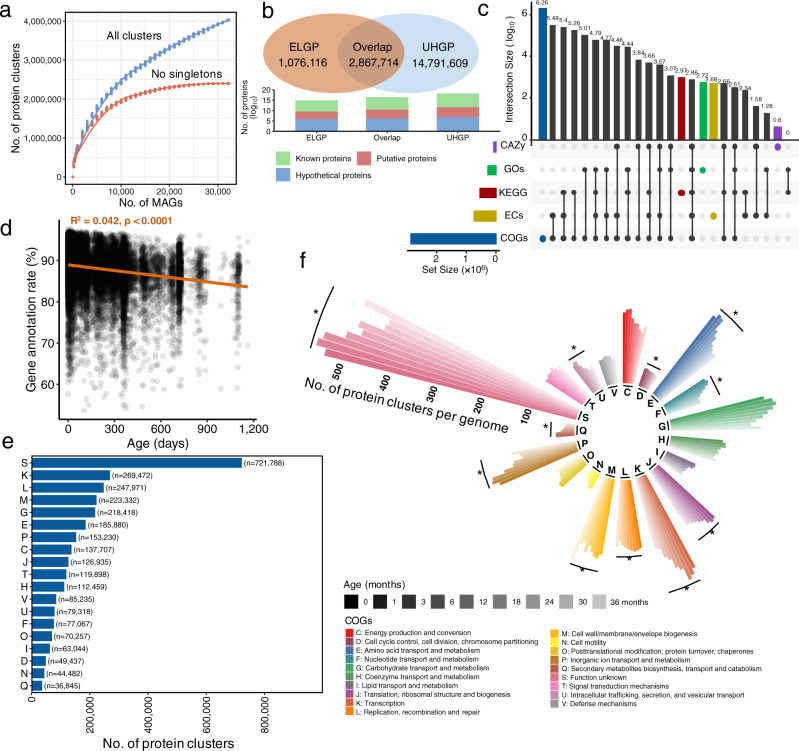
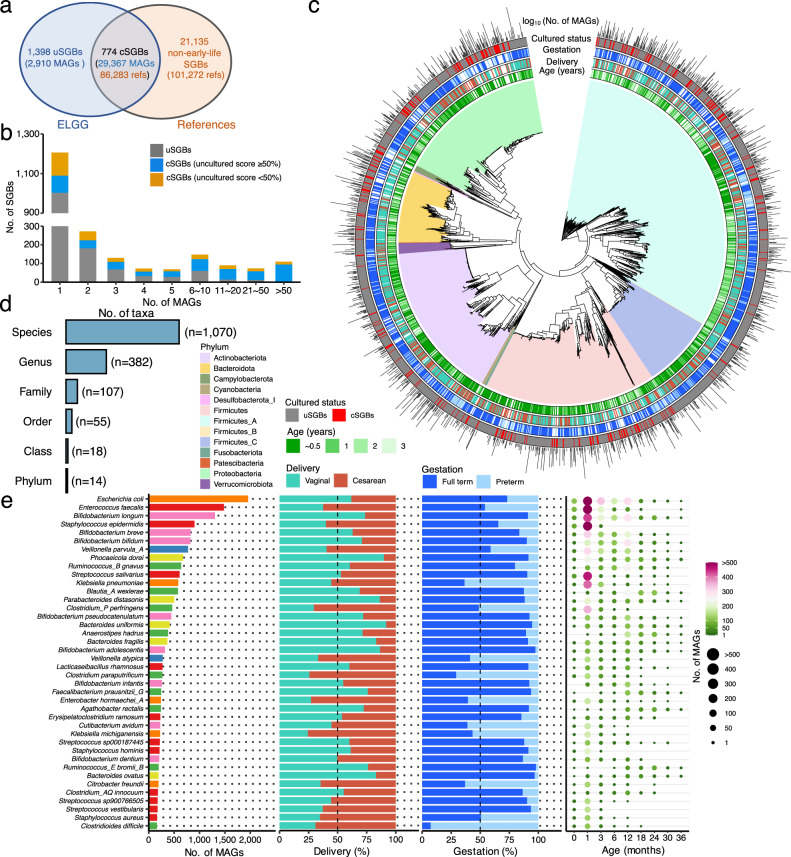
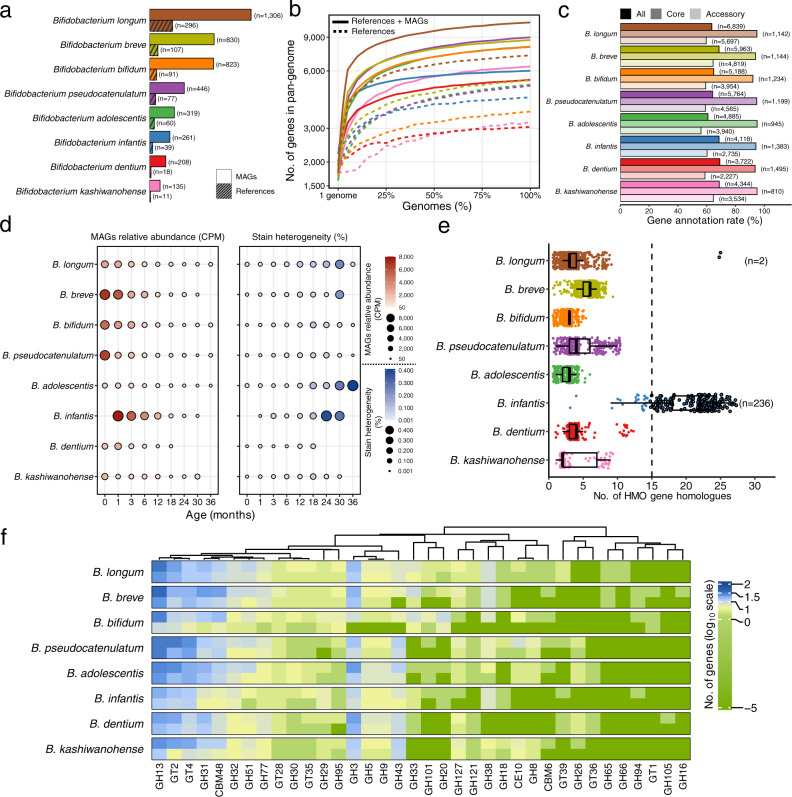
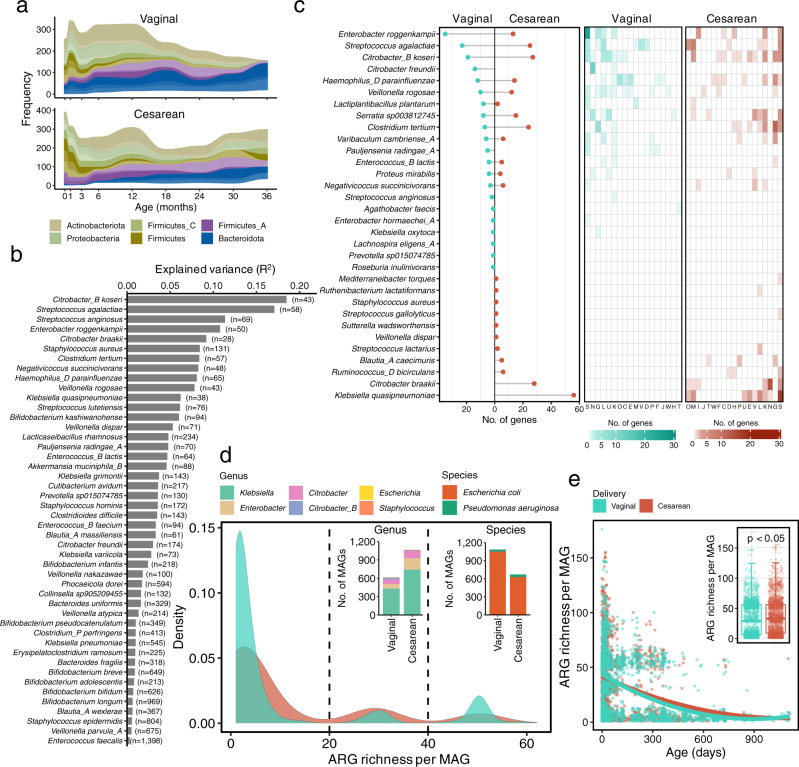
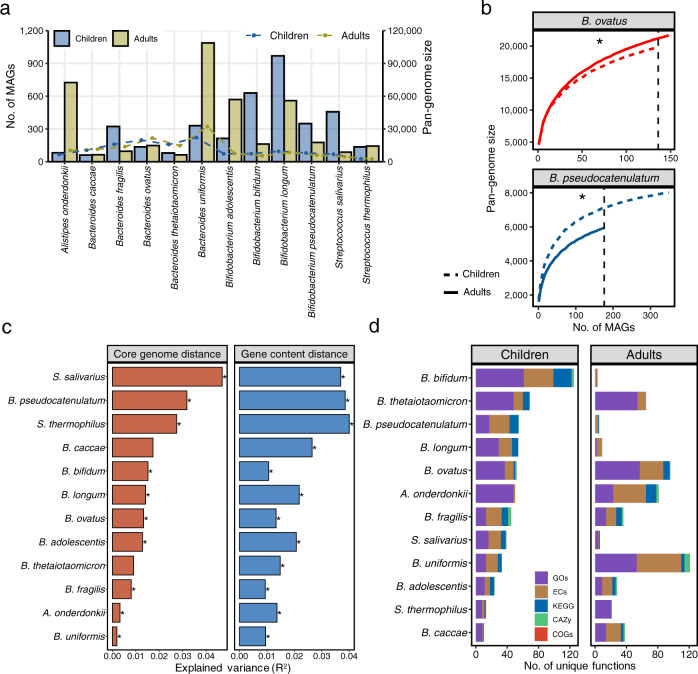
Age-specific reference genomes of the human gut microbiome can provide higher resolution for metagenomic analyses including taxonomic classification, strain-level genomic investigation and functional characterization. We present the Early-Life Gut Genomes (ELGG) catalog with 32,277 genomes representing 2172 species from 6122 fecal metagenomes collected from children under 3 years old spanning delivery mode, gestational age, feeding pattern, and geography. The ELGG substantially expanded the phylogenetic diversity by 38% over the isolate microbial genomes, and the genomic landscape of the early-life microbiome by increasing recruitment of metagenomic reads to 82.8%. More than 60% of the ELGG species lack an isolate representative. The conspecific genomes of the most abundant species from children differed in gene diversity and functions compared to adults. The ELGG genomes encode over 80 million protein sequences, forming the Early-Life Gut Proteins (ELGP) catalog with over four million protein clusters, 29.5% of which lacked functional annotations. The ELGG and ELGP references provided new insights into the early-life human gut microbiome and will facilitate studies to understand the development and mechanisms of disturbances of the human gut microbiome in early life.


Conflict of interest statement

The authors declare no competing interests.

Figures

Fig. 1
Fig. 1. The reconstruction of sequence catalog from the early-life human gut microbiome.
a The number and proportion of fecal metagenomes stratified by clinical features including age, gender, delivery mode, gestational age, and feeding patterns. b Overview of the computational pipeline to generate ELGG and ELGP catalogs. c Quality metrics across near-complete (n = 25,303), medium with quality score (QS) > 75 (n = 2063) and medium with QS ≤ 75 (n = 4911) MAGs. CPM copies per million reads. Boxes show the interquartile range (IQR), with the horizonal line as the median, the whiskers indicating the range of the data (up to 1.5× IQR), and points beyond the whiskers as outliers. d Completeness and contamination scores for each of 32,277 genomes. QS = completeness–5 × contamination.
Fig. 2
Fig. 2. The ELGP catalog and functional characterization.
a Rarefaction analysis of the number of protein clusters of early-life gut microbiome at 95% amino acid identity as a function of the number of genomes included. Curves are depicted for all the protein clusters and after excluding singleton protein clusters (containing only one protein sequence). b Overlap between the ELGP (orange) and UHGP (blue), both clustered at 95% amino acid identity. The bars at bottom indicate the number of proteins that the cluster representatives from three categories (ELGP exclusive, Overlap, and UHGP exclusive) encode, stratified as known, putative, and hypothetical proteins. c Number of proteins with functional annotation across the five functional categories and their degree of overlap. Vertical bars represent the number of proteins unique (color) to each functional category or shared (black) between the specific functional categories. Horizontal bars in the lower panel indicate the total number of proteins with functional annotation in each functional category. d Dynamics of the rate of protein characterization of ELGP along with the age of children. e COG functional annotation of the ELGP catalog clustered at 95% amino acid identity. Only functions with >5000 genes are plotted. f Dynamics of the rate of COG functional annotation of ELGP catalog clustered at 95% amino acid identity in response to the age of children. Vertical bars from left to right represent the age of children at 0, 1, 3, 6, 12, 18, 24, 30, and 36 months. Asterisk (*) indicates the significant difference (two-tailed Wilcoxon test, FDR < 0.05) between the rate of COG functional annotation of ELGP catalog at birth and 36 months old children.
Fig. 3
Fig. 3. A total of 2172 species-level clusters (SGBs) obtained from 32,277 early-life MAGs.
a Overlap of SGBs containing both MAGs and isolate reference genomes. SGBs containing MAGs and reference genomes are denoted as cultured SGBs (cSGBs), SGBs without reference genomes are denoted as uncultured SGBs (uSGBs), and those exclusively containing reference genomes are denoted as non-early-life SGBs. b The number of cSGBs and uSGBs as a function of the genome number within each SGBs. The uncultured score is calculated as the proportion of MAGs in the total genomes belonging to that SGB. c The phylogenetic tree of early-life gut microbiome built with 2171 bacterial representative genomes of the ELGG catalog. d The number of cultured taxa at different resolutions from 2172 representative genomes. e The number of MAGs in each SGBs, and only the top 40 most represented SGBs were displayed. The clinical factor (i.e., delivery mode, gestational age, and age) related to the MAGs per species are plotted.
Fig. 4
Fig. 4. Characterization of key early-life Bifidobacterium spp. from ELGG catalog.
a The number of genomes stratified by MAGs and reference genomes. b The pan-genome plot represented by the accumulated number of genes as a function of the number of genomes stratified by MAGs and reference genomes. c The rate of functional annotation across databases of COGs, KEGG, GOs, ECs, and CAZy for each species stratified by core and accessory genes. The number in parentheses indicates the number of genes with functional annotation. d Dynamics of the relative abundance and strain heterogeneity of MAGs in response to the age of children. e The number of gene homologs matched to a well-characterized gene cluster responsible for HMOs utilization from each species. Boxes show the interquartile range (IQR), with the vertical line as the median, the whiskers indicating the range of the data (up to 1.5× IQR), and points beyond the whiskers as outliers. f The glycobiome (columns) colored by the number of genes per genome (rows) of each species annotated with the CAZy database. The log10 scaled value (after adding a pseudocount of 1 × 10−5 to avoid non-finite values resulting from zero gene) is plotted.
Fig. 5
Fig. 5. Influences of delivery mode on early-life gut microbiome at a genome-resolved level.
a Prevalence of 16 bacterial genera in children stratified by delivery mode over time, where each genus was colored by its phylum. Only genera with >10% prevalence in children born by any of delivery modes are plotted. b The explained variance (R2) contributed by delivery mode of 46 species that were significantly (PERMANOVA, FDR < 0.05) associated with delivery mode based on the hamming distance of core genes per species. The number in parentheses indicate the number of MAGs of this species. c The number of genes that were prevalent in C-section born children or vaginally born children (>70% in C-section born children and <30% in vaginally born children, and vice versa) for each species and their associated functions annotated by COGs database. d The density of antibiotic resistance genes (ARGs) richness in each genome of ELGG, and the taxonomic assignment of the genomes at genus (left inset) and species (right inset) level. e The dynamics of ARGs richness from the early-life human gut microbiome in response to the age of children. The gut microbiome from children born by C-section carried higher (two-tailed Wilcoxon test, p < 0.05, inset) number of ARGs than that of children born vaginally. The inset boxes show the interquartile range (IQR), with the horizonal line as the median, the whiskers indicating the range of the data (up to 1.5× IQR), and points beyond the whiskers as outliers.
Fig. 6
Fig. 6. Comparisons of gut microbiome between children and adults.
a Number of genomes (bar plot) and pan-genome size of each species from children and adults. b Pan-genome plot represented by the accumulated number of genes against the number of genomes of B. ovatus and B. pesudocatenulatum stratified by children and adults (two-tailed Wilcoxon test, *FDR < 0.05). c The explained variance (R2) contributed by age (children and adults) based on the hamming distance of core genes per species and Jaccard distance of presence/absence genes (two-tailed Wilcoxon test, *FDR < 0.05). d The unique functional annotations belonging to either children or adults categorized by databases of COGs, KEGG, GOs, ECs, and CAZy.

References

    1. Manor O, et al. Health and disease markers correlate with gut microbiome composition across thousands of people. Nat. Commun. 2020;11:5206. doi: 10.1038/s41467-020-18871-1. - DOI - PMC - PubMed
    1. Zheng D, Liwinski T, Elinav E. Interaction between microbiota and immunity in health and disease. Cell Res. 2020;30:492–506. doi: 10.1038/s41422-020-0332-7. - DOI - PMC - PubMed
    1. Roswall J, et al. Developmental trajectory of the healthy human gut microbiota during the first 5 years of life. Cell Host Microbe. 2021;29:765–776.e3. doi: 10.1016/j.chom.2021.02.021. - DOI - PubMed
    1. Shao Y, et al. Stunted microbiota and opportunistic pathogen colonization in caesarean-section birth. Nature. 2019;574:117–121. doi: 10.1038/s41586-019-1560-1. - DOI - PMC - PubMed
    1. Ferretti P, et al. Mother-to-infant microbial transmission from different body sites shapes the developing infant gut microbiome. Cell Host Microbe. 2018;24:133–145.e5. doi: 10.1016/j.chom.2018.06.005. - DOI - PMC - PubMed

Publication types

LinkOut - more resources