. 2022 Sep 1;13(1):5136.
doi: 10.1038/s41467-022-32580-x.

Climate and land management accelerate the Brazilian water cycle

Affiliations

Climate and land management accelerate the Brazilian water cycle

Vinícius B P Chagas et al. Nat Commun. .

Abstract

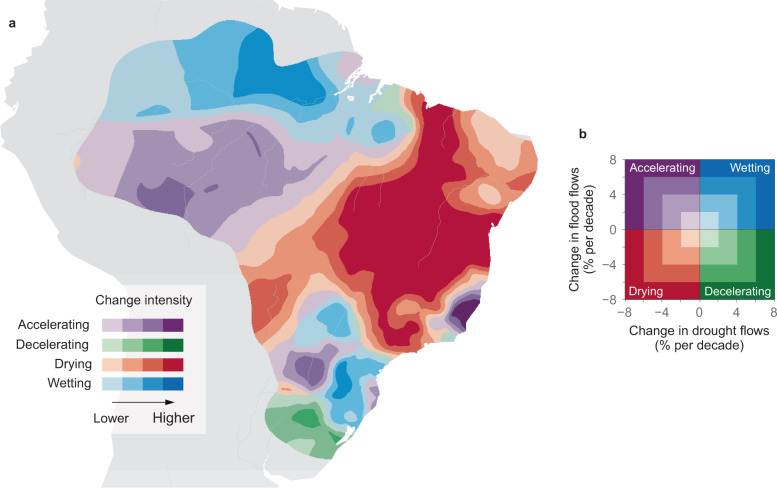
Increasing floods and droughts are raising concerns of an accelerating water cycle, however, the relative contributions to streamflow changes from climate and land management have not been assessed at the continental scale. We analyze streamflow data in major South American tropical river basins and show that water use and deforestation have amplified climate change effects on streamflow extremes over the past four decades. Drying (fewer floods and more droughts) is aligned with decreasing rainfall and increasing water use in agricultural zones and occurs in 42% of the study area. Acceleration (both more severe floods and droughts) is related to more extreme rainfall and deforestation and occurs in 29% of the study area, including southern Amazonia. The regionally accelerating water cycle may have adverse global impacts on carbon sequestration and food security.


Conflict of interest statement

The authors declare no competing interests.

Figures

Fig. 1
Fig. 1. Observed streamflow trends and their drivers in Brazil (1980–2015).
a Change in annual minimum 7-day streamflow (drought flows). b Change in annual maximum daily streamflow (flood flows). Blue and red indicate increasing and decreasing streamflow respectively (in % change relative to the long-term drought or flood flow, per decade). c, d Contributions to streamflow change in terms of coefficients of two panel regressions between streamflow (n = 25,682 for droughts and 27,299 for floods) and mean daily P – E (precipitation minus evaporation), annual minimum 90-day P – E, annual maximum 14-day P – E, and water use. A coefficient of 0.5 indicates that a 1% change in a particular driver leads on average to a 0.5% change in drought or flood flows. Error bars represent the standard error.
Fig. 2
Fig. 2. Streamflow trends and contributing drivers in four hotspots of change.
a Streamflow trends, with light grey boxes indicating minimum 7-day flows (drought flows), medium grey indicating mean flows, and dark grey indicating maximum daily flows (flood flows). b Climatic trends, with light blue boxes indicating minimum 90-day precipitation minus evaporation (P – E), medium blue indicating mean P – E, and dark blue indicating maximum 14-day P – E. c Water use trends in % of the long-term mean daily streamflow per decade. d Native vegetation cover trends in percentage points (p.p.) of the total area per decade. The boxplots represent the spatial variability of the local trends within each hotspot. e The hotspot locations (Northern Amazonia – NA, Southern Amazonia – SA, Southern Brazil – SB, and Brazilian Highlands – BH). Boxplots show the median value, the first and third quartiles, and 1.5 times the interquartile range. Outliers are not shown.
Fig. 3
Fig. 3. Classification of streamflow trends into accelerating, decelerating, wetting, and drying quadrants.
a Symbols without borders indicate flood and drought flow trends of n = 886 stations. Hotspots (Northern Amazonia – NA, Southern Amazonia – SA, Southern Brazil – SB, and Brazilian Highlands – BH) are indicated by colors. Symbols with borders represent the median trend of each hotspot, and the error bars indicate the median temporal uncertainty of the trend estimates. b Classification of regional trends, with darker colors indicating higher areal fraction per bin.
Fig. 4
Fig. 4. Trends of the drivers mapped on the quadrants of the accelerating, decelerating, wetting, and drying streamflow trends of Fig. 3b.
a Mean daily precipitation minus evaporation (P – E). b Maximum annual 14-day P – E. c Water use in % of the long-term mean daily flow per decade. d Native vegetation cover in percentage points (p.p.) of the total area per decade. Larger circles indicate higher areal fractions of trends. Colors indicate the average trends of the drivers for each bin. e Schematic of the main drivers of streamflow changes.
Fig. 5
Fig. 5. Spatial distribution of the accelerating, decelerating, wetting, and drying streamflow trends in Brazil.
a The location of the four quadrants of regional streamflow trends, with darker colors indicating larger change intensities. b Explanation of the color code of a. Accelerating water cycle has occurred in 29% of the region (2.7 million km2); deceleration in 4% (0.4 million km2); drying in 42% (3.9 million km2); and wetting in 25% (2.4 million km2).

References

    1. Field, C. B., Barros, V., Stocker, T. F. & Dahe, Q. Managing the risks of extreme events and disasters to advance climate change adaptation: special report of the intergovernmental panel on climate change. (Cambridge University Press, 2012).
    1. UNDRR. Global assessment report on disaster risk reduction: 2019. (UN Office for Disaster Risk Reduction, 2019).
    1. Schwalm CR, et al. Global patterns of drought recovery. Nature. 2017;548:202–205. doi: 10.1038/nature23021. - DOI - PubMed
    1. Winsemius HC, et al. Global drivers of future river flood risk. Nat. Clim. Change. 2016;6:381–385. doi: 10.1038/nclimate2893. - DOI
    1. Gudmundsson L, Leonard M, Do HX, Westra S, Seneviratne SI. Observed trends in global indicators of mean and extreme streamflow. Geophys. Res. Lett. 2019;46:756–766. doi: 10.1029/2018GL079725. - DOI

Publication types