. 2022 Sep 1;13(1):5135.
doi: 10.1038/s41467-022-32389-8.

SARS-CoV-2 vaccination induces mucosal antibody responses in previously infected individuals

Collaborators, Affiliations

SARS-CoV-2 vaccination induces mucosal antibody responses in previously infected individuals

Kaori Sano et al. Nat Commun. .

Abstract

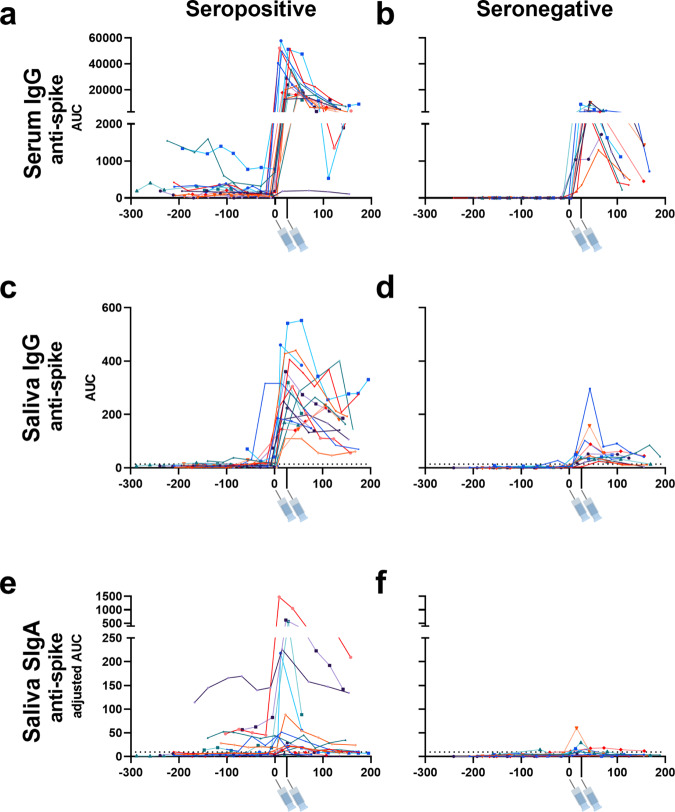
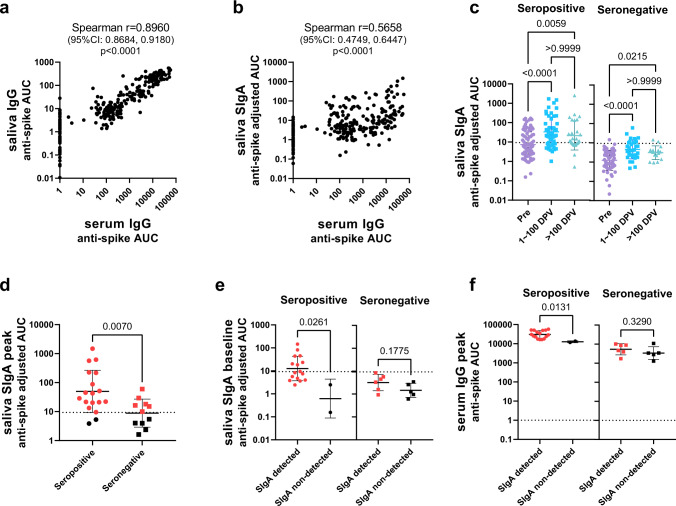
Immune responses at the respiratory mucosal interface are critical to prevent respiratory infections but it is unclear to what extent antigen specific mucosal secretory IgA (SIgA) antibodies are induced by mRNA vaccination in humans. Here we analyze paired serum and saliva samples from patients with and without prior coronavirus disease 2019 (COVID-19) at multiple time points pre and post severe acute respiratory syndrome coronavirus 2 (SARS-CoV-2) mRNA vaccination. Our results suggest mucosal SIgA responses induced by mRNA vaccination are impacted by pre-existing immunity. Indeed, vaccination induced a minimal mucosal SIgA response in individuals without pre-exposure to SARS-CoV-2 while SIgA induction after vaccination was more efficient in patients with a history of COVID-19.


Conflict of interest statement

The Icahn School of Medicine at Mount Sinai has filed patent applications relating to SARS-CoV-2 serological assays and NDV-based SARS-CoV-2 vaccines which list F.K. as co-inventor. V.S. is also listed on the serological assay patent application as co-inventor. Mount Sinai has spun out a company, Kantaro, to market serological tests for SARS-CoV-2. F.K. has consulted for Merck and Pfizer (before 2020) and is currently consulting for Pfizer, Seqirus, Third Rock Ventures, and Avimex. The Krammer laboratory is also collaborating with Pfizer on animal models of SARS-CoV-2. The remaining authors declare no competing interests.

Figures

Fig. 1
Fig. 1. Time course of vaccine-induced serum and mucosal anti-SARS-CoV-2 antibody titers in adult participants with or without previous SARS-CoV-2 infection.
Anti-SARS-CoV-2 spike IgG titers in serum (a, b), anti-SARS-CoV-2 spike IgG titers in saliva (c, d), and anti-SARS-CoV-2 spike SIgA titers in saliva (e, f) collected from 18 individuals with previous SARS-CoV-2 infection (seropositive) and 11 individuals without previous SARS-CoV-2 infection (seronegative) prior to and after vaccination. 6–13 different timepoints were assessed per individual. X-axis values represent days post-first vaccination and Y-axis values represent antibody titers calculated as area under the curve (AUC). Syringe symbols point to the approximate time when the first and second vaccine dose were administered (28 days for Moderna mRNA-1273 vaccine and 21 days for the Pfizer-BioNTech BNT162b2 vaccine). Dotted lines are cut-off values (mean+3 SD of the AUC of samples from seronegative individuals before vaccination). Different colors represent different individuals. This data is also presented on a logarithmic scale in Supplementary Fig. 1. Source data are provided as a Source Data file.
Fig. 2
Fig. 2. Mucosal SIgA antibody response to vaccination in adult participants with or without previous SARS-CoV-2 infection.
a, b Correlation between anti-spike serum IgG antibody titers and saliva IgG antibody titers (a) or mucosal SIgA antibody titers (b) of samples collected from both seropositive and seronegative individuals at all time points. A total of 264 data points (6–13 data points per individual) were plotted for each panel. X and Y-axis values represent antibody titers (AUC: area under the curve). Spearman correlation coefficient and p values (two-tailed) are labeled above graphs. c Comparison of anti-SARS-CoV-2 spike SIgA titers in saliva between samples collected during different timepoints: before first vaccination (Pre, 91 samples in seropositive group and 62 samples in seronegative group), 1–100 days post first vaccination (1–100 DPV, 50 samples in seropositive group and 32 samples in seronegative group), and over 100 days post first vaccination (>100 DPV, 28 samples in seropositive group and 16 samples in seronegative group). Antibody titers (adjusted AUC) are plotted for each group. (statistical test: one-way ANOVA with Kruskal–Wallis test, p values above brackets). d Comparison of peak anti-SARS-CoV-2 spike mucosal SIgA titers between seropositive and seronegative individuals. The highest anti-spike SIgA titer among all timepoints (the peak saliva SIgA adjusted AUC) was plotted per individual (18 in the seropositive group and 11 in the seronegative group). Red dots (16 in the seropositive group and 6 in the seronegative group) indicate individuals with peak SIgA titers above the cut-off value (SIgA detected). e Comparison of baseline pre-vaccination anti-SARS-CoV-2 spikes SIgA titers in saliva between SIgA detected (16 in seropositive group and 6 in seronegative group) and SIgA non-detected (2 in seropositive group and 5 in seronegative group) seropositive and seronegative individuals. f Comparison of peak anti-SARS-CoV-2 spike IgG titers in serum of SIgA detected or SIgA non-detected seropositive and seronegative individuals. Mann–Whitney test was used in (df) (p-value (two-tailed) above bracket). All scatter plots in this figure are presented with geometric mean with geometric SD and a dotted line indicating the cut-off value (mean+3SD of the AUC of all samples collected from pre-vaccinated seronegative individuals). Source data are provided as a Source Data file.

References

    1. WHO Coronavirus (COVID-19) Dashboard. WHO Coronavirus (COVID-19) Dashboard with Vaccination Datahttps://covid19.who.int/ (WHO, accessed 13 July 2022).
    1. Martines RB, et al. Pathology and pathogenesis of SARS-CoV-2 associated with fatal coronavirus disease, United States, Vol. 26 (9)—September 2020—CDC. Emerg. Infect. Dis. 2020;26:2005–2015. doi: 10.3201/eid2609.202095. - DOI - PMC - PubMed
    1. Brandtzaeg P. Induction of secretory immunity and memory at mucosal surfaces. Vaccine. 2007;25:5467–5484. doi: 10.1016/j.vaccine.2006.12.001. - DOI - PubMed
    1. Suzuki T, et al. Relationship of the quaternary structure of human secretory IgA to neutralization of influenza virus. Proc. Natl Acad. Sci. USA. 2015;112:7809–7814. doi: 10.1073/pnas.1503885112. - DOI - PMC - PubMed
    1. Murphy BR, Clements ML. The systemic and mucosal immune response of humans to influenza A virus. Curr. Top. Microbiol. Immunol. 1989;146:107–116. - PubMed