. 2022 Sep 1;13(9):755.
doi: 10.1038/s41419-022-05178-w.

GSK3β is a critical, druggable component of the network regulating the active NOTCH1 protein and cell viability in CLL

Affiliations

GSK3β is a critical, druggable component of the network regulating the active NOTCH1 protein and cell viability in CLL

Filomena De Falco et al. Cell Death Dis. .

Abstract

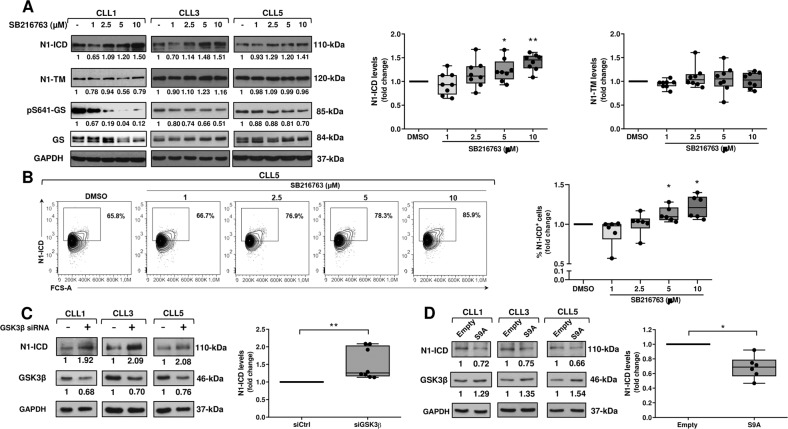
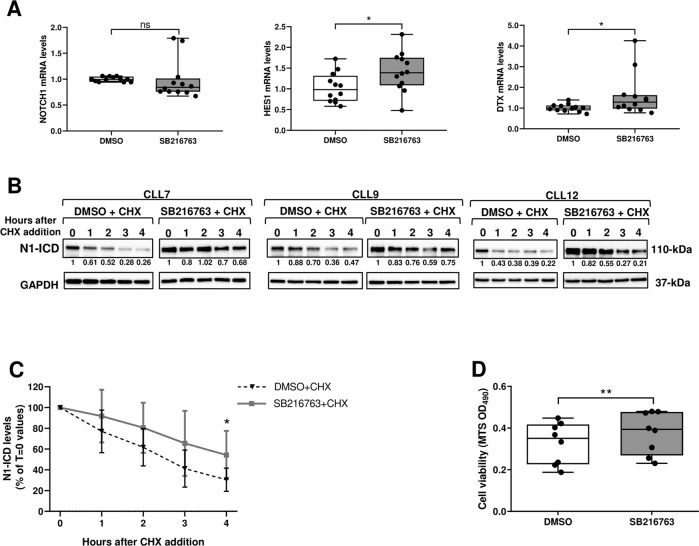
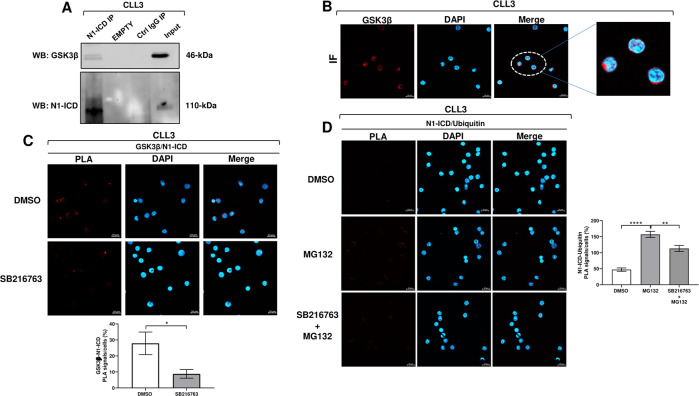
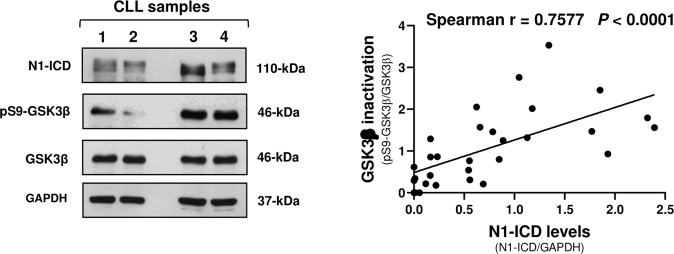
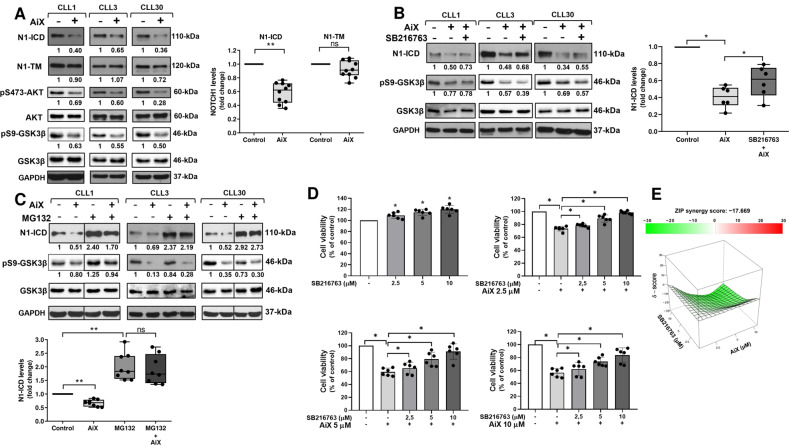
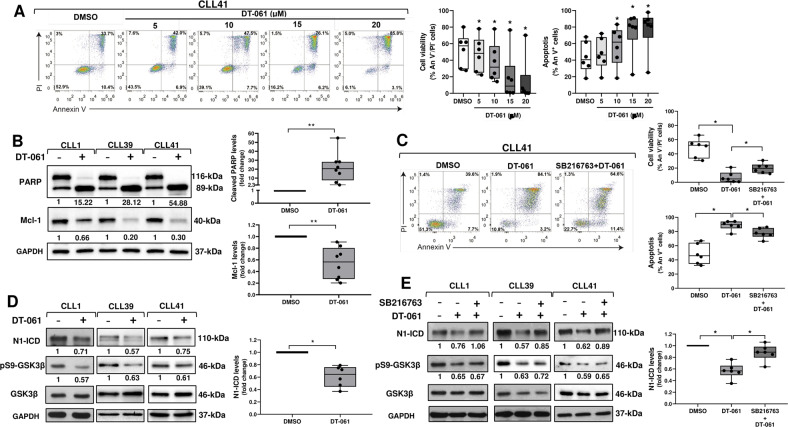
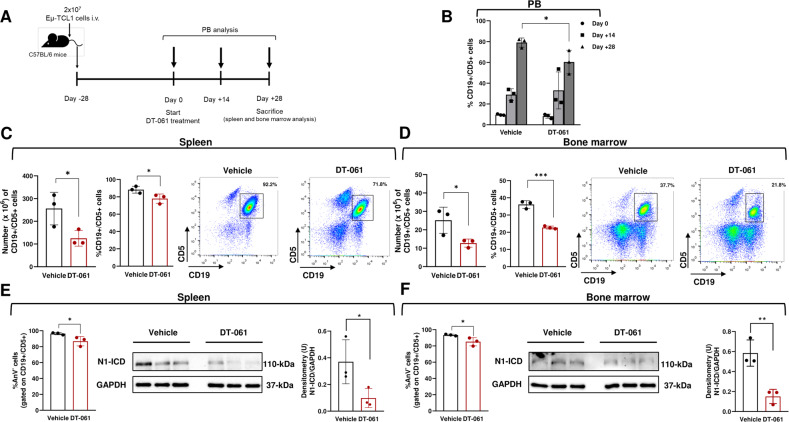
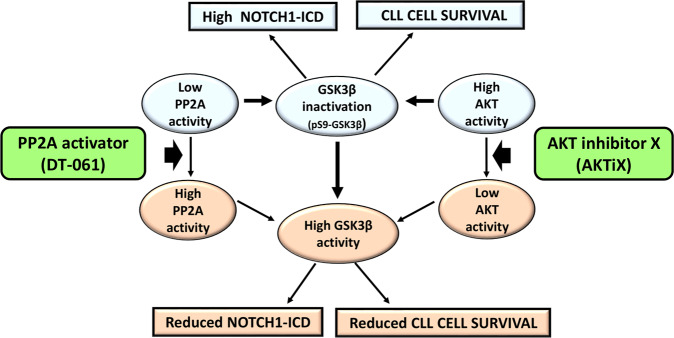
NOTCH1 alterations have been associated with chronic lymphocytic leukemia (CLL), but the molecular mechanisms underlying NOTCH1 activation in CLL cells are not completely understood. Here, we show that GSK3β downregulates the constitutive levels of the active NOTCH1 intracellular domain (N1-ICD) in CLL cells. Indeed, GSK3β silencing by small interfering RNA increases N1-ICD levels, whereas expression of an active GSK3β mutant reduces them. Additionally, the GSK3β inhibitor SB216763 enhances N1-ICD stability at a concentration at which it also increases CLL cell viability. We also show that N1-ICD is physically associated with GSK3β in CLL cells. SB216763 reduces GSK3β/N1-ICD interactions and the levels of ubiquitinated N1-ICD, indicating a reduction in N1-ICD proteasomal degradation when GSK3β is less active. We then modulated the activity of two upstream regulators of GSK3β and examined the impact on N1-ICD levels and CLL cell viability. Specifically, we inhibited AKT that is a negative regulator of GSK3β and is constitutively active in CLL cells. Furthermore, we activated the protein phosphatase 2 A (PP2A) that is a positive regulator of GSK3β, and has an impaired activity in CLL. Results show that either AKT inhibition or PP2A activation reduce N1-ICD expression and CLL cell viability in vitro, through mechanisms mediated by GSK3β activity. Notably, for PP2A activation, we used the highly specific activator DT-061, that also reduces leukemic burden in peripheral blood, spleen and bone marrow in the Eµ-TCL1 adoptive transfer model of CLL, with a concomitant decrease in N1-ICD expression. Overall, we identify in GSK3β a key component of the network regulating N1-ICD stability in CLL, and in AKT and PP2A new druggable targets for disrupting NOTCH1 signaling with therapeutic potential.


Conflict of interest statement

The authors declare no competing interests.

Figures

Fig. 1
Fig. 1. GSK3β modulation regulates N1-ICD levels in CLL cells.
A, B Primary CLL cells were cultured for 3 h with the indicated concentrations of SB216763 or DMSO as control. A Western blot analysis of NOTCH1 was performed using the anti-NOTCH1 (Val1744) and the anti-NOTCH1 (D1E11) antibodies, able to detect N1-ICD and N1-TM, respectively (n = 8). Protein loading was assessed using an anti-GAPDH antibody. Left, the values under each blot indicate the fold change in N1-ICD and N1-TM expression in SB216763-treated cells compared with control DMSO (set to 1), normalized to GAPDH levels. GSK3β activity inhibition by SB216763 was assessed by analyzing the glycogen synthase phosphorylation at Serine 641 (pS641-GS). The values under each blot indicate the fold change in pS641-GS levels in SB216763-treated cells compared with control DMSO (set to 1), normalized to levels of total GS. Three CLL samples are shown. Right, box and whisker plots with data points of densitometry analysis of N1-ICD and N1-TM, represented as fold change compared with control DMSO. *P < 0.05, **P < 0.01 according to Wilcoxon paired test. B Flow cytometric analysis of N1-ICD performed using the mouse anti-NOTCH1 (mN1A)-PE antibody (n = 6). Left, results are represented as the percentage of N1-ICD positive cells. N1-ICD positive gate was set based on staining with PE-mouse IgG isotype control. One CLL sample is shown. Right, box and whisker plots with data points of the percentage of N1-ICD positive cells, represented as fold change compared with control DMSO set to 1. *P < 0.05 according to Wilcoxon paired test. C CLL cells were transfected with control siRNA (siCtrl) or GSK3β siRNA (siGSK3β) (n = 8). Left, N1-ICD expression was analyzed as in panel A. Protein loading was assessed using an anti-GAPDH antibody. Silencing efficiency was assessed by Western blot analysis of GSK3β. The values under each blot indicate the fold change in N1-ICD and GSK3β levels in siGSK3β cells compared with siCtrl cells (set to 1), normalized to GAPDH levels. Three CLL samples are shown. Right, box and whisker plots with data points of densitometry analysis of N1-ICD, represented as fold change compared with siCtrl cells. **P < 0.01 according to Wilcoxon paired test. D CLL cells were transiently transfected with the pcDNA3.1 empty vector as control or the pcDNA3 plasmid containing the constitutively active GSK3β (GSK3β S9A) (n = 6). Left, N1-ICD expression was analyzed as in panel A. Protein loading was assessed using an anti-GAPDH antibody. Transfection efficiency was assessed by Western blot analysis of GSK3β. The values under each blot indicate the fold change in N1-ICD and GSK3β expression in S9A-transfected cells compared with empty vector-transfected cells (set to 1), normalized to GAPDH levels. Three CLL samples are shown. Right, box and whisker plots with data points of densitometry analysis of N1-ICD, represented as fold change compared with empty vector-transfected cells. *P < 0.05 according to Wilcoxon paired test.
Fig. 2
Fig. 2. Pharmacologic GSK3β inhibition enhances N1-ICD stability and CLL cell viability.
A Box and whisker plots with data points of real-time PCR analysis of NOTCH1, HES1 and DELTEX (DTX) mRNA in CLL cells cultured for 3 h with 5 μM SB216763 or DMSO as control (n = 12). mRNA levels were normalized to GAPDH and represented as fold change using control cells as a reference. *P < 0.05; ns, not significant, according to Wilcoxon paired test. B, C After pretreatment with 5 μM SB216763 or DMSO for 1.5 h, CLL cells were treated (T = 0) with 50 μg/ml CHX and harvested at the indicated times for Western blot analysis of N1-ICD and GAPDH, as a loading control (n = 6). B The values under the blots relative to each treatment indicate the fold change in N1-ICD expression at the different time points compared with the respective T = 0 (set to 1), normalized to GAPDH levels. Three CLL samples are shown. C N1-ICD bands were quantified by densitometry analysis, normalized to GAPDH and represented as percentage of T = 0 value set to 100%. Data are presented as the mean ± SD of 6 CLL samples. *P < 0.05 according to Wilcoxon paired test. D CLL cells were cultured for 18 h with 5 μM SB216763 or DMSO as control (n = 8). Cell viability was measured by MTS assay. Box and whisker plots with data points, expressed as optical density (OD) values, are shown. **P < 0.01 according to Wilcoxon paired test.
Fig. 3
Fig. 3. GSK3β interacts with N1-ICD in CLL cells and is involved in N1-ICD ubiquitination.
A N1-ICD was immunoprecipitated (IP) from whole-cell extracts of CLL cells, and the IP lysates were analyzed by Western blot with the anti-NOTCH1 (Val1744) to confirm IP of N1-ICD, and with the anti-GSK3β antibody to detect GSK3β/N1-ICD interaction (n = 3). One representative CLL is shown. B Confocal microscopy images of subcellular localization of GSK3β in a representative CLL sample. CLL cells (n = 3) were stained with the anti-GSK3β antibody (red) and with DAPI for nuclei (blue) and then analyzed by confocal microscopy, with a 63x oil immersion and 1.4 NA objective; scale bar, 10 μm. C, D PLA was performed by using rabbit anti-NOTCH1 (Val1744) and mouse anti-GSK3β antibodies to detect GSK3β/N1-ICD interactions in CLL cells cultured for 1.5 h with 5 µM SB216763 or DMSO (C; n = 3), and by using rabbit anti-NOTCH1 (Val1744) and mouse anti-ubiquitin antibodies to detect N1-ICD/Ubiquitin interactions in CLL cells cultured with 5 µM SB216763 or DMSO for 1.5 h, and with 10 µM MG132 for additional 4 h (D; n = 3). Nuclei were stained with DAPI. In the confocal microscopy images, red spots indicate GSK3β/N1-ICD (C) and N1-ICD/Ubiquitin (D) interactions. Images were acquired by using confocal microscopy with a 63x oil immersion and 1.4 NA objective; scale bar, 10 μm. One representative CLL is shown. In the bottom panel (C) and in the right panel (D), bar graphs ± SEM show quantitative analysis of the PLA signals of three samples. ****P < 0.0001; **P < 0.01; *P < 0.05 according to unpaired Student’s t-test.
Fig. 4
Fig. 4. Analysis of the correlation between N1-ICD and GSK3β inactivation levels in CLL cells.
Left, the expression of N1-ICD, pS9-GSK3β used as a marker of GSK3β inactivation status, total GSK3β, and GAPDH used as a loading control, was examined by Western blot analysis (n = 30). Four representative samples are shown. Right, quantification of N1-ICD bands, normalized to GAPDH levels, and of pS9-GSK3β bands normalized to total GSK3β levels, was performed by densitometric analysis. Correlation between N1-ICD and pS9-GSK3β expression values was assessed by using the Spearman’s correlation coefficient (r). P < 0.0001.
Fig. 5
Fig. 5. Pharmacologic AKT inhibition reduces N1-ICD levels and CLL cell viability by promoting GSK3β activity.
A CLL cells were cultured for 6 h with 5 μM AKTiX (AiX) or complete medium as control (n = 10). Western blot analysis of NOTCH1 was performed using the anti-NOTCH1 (Val1744) and the anti-NOTCH1 (D1E11) antibodies, able to recognize N1-ICD and N1-TM, respectively. Protein loading was assessed using an anti-GAPDH antibody. Left, the values under each blot indicate the fold change in N1-ICD and N1-TM levels in AiX-treated cells compared with control cells (set to 1), normalized to GAPDH levels. AKT Inhibition by AiX was verified by analyzing AKT phosphorylation at Serine 473 (pS473-AKT). The effect of AiX on GSK3β inactivation was assessed by analyzing pS9-GSK3β levels. The values under each blot indicate the fold change in pS473-AKT and pS9-GSK3β levels in AiX-treated cells compared with control cells (set to 1), normalized to levels of total AKT and total GSK3β, respectively. Three CLL samples are shown. Right, box and whisker plots with data points of densitometry analysis of N1-ICD and N1-TM, represented as fold change compared with controls. **P < 0.01; ns, not significant according to Wilcoxon paired test. B CLL cells were cultured for 1.5 h with 5 µM SB216763 or DMSO and for further 6 h with 5 µM AiX (n = 6). Western blot analysis of N1-ICD, pS9-GSK3β, total GSK3β and GAPDH was performed as in panel A. Left, the values under the blots indicate the fold change in N1-ICD and pS9-GSK3β levels in cells treated with AiX alone or AiX plus SB216763, compared with control cells (set to 1), normalized to levels of GAPDH and total GSK3β, respectively. Three CLL samples are shown. Right, box and whisker plots with data points of densitometry analysis of N1-ICD, represented as fold change compared with control. *P < 0.05 according to Wilcoxon paired test. C CLL cells were pretreated for 2 h with 10 μM MG132 or DMSO, and then cultured for further 6 h with or without 5 μM AiX (n = 8). Western blot analysis of N1-ICD, pS9-GSK3β, total GSK3β and GAPDH was performed as in panel A. Top, the values under the blots indicate the fold change in N1-ICD and pS9-GSK3β levels in cells treated with AiX, MG132, or AiX plus MG132, compared with control cells (set to 1), normalized to levels of GAPDH and total GSK3β, respectively. Three CLL samples are shown. Vertical lines inserted in CLL1 and CLL30 blots indicate repositioned gel lanes. Bottom, box and whisker plots with data points of densitometry analysis of N1-ICD, represented as fold change compared with control. **P < 0.01; ns, not significant according to Wilcoxon paired test. D, E CLL cells were cultured with or without different concentrations of AiX (2.5, 5 and 10 µM) or SB216763 (2.5, 5 and 10 µM) alone or in combinations (n = 6). After 18 h, cell viability was measured by MTS assay. D Bar graphs with data points of cell viability (mean ± SD) in treated cells compared with untreated controls, set to 100%. *P < 0.05 according to Wilcoxon paired test. E The antagonism between SB216763 and AiX was calculated by using the SynergyFinder web application and the results were produced with ZIP Synergy model (green indicates an antagonistic effect, white an additive effect, and red a synergistic effect).
Fig. 6
Fig. 6. The PP2A activator DT-061 reduces N1-ICD levels and CLL cell survival in vitro by promoting GSK3β activity.
A CLL cells were treated for 24 h with the indicated concentrations of DT-061 or DMSO as control (n = 6). Cell viability and apoptosis were evaluated by flow cytometric analysis of Annexin V/PI (An V/PI) double staining. Left, results are represented as the percentage of viable (An V-/PI-), early apoptotic (An V+/PI-), late apoptotic (An V+/PI+), and necrotic (An V-/PI+) cells. One CLL sample is shown. Middle and right, box and whisker plots with data points of the percentage of viable An V-/PI- (middle) and apoptotic An V+ (An V+/PI- plus An V+/PI+) cells (right) are shown. *P < 0.05 according to Wilcoxon paired test. B Western blot analysis of PARP and Mcl-1 was performed in CLL cells cultured for 24 h with 15 μM DT-061 or DMSO as control (n = 8). GAPDH was analyzed as loading control. Left, the values under the blots indicate the fold change in cleaved PARP (89-kDa) and Mcl-1 levels in DT-061-treated cells compared with control DMSO (set to 1), normalized to levels of full length PARP (116-kDa) and GAPDH, respectively. Three CLL samples are shown. Right, box and whisker plots with data points of densitometry analysis of cleaved PARP (top panel) and Mcl-1 (bottom panel), represented as fold change compared with control DMSO. **P < 0.01 according to Wilcoxon paired test. C CLL cells were cultured for 24 h with 15 µM DT-061 as single agent and in combination with 5 µM SB216763, or with DMSO as control (n = 6). Cell viability and apoptosis data were obtained and represented as in panel A. Left, one CLL sample is shown. Right, box and whisker plots with data points of the percentage of viable An V-/PI- (top panel) and apoptotic An V+ (An V+/PI- plus An V+/PI+) cells (bottom panel) are shown. *P < 0.05 according to Wilcoxon paired test. D Western blot analysis of N1-ICD was performed in CLL cells cultured for 3 h with 15 μM DT-061 or DMSO as control (n = 6). GAPDH was analyzed as loading control. The effect of DT-061 on GSK3β inactivation was assessed by analyzing pS9-GSK3β levels. Left, the values under the blots indicate the fold change in N1-ICD and pS9-GSK3β levels in cells treated with DT-061 compared with control DMSO (set to 1), normalized to levels of GAPDH and total GSK3β, respectively. Three CLL samples are shown. Right, box and whisker plots with data points of densitometry analysis of N1-ICD, represented as fold change compared with control DMSO. *P < 0.05 according to Wilcoxon paired test. E Western blot analysis of N1-ICD and pS9-GSK3β was performed in CLL cells pretreated for 1.5 h with 5 μM SB216763 or DMSO, and then cultured for further 3 h with 15 μM DT-061 (n = 6). GAPDH was analyzed as loading control. Left, the values under the blots indicate the fold change in N1-ICD and pS9-GSK3β levels in cells treated with DT-061 alone or DT-061 plus SB216763, compared with control DMSO (set to 1), normalized to levels of GAPDH and total GSK3β, respectively. Three CLL samples are shown. Right, box and whisker plots with data points of densitometry analysis of N1-ICD, represented as fold change compared with control DMSO. *P < 0.05 according to Wilcoxon paired test.
Fig. 7
Fig. 7. DT-061 exerts antileukemic activity and reduces N1-ICD expression in the Eµ-TCL1 mouse model of CLL.
A A schematic outline of the treatment schedule is shown. Eμ-TCL1 cells were transplanted into C57BL/6 mice by intravenous (i.v.) injection. Twenty-eight days after transplantation (day 0), treatment started with DT-061 (5 mg/kg once daily for 28 days via oral gavage; n = 3) or vehicle (n = 3). Peripheral blood (PB) was harvested at the start of treatment (day 0), and at day +14 and day +28 from the start of the treatment. At day +28, mice were sacrificed, and spleen and bone marrow were collected. B The bar graphs with data points indicate the percentage of CD19+/CD5+ cells in PB from DT-061- and vehicle-treated mice, determined by flow cytometry. Data are presented as the mean ± SD of 3 mice per group. *P < 0.05 according to unpaired Student’s t-test. C, D The bar graphs with data points indicate the number (left) and the percentage (middle) of CD19+/CD5+ cells in the spleen (C) and bone marrow (D) from DT-061- and vehicle-treated mice, determined by flow cytometry. Data are presented as the mean ± SD of 3 mice per group.*P < 0.05; ***P < 0.001 according to unpaired Student’s t-test. One representative dot plot of CD19/CD5 staining relative to each treatment is shown (right). E, F Left, bar graphs with data points indicate the percentage of viable Annexin V (An V) cells in CD19+/CD5+ sorted from the spleen (E) and bone marrow (F) of DT-061- and vehicle-treated mice. Data are presented as the mean ± SD of 3 mice per group. *P < 0.05 according to unpaired Student’s t-test. Middle, Western blot analysis of N1-ICD in CD19+/CD5+ cells sorted from the spleen (E) and bone marrow (F) of DT-061- and vehicle-treated mice performed using the anti-NOTCH1 Val1744 antibody. Right, bar graphs with data points of densitometric analysis of N1-ICD are shown. *P < 0.05; **P < 0.01 according to unpaired Student’s t-test.
Fig. 8
Fig. 8. Schematic representation of the signaling network sustaining NOTCH1-ICD levels and cell survival in CLL, as a potential therapeutic target.
Constitutive NOTCH1-ICD levels and CLL cell survival are sustained by GSK3β inactivation, due to an impaired PP2A activity and a high AKT activation, which both induce S9-GSK3β phosphorylation (pS9-GSK3β). The increase in PP2A activity induced by the highly specific activator DT-061 or the inhibition of AKT with the AKTiX inhibitor enhance GSK3β activity, leading to a decrease in NOTCH1-ICD levels with a concomitant reduction in CLL cell survival.

References

    1. Chiorazzi N, Rai KR, Ferrarini M. Chronic lymphocytic leukemia. N. Engl J Med. 2005;352:804–15. doi: 10.1056/NEJMra041720. - DOI - PubMed
    1. Fabbri G, Dalla-Favera R. The molecular pathogenesis of chronic lymphocytic leukaemia. Nat Rev Cancer. 2016;16:145–62. doi: 10.1038/nrc.2016.8. - DOI - PubMed
    1. Bosch F, Dalla-Favera R. Chronic lymphocytic leukaemia: from genetics to treatment. Nat Rev Clin Oncol. 2019;16:684–701. doi: 10.1038/s41571-019-0239-8. - DOI - PubMed
    1. Rosati E, Baldoni S, De Falco F, Del Papa B, Dorillo E, Rompietti C, et al. NOTCH1 aberrations in chronic lymphocytic leukemia. Front Oncol. 2018;8:229. doi: 10.3389/fonc.2018.00229. - DOI - PMC - PubMed
    1. Rosati E, Sabatini R, Rampino G, Tabilio A, Di Ianni M, Fettucciari K, et al. Constitutively activated Notch signaling is involved in survival and apoptosis resistance of B-CLL cells. Blood. 2009;113:856–65. doi: 10.1182/blood-2008-02-139725. - DOI - PubMed

Publication types

MeSH terms