. 2022 Sep 1;12(1):358.
doi: 10.1038/s41398-022-02136-0.

Microstructural imaging and transcriptomics of the basal forebrain in first-episode psychosis

Affiliations

Microstructural imaging and transcriptomics of the basal forebrain in first-episode psychosis

Min Tae M Park et al. Transl Psychiatry. .

Abstract

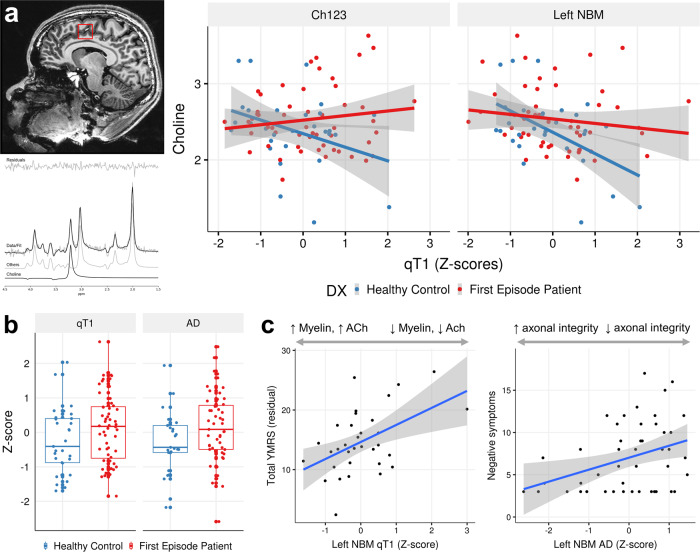
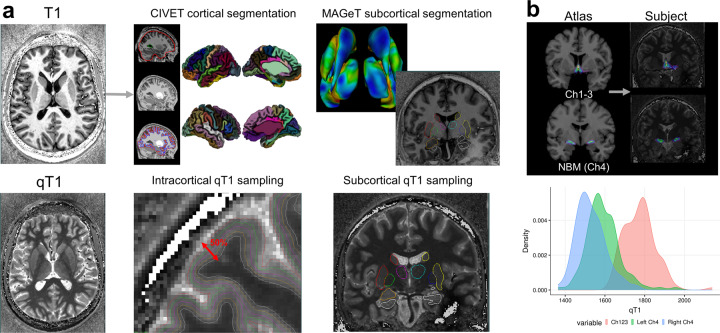
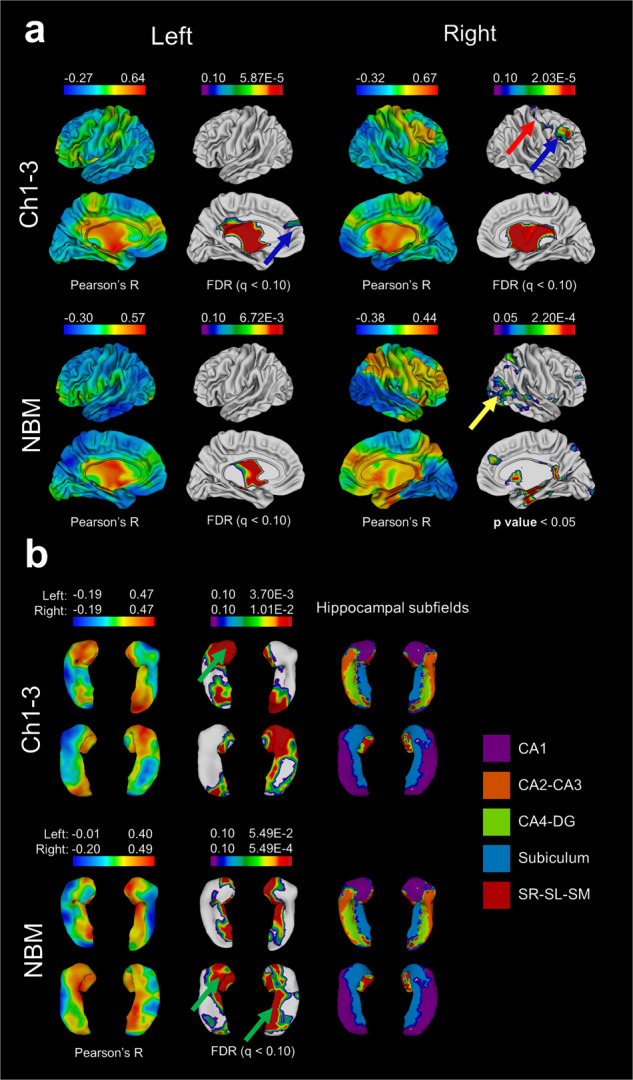
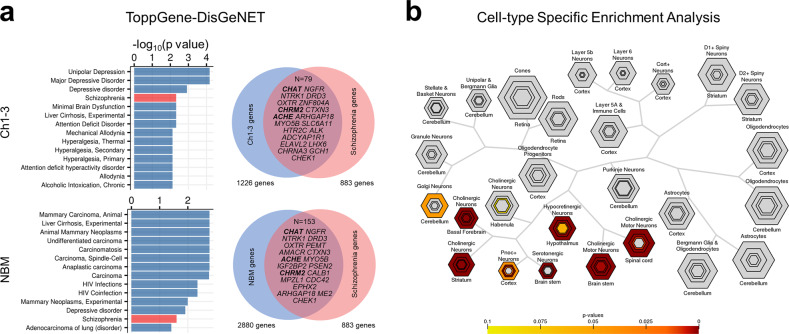
Cholinergic dysfunction has been implicated in the pathophysiology of psychosis and psychiatric disorders such as schizophrenia, depression, and bipolar disorder. The basal forebrain (BF) cholinergic nuclei, defined as cholinergic cell groups Ch1-3 and Ch4 (Nucleus Basalis of Meynert; NBM), provide extensive cholinergic projections to the rest of the brain. Here, we examined microstructural neuroimaging measures of the cholinergic nuclei in patients with untreated psychosis (~31 weeks of psychosis, <2 defined daily dose of antipsychotics) and used magnetic resonance spectroscopy (MRS) and transcriptomic data to support our findings. We used a cytoarchitectonic atlas of the BF to map the nuclei and obtained measures of myelin (quantitative T1, or qT1 as myelin surrogate) and microstructure (axial diffusion; AxD). In a clinical sample (n = 85; 29 healthy controls, 56 first-episode psychosis), we found significant correlations between qT1 of Ch1-3, left NBM and MRS-based dorsal anterior cingulate choline in healthy controls while this relationship was disrupted in FEP (p > 0.05). Case-control differences in qT1 and AxD were observed in the Ch1-3, with increased qT1 (reflecting reduced myelin content) and AxD (reflecting reduced axonal integrity). We found clinical correlates between left NBM qT1 with manic symptom severity, and AxD with negative symptom burden in FEP. Intracortical and subcortical myelin maps were derived and correlated with BF myelin. BF-cortical and BF-subcortical myelin correlations demonstrate known projection patterns from the BF. Using data from the Allen Human Brain Atlas, cholinergic nuclei showed significant enrichment for schizophrenia and depression-related genes. Cell-type specific enrichment indicated enrichment for cholinergic neuron markers as expected. Further relating the neuroimaging correlations to transcriptomics demonstrated links with cholinergic receptor genes and cell type markers of oligodendrocytes and cholinergic neurons, providing biological validity to the measures. These results provide genetic, neuroimaging, and clinical evidence for cholinergic dysfunction in schizophrenia.


Conflict of interest statement

LP receives book royalties from Oxford University Press, editorial stipend from the Canadian Medical Association Journal and income from the SPMM MRCPsych course. LP has received investigator-initiated educational grants from Otsuka, Janssen and Sunovion Canada (2017) and speaker fee from Otsuka and Janssen Canada (2019), and Canadian Psychiatric Association (2019). LP, MM, and KD received support from Boehringer Ingelheim to attend an investigator meeting in 2017. JT received speaker honoraria from Siemens Healthcare Canada. LF owns shares in and has received consulting fees from Cortexyme. All other authors declare no competing interests.

Figures

Fig. 1
Fig. 1. Evidence for microstructural changes of the basal forebrain in FEP.
a Left: Magnetic resonance spectroscopy of choline in the dACC with example of voxel placement (top), and spectral fit for choline (bottom). Right: In FEP, there is decoupling of the correlation between qT1 and choline levels, while a significant correlation exists in healthy controls such that lower qT1 (higher myelin) is associated with elevated choline levels. b In the Ch1-3, there is increased qT1 (lower myelin), and increased axial diffusivity. c Higher qT1 (indicating lower myelin) of the left NBM is associated with greater manic symptom severity, and increased AxD (reflecting lower axonal integrity) is associated with negative symptom severity. Left: y-axis shows residuals of the linear regression (YMRS ~ cannabis use) added to the mean YMRS score.
Fig. 2
Fig. 2. Image preprocessing of cortical, subcortical, and basal forebrain structures.
a qT1 and T1-weighted MRI data at 7T were acquired using the MP2RAGE sequence. The CIVET pipeline (version 2.1.0) was used to delineate the cortical surfaces and sampling at multiple depths, and we sample qT1 measures at 50% depth from the pial to white matter surface. Subcortical qT1 sampling along MAGeT Brain-generated structures (hippocampus, amygdala, striatum, thalamus, globus pallidum). b Mapping probabilistic atlas based on cytoarchitectonic data of the basal forebrain structures onto individual subjects through non-linear registration. Histogram shows group distribution of qT1 values for the three structures—Ch1-3, left and right Ch4 (NBM).
Fig. 3
Fig. 3. NBM-cortical and NBM-hippocampal qT1 correlations.
Warm colours (red) indicate most positive correlations, and cool colours (blue) negative correlations for each set of surfaces. Regions surviving FDR correction are displayed, while for the right NBM-cortical correlations no regions survived FDR correction at q < 0.10, and thus subthreshold findings at p < 0.05 are shown instead. a NBM-cortical qT1 correlations. Findings are consistent with the hypothesis with strongest (most positive) correlations reflecting cortical regions receiving the most consistent afferent projections the BF, and those regions with cortical cholinergic neurons. These include the frontal (blue arrow), sensory/motor cortices (yellow arrow). b NBM-hippocampal qT1 correlations—for the hippocampus, CA1-subiculum demonstrate strongest correlations (green arrow).
Fig. 4
Fig. 4. Transcriptomic analysis of the basal forebrain structures.
a Enrichment of schizophrenia related genes. Venn diagram shows overlap between genes highly expressed in Ch1-3 and NBM with schizophrenia-related genes based on DisGeNET. Bolded genes are associated with cholinergic function (CHAT, ACHE, CHRM2). b CSEA of genes passing FDR (q < 0.10) shows enrichment for cholinergic neurons in the Ch1-3. Coloured cell types indicate significance after multiple testing correction (FDR q < 0.10). Hexagon sizes indicate cell-type specificity at varying specificity index probability (pSI) statistic thresholds from 0.05 to 1e−4, such that the outer hexagons indicate the least specific test for a cell type (pSI threshold 0.05) while the innermost hexagon indicates the most specific test for a cell type (pSI 1e−4).
Fig. 5
Fig. 5. Using transcriptomics to explain neuroimaging correlations.
a Coloured cortical surface (left) shows Pearson’s R correlations between Ch1-3 qT1 and intracortical qT1. On the right surface, 1236 AHBA cortical samples assigned to a unique vertex are shown. Using a mixed effects model, we sought to explain BF-cortical correlations by gene expression with donor as a random factor. b Top: Volcano plot with distribution of t-statistics (x-axis), with dotted line indicating significance at FDR q < 0.05. Labelled genes are cholinergic receptor genes significant after FDR correction, for the Ch1-3 (left) and NBM (right). Bottom: example of imaging-genetic correlations for 2 of the most significant genes. c CSEA of the top 10% (highly expressed in regions with positive NBM-cortical correlations) and bottom 10% genes (highly expressed in regions with negative NBM-cortical correlations) highlights relative enrichment of glial cells in regions with positive imaging correlations.
Fig. 6
Fig. 6. Summary of neuroimaging, clinical, and transcriptomics analyses.
(1) Clinical sample neuroimaging results examining case-control differences in microstructure, structure-MRS relationships, and clinical correlates of microstructure. We found increased qT1 and AxD in FEP compared to healthy controls (HC). In HC, there was a significant correlation between qT1 (left NBM) and MRS choline, while left NBM was related to negative (AxD) and manic symptom (qT1) burden. (2) Validation of basal forebrain microstructure measures using qT1 covariance between cortical and subcortical regions, and further external validation of cortical covariance by correlating with gene expression using the Allen Human Brain Atlas. Genes outlined are cholinergic receptor genes most positively associated with BF covariance for Ch1-3 and NBM, surviving FDR correction.

References

    1. Sarter M, Lustig C, Taylor SF. Cholinergic contributions to the cognitive symptoms of schizophrenia and the viability of cholinergic treatments. Neuropharmacology. 2012;62:1544–53. doi: 10.1016/j.neuropharm.2010.12.001. - DOI - PMC - PubMed
    1. Caton M, Ochoa ELM, Barrantes FJ. The role of nicotinic cholinergic neurotransmission in delusional thinking. NPJ Schizophr. 2020;6:16. doi: 10.1038/s41537-020-0105-9. - DOI - PMC - PubMed
    1. Tandon R. Cholinergic aspects of schizophrenia. Br J Psychiatry Suppl. 1999;37:7–11. doi: 10.1192/S0007125000293586. - DOI - PubMed
    1. Tandon R, Greden JF, Haskett RF. Cholinergic hyperactivity and negative symptoms: Behavioral effects of physostigmine in normal controls. Schizophr Res. 1993;9:19–23. doi: 10.1016/0920-9964(93)90004-3. - DOI - PubMed
    1. Tandon R, Greden JF, Silk KR. Treatment of negative schizophrenic symptoms with trihexyphenidyl. J Clin Psychopharmacol. 1988;8:212–5. doi: 10.1097/00004714-198806000-00012. - DOI - PubMed

Publication types

MeSH terms

Substances