. 2022 Sep 1;12(1):14899.
doi: 10.1038/s41598-022-18876-4.

Pla2g2a promotes innate Th2-type immunity lymphocytes to increase B1a cells

Affiliations

Pla2g2a promotes innate Th2-type immunity lymphocytes to increase B1a cells

Susan A Shinton et al. Sci Rep. .

Abstract

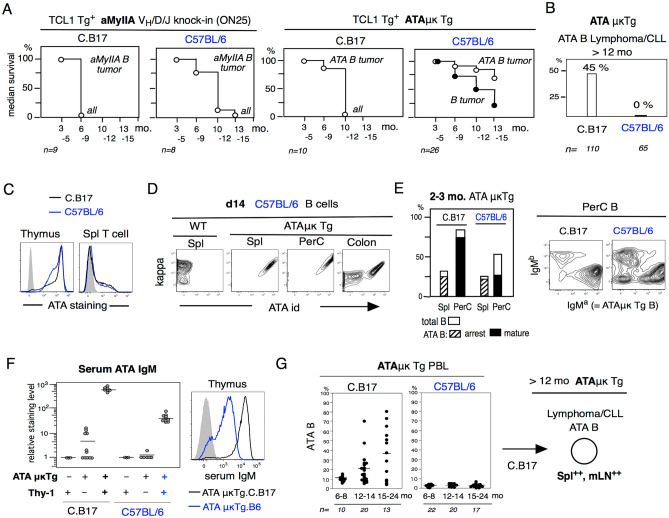
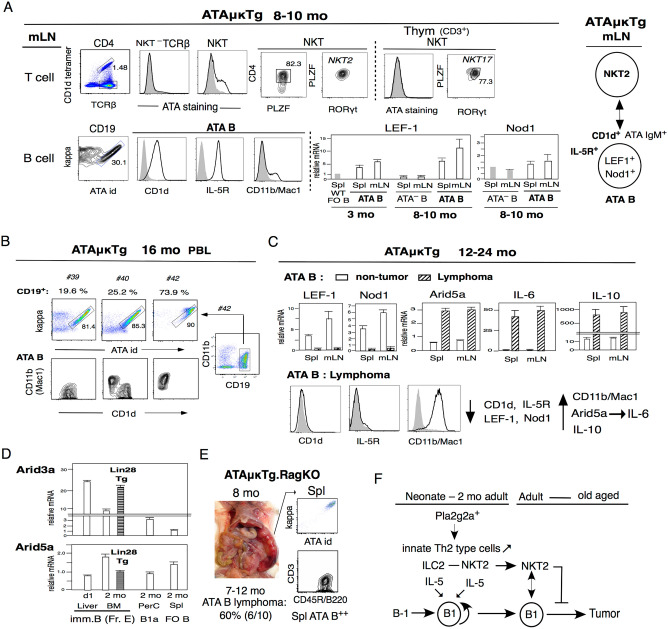
Newborns require early generation of effective innate immunity as a primary physiological mechanism for survival. The neonatal Lin28+Let7- developmental pathway allows increased generation of Th2-type cells and B1a (B-1 B) cells compared to adult cells and long-term maintenance of these initially generated innate cells. For initial B1a cell growth from the neonatal to adult stage, Th2-type IL-5 production from ILC2s and NKT2 cells is important to increase B1a cells. The Th17 increase is dependent on extracellular bacteria, and increased bacteria leads to lower Th2-type generation. Secreted group IIA-phospholipase A2 (sPLA2-IIA) from the Pla2g2a gene can bind to gram-positive bacteria and degrade bacterial membranes, controlling microbiota in the intestine. BALB/c mice are Pla2g2a+, and express high numbers of Th2-type cells and B1a cells. C57BL/6 mice are Pla2g2a-deficient and distinct from the SLAM family, and exhibit fewer NKT2 cells and fewer B1a cells from the neonatal to adult stage. We found that loss of Pla2g2a in the BALB/c background decreased IL-5 from Th2-type ILC2s and NKT2s but increased bacterial-reactive NKT17 cells and MAIT cells, and decreased the number of early-generated B1a cells and MZ B cells and the CD4/CD8 T cell ratio. Low IL-5 by decreased Th2-type cells in Pla2g2a loss led to low early-generated B1a cell growth from the neonatal to adult stage. In anti-thymocyte/Thy-1 autoreactive μκ transgenic (ATAμκ Tg) Pla2g2a+ BALB/c background C.B17 mice generated NKT2 cells that continuously control CD1d+ B1 B cells through old aging and lost CD1d in B1 B cells generating strong B1 ATA B cell leukemia/lymphoma. Pla2g2a-deficient ATAμκTg C57BL/6 mice suppressed the initial B1a cell increase, with low/negative spontaneous leukemia/lymphoma generation. These data confirmed that the presence of Pla2g2a to control bacteria is important to allow the neonatal to adult stage. Pla2g2a promotes innate Th2-type immunity lymphocytes to increase early generated B1a cells.


Conflict of interest statement

The authors declare no competing interests.

Figures

Figure 1
Figure 1
Low and negative B-1 derived lymphoma/CLL generation in C57BL/6 mice.B-1 derived aMyIIA B cells in aMyIIA KI mice and ATA B cells in ATAμκ Tg mice in C.B17 and C57BL/6 backgrounds. (A) CLL/lymphoma in aMyIIA KI and ATAμκTg mice crossed with Eμ-hTCL1 Tg mice for the aMyIIA B and ATA B tumor generation stages. (B) Spontaneous (TCL1Tg) ATA B lymphoma/CLL generation in > 12 mo mice in the C.B17 background versus negative in C57BL/6 mice. (C) ATA IgM (IgMa+) staining of T cells in C.B17 and C57BL/6 mice. (D) Early generation of ATA B cells in d14 ATAμκTg mice. C57BL/6 mice. (E) In the 2–3 mo adult stage, there were fewer total B cells and ATA B cells in the PerC of C57BL/6 mice than in C.B17 mice. In the PerC, the number of non-ATA B cells with endogenous IgMb+ B cells was increased in C57BL/6 mice. (F) Serum ATA IgM in 2–3 mo C.B17 and C57BL/6 mice crossed with ATAμκTg or ATAμκTg with Thy-1, and ATAμκTg wild type. Serum ATA IgM from ATAμκTg mice stained with C.B17 thymus. (G) Serum ATA B cells in PBLs from the 6 mo to 24 mo stage in C.B17 and C57BL/6 ATAμκTg mice. > 12 mo, generation of ATA B lymphoma (Spl++, mLN++) in ATAμκTg.C.B17 mice as previously reported.
Figure 2
Figure 2
Pla2g2a loss leads to reduced IL-5. Bach2lo allows IgM and IgA secretion and the presence of IL-5 allows IL-5R+ B1a cell growth and differentiation, as described in (B). (A) Analysis of early-generated B1a cell Bach2 levels. Left: Bach2 qRT-PCR of B-lineage 1d liver pre B (Fr.D) and immature B (Fr. E; B220+ IgM+ AA4.1+) and 2 mo BM pre B and imm. B with spleen imm. B (AA4+), FO B, B1a cells, and PerC B1a cells in C.B17 (n = 5 each; mean ± SE). Bach2 RT-PCR compared with β-actin. Right: Bach2 qRT-PCR in Fr. E in wild type versus Arid3a KO mice in 1d liver, and wild-type versus Arid3a Tg in 2 mo BM (n = 3 each; mean ± SE). (B) Arid3a++ outcomes are Bach2low and increased Bhlhe41. Bhlhe41hi leads to an IL-5Ra increase in B1a cells, with an IL-5-IL-5R reaction. (C) Left: 2 mo intestine ILC (CD3CD19 IL7Ra+ ) cell analysis by BALB/c and C57BL/6 mice in PP, with Thy-1, IL-2Ra, and RORγt (ILC3). ILCs were 36% in BALB/c mice and 17% in C57BL/6 mice in the CD3-CD9- population. Right: Thy-1 ILCs in PP and LPC in the intestine and in mLNs in BALB/c mice. (D) IL-5 mRNA analysis of IL7Ra+ ILCs in PPs and mLNs between Pla2g2a + / + and –/– BALB/c mice (n = 3 each; mean ± SE). + / + mice were used as the control. (E) IL-5 analysis from PP CD3-CD19- cells with IL-2 + IL-25 and IL-2 + IL-33 stimulation in Pla2g2a + / + , + /–. –/– mice (n = 3 each; mean ± SE), and BALB/c versus C57BL/6 mice (n = 2; mean ± SE). mLN CD3+ T cells stimulated IL-2 + IL-33 in these mice. Nonstimulated outcome (-) is the control. (F) Pa2g2a–/– decreased IL-5 production.
Figure 3
Figure 3
Pla2g2a loss alters B1a, MZ B, and the CD4/CD8 T cell ratio. BALB/c, VH11KI, and ATAμκTg mice under Pla2g2a + / + , + /–, –/– backgrounds were subjected to analysis for B and T cells. The majority of data showed the mean ± SE, and some showed individual data with mean percentages and + / + vs –/– P-values as calculated by t-test. (A) B (CD19+) and T (CD3+) cell analysis of 3 wk Pla2g2a + / + , + /–. –/– mice (n = 5 each). For + / + vs –/–: Spl B1a; P = 0.429, mLN B1a; P = 0.035. Spl CD4+ T; P = 0.0015, Spl CD8+ T; P = 0.0002. (B) B and T cell analysis of 2 mo Pla2g2a + / + , + /–, –/– mice and wild-type BALB/c and C57BL/6 mice. For B cell spleen and PerC analysis (n = 5 each). For + / + vs –/–: Spl: immature B; P = 0.041, MZ B; P = 0.0085, PerC: aPtC B; P = 0.054, aPC B; P = 0.051. For T cell, CD4+ T cells in the spleen and mLN analysis (BALB/c and C57BL/6; n = 8 each, + / + ; n = 10, + /–; n = 8, –/–; n = 10). CD8+ T cells (BALB/c and C57BL/6; n = 5 each, + / + ; n = 7, + /–; n = 6, –/–; n = 6). For + / + vs –/–: Spl: CD4+T; P = 0.0139, CD8+T; P = 0.047. (C) 2 mo VH11KI.Pla2g2a + / + , + /–, –/– mice analyzed for aPtC B cells in B cells and CD4/CD8 T cells (n = 3 each) and aPtC B cells in PBL B cells. For + / + vs –/–: PBL aPtC; P = 0.0377. (D) 2 mo ATAμκTg.Pla2g2a + / + , + /–, –/– mice were analyzed for ATA B, ATA B, and IgMb B cells in B cells (n = 3 each).
Figure 4
Figure 4
In PLZF+ T cells, there were increased NKT17 cells in the thymus and increased MAIT cells in the mLN and liver of Pla2g2a–/– mice. Loss of CD1d alters B1a, and MZ B cells. The majority of data showed the mean ± SE, and some showed individual data with mean percentages and + / + vs –/– P-value. (A) 2 mo mLN NKT and NKT2 cells in Pla2g2a + / + , + /–. –/– (NKT n = 6 each, NKT2 n = 4 each; mean ± SE). NKT cells in BALB/c and C57BL/6 mice (n = 4 each; mean ± SE). (B) 3-wk and 2-mo stages of NKT cells present in spl and mLN CD3 + T cells in Pla2g2a + / + , + /–, –/– mice (n = 5 each). In 3 wk Pla2g2a–/– mice in mLN, low NKT cells; for + / + vs –/–, P = 0.069. Analysis of NKT cells in Pla2g2a + / + , + /–. –/– mice (n = 6 each; mean ± SE), and in BALB/c and C57BL/6 (n = 4 each; mean ± SE). (C) Left: Thymus NKT cells in total thymus versus CD3+ T cells, and CD3+ NKT cell analysis for PLZFhi RORγt (T-bet) NKT2, PLZFmedRORγt+ NKT17, and PLZFloRORγt- (T-bet+) NKT1, and PLZF, CD4, CD8, in Pla2g2a + / + , + /–, –/– mice. Right; NKT and PLZFmedCD4-CD8- RORγt+ NKT7 cells in CD3+ T cells (n = 6 each). For + / + vs –/–: NKT17 P = 0.269. High NKT and NKT17 cells in Pla2g2a-/- mice. (D) MAIT analysis in mLN and liver in Pla2g2a + / + , + /–, –/– mice (n = 5 each). For + / + vs –/–: Liver MAIT P = 0.068. Increased MAIT in Pla2g2a-/- mice, similar to higher C57BL/6 than BALB/c mice (n = 2 each). (E) In Pla2g2a–/– mice, the PLZF+ T cell type changed; high NKT17, low NKT2, and increased MAIT cells. (F) 3–4 mo B cell analysis in spl and PerC in BALB/c WT and BALB/c.CD1dKO mice (n = 5 each). Spl MZB; P = 0.020, PerC: B1a; P = 0.076, aPtC B;P = 0.0418, aPC B; P = 0.139. (G) 2-mo serum ATA IgM levels analyzed under ATAμκTg.Pla2g2a + / + . + /–. –/– (+ / + ; n = 10, + /–; n = 20, –/–; n = 9) backgrounds were similar. In contrast, ATA IgM levels were lower in ATAμκTg.CD1dKO mice than ATAμκTg mice (n = 6 each), P = 0.0003.
Figure 5
Figure 5
NKT2 binding to CD1d+ATA B cells and the loss of CD1d in ATA B cells induce tumors in old aged individuals. (A) NKT cell and ATA B cell analysis in mLN in 8–10 mo ATAμκTg C.B17 mice. Top: NKT cells in the mLN were predominantly PLZF+CD4+RORγtlow NKT2 cells compared with increased NKT17+ cells in the thymus at 8–10 mo. Bottom: ATA B cells in mLNs with CD1d+, IL-5R+, and low CD11b/Mac1, thus, NKT2 cells in mLNs have the ability to bind to ATA IgM. LEF-1 and Nod1 qRT-PCR: FO B in Spl versus ATA B cells in Spl and mLN for LEF-1 at 3 mo (n = 3 each; mean ± SE), and ATA B versus ATA B cells in Spl and mLN for LEF-1 and Nod1 at 8–10 mo (n = 4 for ATA B, n = 3 for ATA B; mean ± SE). (B) 16 mo ATA B cell analysis in PBL B cells with CD1d and CD11b/Mac1 analysis. (C) Twelve to 24 mo ATA B cells with nontumor versus tumor stage in spl and mLN. LEF-1, Nod1, Arid5a, IL-6, and IL-10 qRT-PCR (n = 4 each; mean ± SE). ATA B lymphoma was all CD1d-, IL-5R-, and high CD11b/Mac-1. (D) 2 mo adult BM Fr. E (immature B) stage Arid3a and Arid5a mRNAs compared with Lin28+Tg (n = 3 each; mean ± SE). (E) RagKO ATAμκTg mice showed 60% (6/10) generation of ATA B lymphoma at 7–12 mo with high Spl lymphoma without CD11b/Mac1 increase. (F) Pla2g2a+ promotes increased IL-5 production from innate Th2-type cells (ILC2s and NKT2s) with B1a cell growth from neonates to adults and then generates NKT2 control B1 cells.

References

    1. Hayakawa K, Li YS, Shinton SA, Bandi SR, Formica AM, Brill-Dashoff J, Hardy RR. Crucial role of increased Arid3a at the pre-B and immature B cell stages for B1a cell generation. Front. Immunol. 2019;10:457. doi: 10.3389/fimmu.2019.00457. - DOI - PMC - PubMed
    1. Zhou Y, Li YS, Bandi SR, Tang L, Shinton SA, Hayakawa K, Hardy RR. Lin28b promotes fetal B lymphopoiesis through the transcription factor Arid3a. J Exp Med. 2015;212(4):569–580. doi: 10.1084/jem.20141510. - DOI - PMC - PubMed
    1. Baumgarth N. The double life of a B-1 cell: Self-reactivity selects for protective effector functions. Nat. Rev. Immunol. 2011;11(1):34–46. doi: 10.1038/nri2901. - DOI - PubMed
    1. Baumgarth N, Herman OC, Jager GC, Brown LE, Herzenberg LA, Chen J. B-1 and B-2 cell-derived immunoglobulin M antibodies are nonredundant components of the protective response to influenza virus infection. J. Exp. Med. 2000;192(2):271–280. doi: 10.1084/jem.192.2.271. - DOI - PMC - PubMed
    1. Boes M, Prodeus AP, Schmidt T, Carroll MC, Chen J. A critical role of natural immunoglobulin M in immediate defense against systemic bacterial infection. J. Exp. Med. 1998;188(12):2381–2386. doi: 10.1084/jem.188.12.2381. - DOI - PMC - PubMed

Publication types