. 2022 Sep 1;5(1):895.
doi: 10.1038/s42003-022-03834-7.

Curcumin-based-fluorescent probes targeting ALDH1A3 as a promising tool for glioblastoma precision surgery and early diagnosis

Affiliations

Curcumin-based-fluorescent probes targeting ALDH1A3 as a promising tool for glioblastoma precision surgery and early diagnosis

Edoardo L M Gelardi et al. Commun Biol. .

Abstract

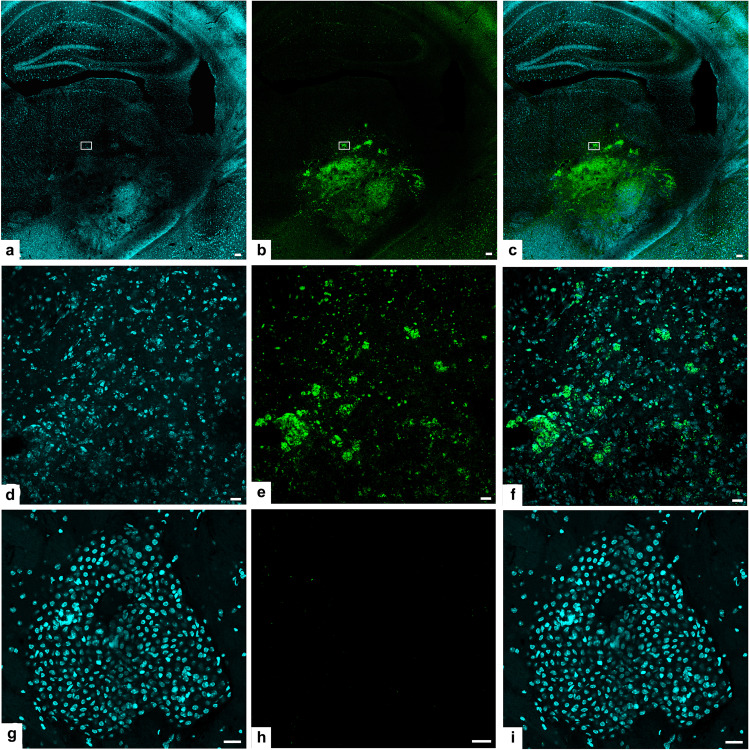
Glioblastoma (GBM) is the most aggressive primary brain tumour for which both effective treatments and efficient tools for an early-stage diagnosis are lacking. Herein, we present curcumin-based fluorescent probes that are able to bind to aldehyde dehydrogenase 1A3 (ALDH1A3), an enzyme overexpressed in glioma stem cells (GSCs) and associated with stemness and invasiveness of GBM. Two compounds are selective versus ALDH1A3, without showing any appreciable interaction with other ALDH1A isoenzymes. Indeed, their fluorescent signal is detectable only in our positive controls in vitro and absent in cells that lack ALDH1A3. Remarkably, in vivo, our Probe selectively accumulate in glioblastoma cells, allowing the identification of the growing tumour mass. The significant specificity of our compounds is the necessary premise for their further development into glioblastoma cells detecting probes to be possibly used during neurosurgical operations.


Conflict of interest statement

The authors declare the following competing interest: the work reported in these papers led to a patent name: “PROBE DIRECTED TO ENZYME ALDH1A3 AND USE THEREOF IN THE DIAGNOSIS OF GLIOBLASTOMA”; number: PCT/IB2022/053216 (6 April 2022); geographical region: International Application (PCT); applicants: University of Piemonte Orientale 90%; University of Pavia 10%; inventors: S.G., A.M., M.R., E.L.M.G., D.C., G.C., L.M.

Figures

Fig. 1
Fig. 1. Synthesis of compounds 10, 11, 12, 13 and 14.
(I) Acetylacetone, boron oxide, trimethyl borate, n-butylamine, DMF; (II) acetylacetone, boron oxide, trimethyl borate, n-butylamine, EtOAc; (III) boron oxide, trimethyl borate, n-butylamine, DMF; (IV) CuSO4, Na-ascorbate, t-BuOH/H2O/CH3CN 2:1:1; (V) CuSO4, Na-ascorbate, t-BuOH/H2O/CH3CN 2:1:1; (VI) diethylchlorophosphate, TEA, CH2Cl2.
Fig. 2
Fig. 2. Biochemical characterization of the interaction of probe 10 with human ALDH1A3.
a Increase of Probe 10 fluorescence intensity in presence of various biomolecules reactive at concentrations of 100 μM. For all assays, Probe 10 was used at 10 μM final concentration and valuation of the absorbance, excitation and emission wavelengths of the compound Probe 10 at a fixed concentration of 10 µM in the SEC buffer. b Increase of Probe 11 fluorescence intensity in presence of various biomolecules reactive at concentrations of 100 μM and evaluation of the absorbance, excitation, and emission wavelengths of the compound Probe 11 at a fixed concentration of 10 µM in the SEC buffer.
Fig. 3
Fig. 3. Kinetic characterization of the interaction of probe 10 with human ALDH1A3.
a KM graph and value of the complex between Probe 10 at fixed concentration and various concentration of ALDH1A1 and ALDH1A2. b Ki graph and value of the complex between Probe 10 and ALDH1A3, in presence of different substrate and probe concentration. Probe 10 was analyzed as potential full competitive inhibitor.
Fig. 4
Fig. 4. LC-HRMS analysis for the determination of interaction of Probe 10 with the different isoenzymes of ALDH1A.
LC-HRMS results after 1 h of incubation of single isoenzyme with Probe 10 in presence of ALDH1A1, ALDH1A2 and ALDH1A3. It is possible to appreciate the formation of the corresponding acid (Probe 10-COOH) for 1A1 and 1A2 but not for ALDH1A3. (TIC total ion current).
Fig. 5
Fig. 5. Probe 10 is selective on glioblastoma ALDH1A3 positive cells.
Fluorescence microscope images for Probe 10 detection in a patient-derived glioma cell 3054, b 3060, c U87MG, d 4T1, e HEK293T and f normal hASTRO at 10 µM, after 2 h of incubation. g Relative fluorescence intensity of the images acquired. ****p value <0.001.
Fig. 6
Fig. 6. Application of Probe 10 in glioblastoma cell lines.
a Cell viability at 10 µM of Probe 10 at 72 h. Flow cytometry analysis of b 3054, c 3060, d U87-MG cells unstained, stained with Probe 11 (10 µM) with or without DEAB (1 µM). On the right of each panel of flow cytometry histographic profiles of unstained, stained with Probe 10 (10 µM) with or without DEAB (1 µM) is reported.
Fig. 7
Fig. 7. In vitro experiments showing that ALDH1A3 is the most expressed isoform in GL261 murine glioma cells and both fluorescent substrates enter and label the same cells.
a Results of quantitative rtPCR showing the levels of expression of ALDH1A1 (1a1), ALDH1A2 (1a2) and ALDH1A3 (1a3) in murine GL261 cells. ALDH1A3 is significantly more expressed than the other isoforms. b Living GL261 cells were analyzed through an ImageStreamX MarkII using two channels: brightfield (Ch 01) and fluorescence (Ch 02) after 1 h incubation in probe 10, cells were thoroughly washed in PBS and analyzed. Two different representative cells are shown. From above, row 1 brightfield images (Ch 01), row 2 fluorescent images (Ch 02). “In Focus Cells” were identified based on the “Gradient Root Mean Square (RMS) Contrast Feature” that captures in focus images of cells identified by high normalized pixel intensity gradient (RMS values) derived from Ch 01; then, a scatter plot of the “Aspect Ratio Feature” vs. brightfield “Area Feature” was used to identify single cells (singlets) from debris or cell clumps based on high aspect ratio and low area value. c Fluorescence intensity variations are shown in the histogram and dot plot (Area vs. Intensity). Scale bars: 5 µm are the same in all images.
Fig. 8
Fig. 8. In vivo labeling by the fluorescent ALDH1A3 substrates of GL261 cells growing and infiltrating the host brain 6 days after the initial inoculum.
af Confocal images showing the same coronal section of a tumor-bearing brain in an animal. injected i.p. with Probe 10 for 6 h. In all images the area boxed is the same and it is shown at higher magnification in df. In a cell nuclei are stained by DAPI, in 6b, GL261 cells containing Probe 10 fluorescence in green. Most of the fluorescence comes from glioma cells growing in the left striatum and adjacent structures that have taken up and metabolized Probe 10. Scale bars: 25 μM. In 6c, the image shows the double fluorescence of DAPI and Probe 10 together. df show confocal images showing at higher magnification the area boxed in 6a–c. Fluorescence of Probe 10 is mostly contained in the cytoplasm. Scale bars: 25 μM. gh Confocal images showing, under different fluorescence conditions, the same coronal section of a tumor-bearing brain in an animal i.p. injected with compound Probe 11 that does not penetrate to any appreciable level the tumor cells in vivo, despite penetrating GL261 cells in vitro. Scale bars: 25 μM. i Confocal image under excitation and filtering conditions appropriate both for DAPI and Probe 11, no fluorescence due to Probe 11 is visible despite the abundance of tumor cells.

References

    1. Louis DN, et al. The 2021 WHO classification of tumors of the central nervous system: a summary. Neuro-Oncology. 2021;23:1231–1251. doi: 10.1093/neuonc/noab106. - DOI - PMC - PubMed
    1. Phillips HS, et al. Molecular subclasses of high-grade glioma predict prognosis, delineate a pattern of disease progression, and resemble stages in neurogenesis. Cancer Cell. 2006;9:157–173. doi: 10.1016/j.ccr.2006.02.019. - DOI - PubMed
    1. Verhaak RGW, et al. Integrated genomic analysis identifies clinically relevant subtypes of glioblastoma characterized by abnormalities in PDGFRA, IDH1, EGFR, and NF1. Cancer Cell. 2010;17:98–110. doi: 10.1016/j.ccr.2009.12.020. - DOI - PMC - PubMed
    1. Dunn GP, et al. Emerging insights into the molecular and cellular basis of glioblastoma. Genes Dev. 2012;26:756–784. doi: 10.1101/gad.187922.112. - DOI - PMC - PubMed
    1. Batlle E, Clevers H. Cancer stem cells revisited. Nat. Med. 2017;23:1124–1134. doi: 10.1038/nm.4409. - DOI - PubMed

Publication types

MeSH terms