

High-dimensional multinomial multiclass severity scoring of COVID-19 pneumonia using CT radiomics features and machine learning algorithms
- PMID: 36050434
- PMCID: PMC9437017
- DOI: 10.1038/s41598-022-18994-z
High-dimensional multinomial multiclass severity scoring of COVID-19 pneumonia using CT radiomics features and machine learning algorithms
Abstract
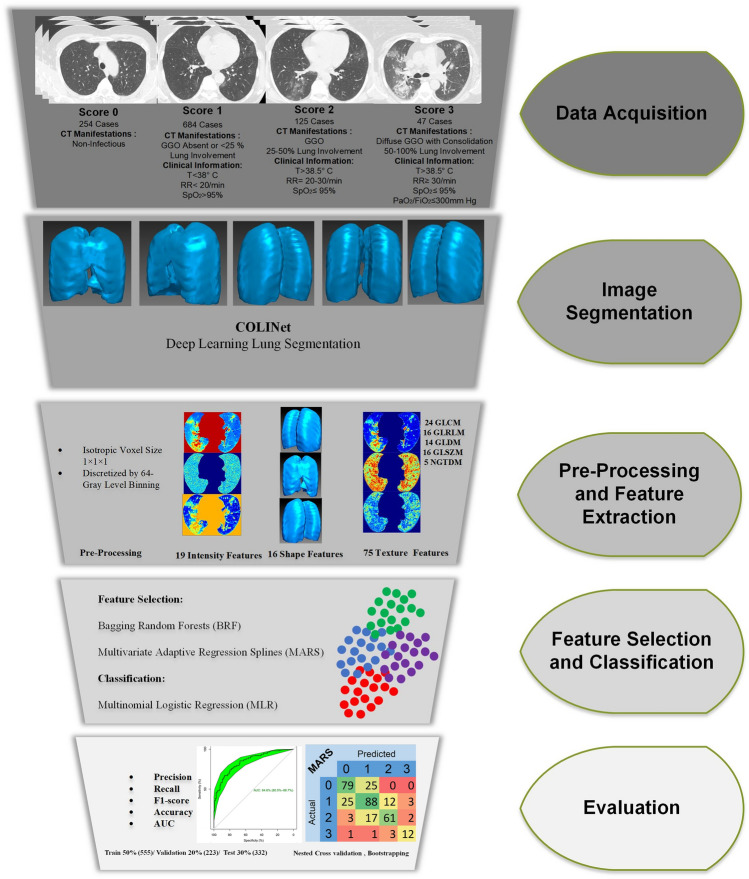
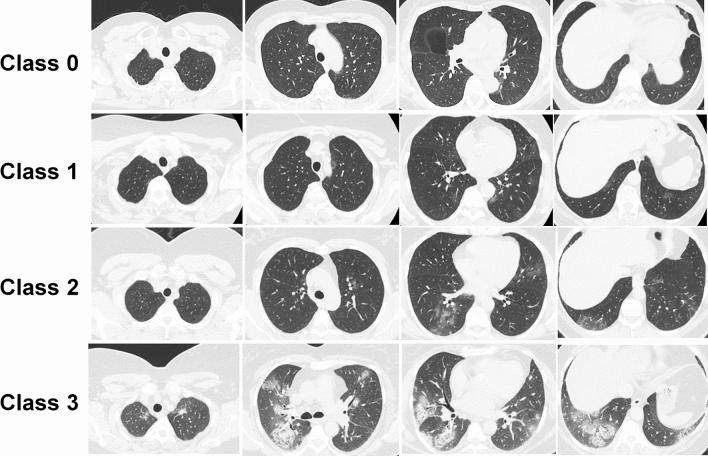
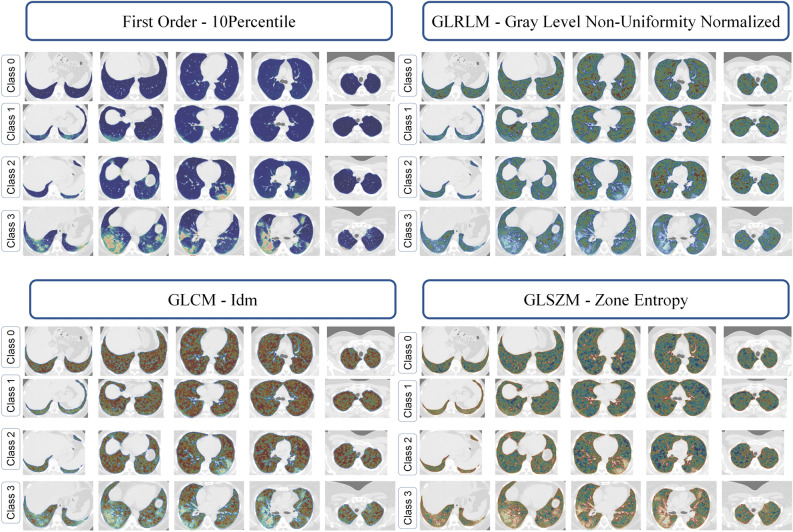
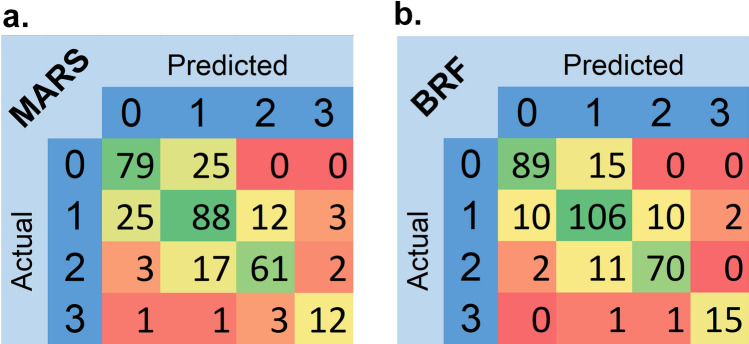
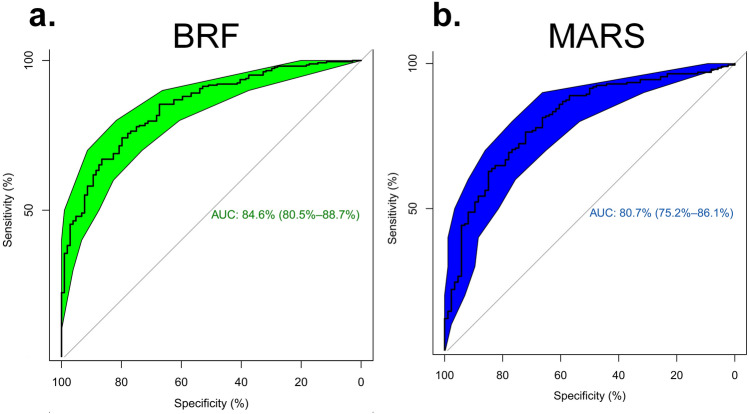
We aimed to construct a prediction model based on computed tomography (CT) radiomics features to classify COVID-19 patients into severe-, moderate-, mild-, and non-pneumonic. A total of 1110 patients were studied from a publicly available dataset with 4-class severity scoring performed by a radiologist (based on CT images and clinical features). The entire lungs were segmented and followed by resizing, bin discretization and radiomic features extraction. We utilized two feature selection algorithms, namely bagging random forest (BRF) and multivariate adaptive regression splines (MARS), each coupled to a classifier, namely multinomial logistic regression (MLR), to construct multiclass classification models. The dataset was divided into 50% (555 samples), 20% (223 samples), and 30% (332 samples) for training, validation, and untouched test datasets, respectively. Subsequently, nested cross-validation was performed on train/validation to select the features and tune the models. All predictive power indices were reported based on the testing set. The performance of multi-class models was assessed using precision, recall, F1-score, and accuracy based on the 4 × 4 confusion matrices. In addition, the areas under the receiver operating characteristic curves (AUCs) for multi-class classifications were calculated and compared for both models. Using BRF, 23 radiomic features were selected, 11 from first-order, 9 from GLCM, 1 GLRLM, 1 from GLDM, and 1 from shape. Ten features were selected using the MARS algorithm, namely 3 from first-order, 1 from GLDM, 1 from GLRLM, 1 from GLSZM, 1 from shape, and 3 from GLCM features. The mean absolute deviation, skewness, and variance from first-order and flatness from shape, and cluster prominence from GLCM features and Gray Level Non Uniformity Normalize from GLRLM were selected by both BRF and MARS algorithms. All selected features by BRF or MARS were significantly associated with four-class outcomes as assessed within MLR (All p values < 0.05). BRF + MLR and MARS + MLR resulted in pseudo-R2 prediction performances of 0.305 and 0.253, respectively. Meanwhile, there was a significant difference between the feature selection models when using a likelihood ratio test (p value = 0.046). Based on confusion matrices for BRF + MLR and MARS + MLR algorithms, the precision was 0.856 and 0.728, the recall was 0.852 and 0.722, whereas the accuracy was 0.921 and 0.861, respectively. AUCs (95% CI) for multi-class classification were 0.846 (0.805-0.887) and 0.807 (0.752-0.861) for BRF + MLR and MARS + MLR algorithms, respectively. Our models based on the utilization of radiomic features, coupled with machine learning were able to accurately classify patients according to the severity of pneumonia, thus highlighting the potential of this emerging paradigm in the prognostication and management of COVID-19 patients.
© 2022. The Author(s).
Conflict of interest statement
The authors declare no competing interests.
Figures
References
-
- Cascella, M., Rajnik, M., Cuomo, A., Dulebohn, S. C. & Di Napoli, R. In StatPearls (StatPearls Publishing Copyright © 2020, StatPearls Publishing LLC., 2020).
Publication types
MeSH terms
Grants and funding
LinkOut - more resources
Full Text Sources
Medical
Miscellaneous
