. 2022 Sep 1;12(1):14896.
doi: 10.1038/s41598-022-19233-1.

Differential pharmacological and sex-specific effects of antimuscarinic agents at the hypoglossal motor nucleus in vivo in rats

Affiliations

Differential pharmacological and sex-specific effects of antimuscarinic agents at the hypoglossal motor nucleus in vivo in rats

Sepehr Niakani et al. Sci Rep. .

Abstract

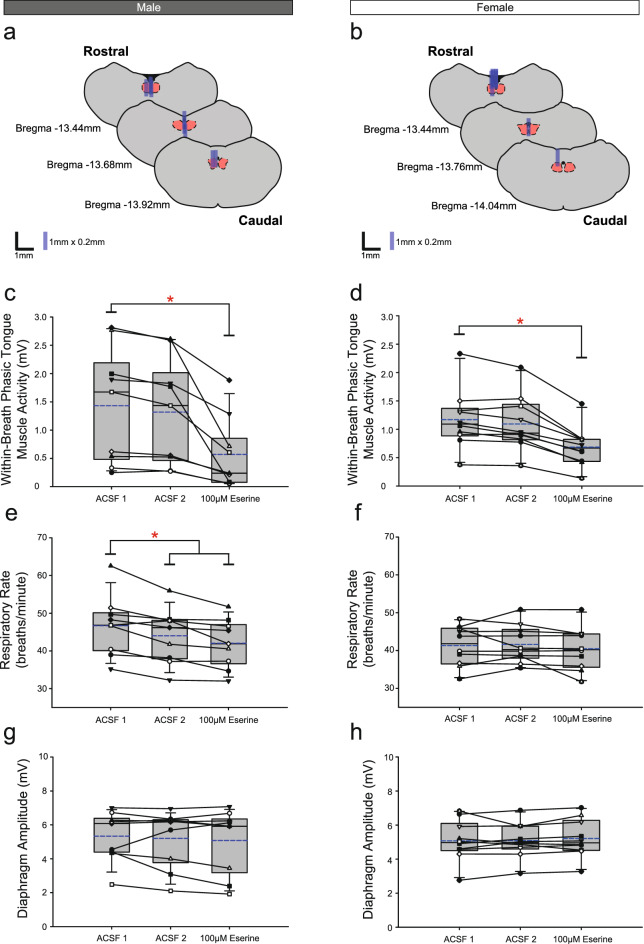
Successful cholinergic-noradrenergic pharmacotherapy for obstructive sleep apnea (OSA) is thought to be due to effects at the hypoglossal motor nucleus (HMN). Clinical efficacy varies with muscarinic-receptor (MR) subtype affinities. We hypothesized that oxybutynin (cholinergic agent in successful OSA pharmacotherapy) is an effective MR antagonist at the HMN and characterized its efficacy with other antagonists. We recorded tongue muscle activity of isoflurane anesthetized rats (121 males and 60 females, 7-13 per group across 13 protocols) in response to HMN microperfusion with MR antagonists with and without: (i) eserine-induced increased endogenous acetylcholine at the HMN and (ii) muscarine. Eserine-induced increased acetylcholine decreased tongue motor activity (p < 0.001) with lesser cholinergic suppression in females versus males (p = 0.017). Motor suppression was significantly attenuated by the MR antagonists atropine, oxybutynin, and omadacycline (MR2 antagonist), each p < 0.001, with similar residual activity between agents (p ≥ 0.089) suggesting similar efficacy at the HMN. Sex differences remained with atropine and oxybutynin (p < 0.001 to 0.05) but not omadacycline (p = 0.722). Muscarine at the HMN also decreased motor activity (p < 0.001) but this was not sex-specific (p = 0.849). These findings have translational relevance to antimuscarinic agents in OSA pharmacotherapy and understanding potential sex differences in HMN suppression with increased endogenous acetylcholine related to sparing nicotinic excitation.


Conflict of interest statement

The authors declare no competing interests.

Figures

Figure 1
Figure 1
Example of site of microdialysis at the hypoglossal motor nucleus (HMN). The ventral tip of the microdialysis probe identified from the tissue disruption left by the probe is indicated by the arrow. The reconstruction of the probe position and the contralateral HMN outlined by a dotted line are shown (top figure). A schematic representation of the coronal section of medulla 13.44 mm posterior to bregma is also shown with the reconstructed probe position drawn to scale (bottom figure).
Figure 2
Figure 2
Example traces showing tongue motor inhibition by eserine at the HMN (Protocol 1.1), the capacity for its blockade by muscarinic receptor antagonists (Protocol 1.2a-c), and respiratory muscle activities over sequential ACSF (i.e., sham) time control interventions (Protocol 2). The sets of traces (aj) show the raw tongue EMG activity, and the moving time averages (∫) of tongue and diaphragm EMG signals for males (left column) and females (right column). The indicated variables and their scales on the ordinate axes for the left panels (males) are the same as for the adjacent panels on the right (females). The 30-s sample traces represent the last minute of each intervention, with this last-minute period used for data analyses.
Figure 3
Figure 3
Group data from Protocol 1.1: Microperfusion of 100 μM eserine into the HMN (left column: male, n = 9; right column: female, n = 10). Schematic representations of coronal sections of medulla illustrating the distribution of probe sites across all experiments (a,b). Drawn to scale, the blue rectangles represent reconstruction of the sites of the microdialysis probes; overlap obscures some of the individual probe sites. Box and whisker plots show individual and group data (median [dashed line], mean [solid line] and 25th and 75th percentiles) for within-breath phasic tongue muscle activity (c,d), respiratory rate (e,f), and diaphragm amplitude (g,h). Each animal is indicated by a different symbol. *, indicates p < 0.05 compared to baseline ACSF controls.
Figure 4
Figure 4
Group data from Protocol 1.2a: Microperfusion of 10 μM atropine into the HMN with and without co-application of eserine (left column: male, n = 9; right column: female, n = 10). Schematic representations of coronal sections of medulla illustrating the distribution of probe sites across all experiments (a,b). Drawn to scale, the blue rectangles represent reconstruction of the sites of the microdialysis probes; overlap obscures some of the individual probe sites. Box and whisker plots show individual and group data (median [dashed line], mean [solid line] and 25th and 75th percentiles) for within-breath phasic tongue muscle activity (c,d), respiratory rate (e,f), and diaphragm amplitude (g,h). Each animal is indicated by a different symbol. *, indicates p < 0.05 compared to baseline ACSF controls.
Figure 5
Figure 5
Group data from Protocol 1.2b: Microperfusion of 100 μM oxybutynin into the HMN with and without co-application of eserine (left column: male, n = 9; right column: female, n = 10). Schematic representations of coronal sections of medulla illustrating the distribution of probe sites across all experiments (a,b). Drawn to scale, the blue rectangles represent reconstruction of the sites of the microdialysis probes; overlap obscures some of the individual probe sites. Box and whisker plots show individual and group data (median [dashed line], mean [solid line] and 25th and 75th percentiles) for within-breath phasic tongue muscle activity (c,d), respiratory rate (e,f), and diaphragm amplitude (g,h). Each animal is indicated by a different symbol. *, indicates p < 0.05 compared to baseline ACSF controls.
Figure 6
Figure 6
Group data from Protocol 1.2c: Microperfusion of 100 μM omadacycline into the HMN with and without co-application of eserine (left column: male, n = 13; right column: female, n = 13). Schematic representations of coronal sections of medulla illustrating the distribution of probe sites across all experiments (a,b). Drawn to scale, the blue rectangles represent reconstruction of the sites of the microdialysis probes; overlap obscures some of the individual probe sites. Box and whisker plots show individual and group data (median [dashed line], mean [solid line] and 25th and 75th percentiles) for within-breath phasic tongue muscle activity (c,d), respiratory rate (e,f), and diaphragm amplitude (g,h). Each animal is indicated by a different symbol. *, indicates p < 0.05 compared to baseline ACSF controls.
Figure 7
Figure 7
Group data from Protocol 2: Effects of sequential ACSF (i.e., sham) time-control interventions at the HMN (left column: male, n = 13; right column: female, n = 6). Schematic representations of coronal sections of medulla illustrating the distribution of probe sites across all experiments (a,b). Drawn to scale, the blue rectangles represent reconstruction of the sites of the microdialysis probes; overlap obscures some of the individual probe sites. Box and whisker plots show individual and group data (median [dashed line], mean [solid line] and 25th and 75th percentiles) for within-breath phasic tongue muscle activity (c,d), respiratory rate (e,f), and diaphragm amplitude (g,h). Each animal is indicated by a different symbol. *, indicates p < 0.05 compared to baseline ACSF controls.
Figure 8
Figure 8
Relative efficacy of the antimuscarinic agents at the HMN in Study 1 in reducing eserine-induced tongue motor suppression and ACSF time controls. Individual data (males, gray round symbols on left of each bar; females, white symbols on right of each bar) and group data (population of males and females combined, grey bar) showing respiratory motor responses across protocols. Data are normalized to the baseline ACSF control period in each individual. Box and whisker plots show individual and group data comprising the plot (median (dashed line), mean (solid line), 25th and 75th percentiles) for within-breath phasic tongue muscle activity (a), respiratory rate (b), and diaphragm amplitude (c). * and # indicate p ≤ 0.05.
Figure 9
Figure 9
Example traces showing tongue motor inhibition by muscarine at the HMN (Protocol 3.1) and the capacity for its blockade by muscarinic receptor antagonists (Protocol 3.2a-d). The sets of traces (ai) show the raw tongue EMG activity, and the moving time averages (∫) of the tongue and diaphragm EMG signals during microperfusion of muscarine in female and male rats (a,b) or when co-applied with muscarinic receptor antagonists in male rats (ci). The 30-s sample traces represent the last minute of each intervention, with this last-minute period used for data analyses.
Figure 10
Figure 10
Group data from Protocol 3.1: Microperfusion of 100 μM muscarine into the HMN (top panels: male, n = 8; bottom panels: female, n = 11). Schematic representations of coronal sections of medulla illustrating the distribution of probe sites across all experiments (a,e). Drawn to scale, the blue rectangles represent reconstruction of the sites of the microdialysis probes; overlap obscures some of the individual probe sites. Box and whisker plots show individual and group data (median [dashed line], mean [solid line] and 25th and 75th percentiles) for within-breath phasic tongue muscle activity (b,f), respiratory rate (c,g), and diaphragm amplitude (d,h). Each animal is indicated by a different symbol. *, indicates p < 0.05 compared to baseline ACSF controls.
Figure 11
Figure 11
Group data from Protocol 3.2a: Microperfusion of 10 μM atropine into the HMN with and without co-application of muscarine (n = 8). Schematic representations of coronal sections of medulla illustrating the distribution of probe sites across all experiments (a). Drawn to scale, the blue rectangles represent reconstruction of the sites of the microdialysis probes; overlap obscures some of the individual probe sites. Box and whisker plots show individual and group data (median [dashed line], mean [solid line] and 25th and 75th percentiles) for within-breath phasic tongue muscle activity (b), respiratory rate (c), and diaphragm amplitude (d). Each animal is indicated by a different symbol. *, indicates p < 0.05 compared to baseline ACSF controls.
Figure 12
Figure 12
Group data from Protocol 3.2b: Microperfusion of 1 mM scopolamine into the HMN with and without co-application of muscarine (n = 10). Schematic representations of coronal sections of medulla illustrating the distribution of probe sites across all experiments (a). Drawn to scale, the blue rectangles represent reconstruction of the sites of the microdialysis probes; overlap obscures some of the individual probe sites. Box and whisker plots show individual and group data (median [dashed line], mean [solid line] and 25th and 75th percentiles) for within-breath phasic tongue muscle activity (b), respiratory rate (c), and diaphragm amplitude (d). Each animal is indicated by a different symbol. *, indicates p < 0.05 compared to baseline ACSF controls.
Figure 13
Figure 13
Group data from Protocol 3.2c: Microperfusion of oxybutynin into the HMN with and without co-application of muscarine (top panels: 10 µM, n = 7; bottom panels: 100 µM, n = 7). Schematic representations of coronal sections of medulla illustrating the distribution of probe sites across all experiments (a,e). Drawn to scale, the blue rectangles represent reconstruction of the sites of the microdialysis probes; overlap obscures some of the individual probe sites. Box and whisker plots show individual and group data (median [dashed line], mean [solid line] and 25th and 75th percentiles) for within-breath phasic tongue muscle activity (b,f), respiratory rate (c,g), and diaphragm amplitude (d,h). Each animal is indicated by a different symbol. *, indicates p < 0.05 compared to baseline ACSF controls.
Figure 14
Figure 14
Group data from Protocol 3.2d: Microperfusion of omadacycline into the HMN with and without co-application of muscarine (top panels: 10 µM, n = 10; middle panels: 100 µM, n = 10; bottom panels: 1 mM, n = 8). Schematic representations of coronal sections of medulla illustrating the distribution of probe sites across all experiments (a,e,i). Drawn to scale, the blue rectangles represent reconstruction of the sites of the microdialysis probes; overlap obscures some of the individual probe sites. Box and whisker plots show individual and group data (median [dashed line], mean [solid line] and 25th and 75th percentiles) for within-breath phasic tongue muscle activity (b,f,j), respiratory rate (c,g,k), and diaphragm amplitude (d,h,l). Each animal is indicated by a different symbol. *, indicates p < 0.05 compared to baseline ACSF controls.
Figure 15
Figure 15
Relative efficacy of the antimuscarinic agents at the HMN in Study 3 in reducing muscarine-induced tongue motor suppression and ACSF time controls. Individual and group data showing respiratory motor responses across protocols. Data are normalized to the baseline ACSF control period in each individual. Box and whisker plots show individual and group data comprising the plot (median [dashed line], mean [solid line] and 25th and 75th percentiles) for within-breath phasic tongue muscle activity (a), respiratory rate (b), and diaphragm amplitude (c). Male and female responses for the protocols with muscarine only are indicated by gray and white circles respectively. *, indicates p < 0.05.

Similar articles

Cited by

References

    1. Benjafield AV, et al. Estimation of the global prevalence and burden of obstructive sleep apnoea: A literature-based analysis. Lancet Respir. Med. 2019;7:687–698. doi: 10.1016/S2213-2600(19)30198-5. - DOI - PMC - PubMed
    1. Peppard PE, et al. Increased prevalence of sleep-disordered breathing in adults. Am. J. Epidemiol. 2013;177:1006–1014. doi: 10.1093/aje/kws342. - DOI - PMC - PubMed
    1. Weaver TE, Grunstein RR. Adherence to continuous positive airway pressure therapy: The challenge to effective treatment. Proc. Am. Thorac. Soc. 2008;5:173–178. doi: 10.1513/pats.200708-119MG. - DOI - PMC - PubMed
    1. Sawyer AM, et al. A systematic review of CPAP adherence across age groups: Clinical and empiric insights for developing CPAP adherence interventions. Sleep Med. Rev. 2011;15:343–356. doi: 10.1016/j.smrv.2011.01.003. - DOI - PMC - PubMed
    1. Fenik VB, Davies RO, Kubin L. Noradrenergic, serotonergic and GABAergic antagonists injected together into the XII nucleus abolish the REM sleep-like depression of hypoglossal motoneuronal activity. J. Sleep Res. 2005;14:419–429. doi: 10.1111/j.1365-2869.2005.00461.x. - DOI - PubMed

Publication types

Grants and funding