. 2022 Sep 1;12(1):14883.
doi: 10.1038/s41598-022-19245-x.

Brown adipose tissue dysfunction promotes heart failure via a trimethylamine N-oxide-dependent mechanism

Affiliations

Brown adipose tissue dysfunction promotes heart failure via a trimethylamine N-oxide-dependent mechanism

Yohko Yoshida et al. Sci Rep. .

Abstract

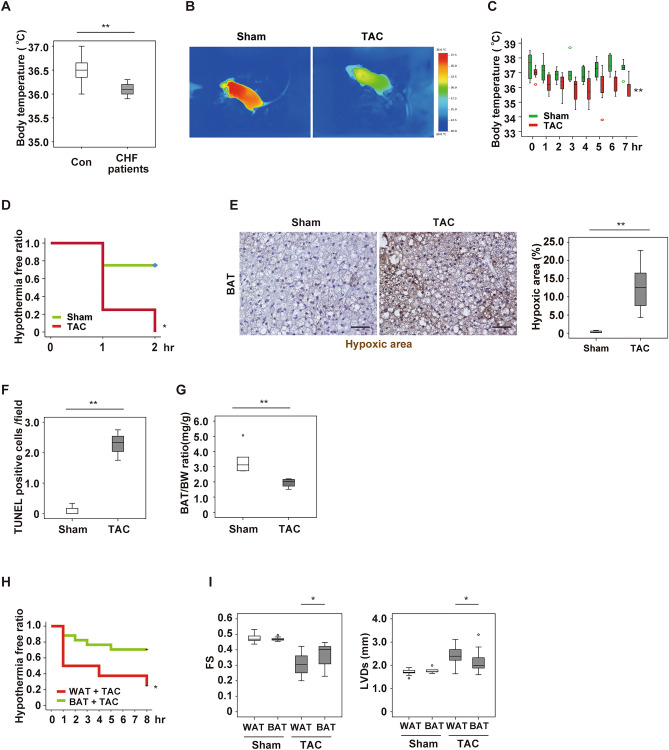
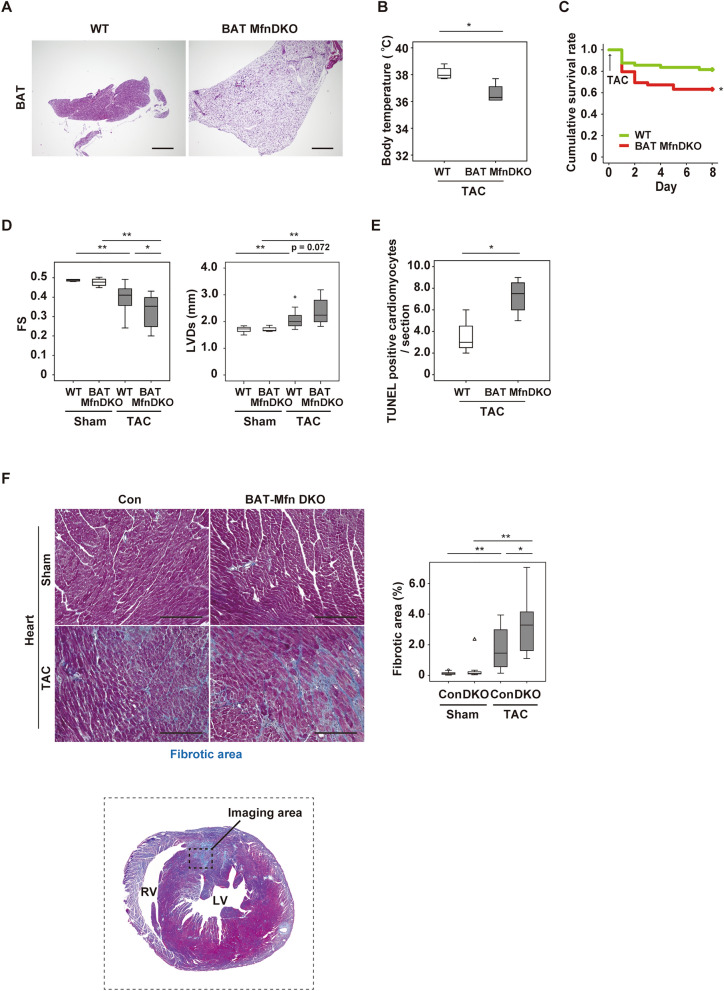
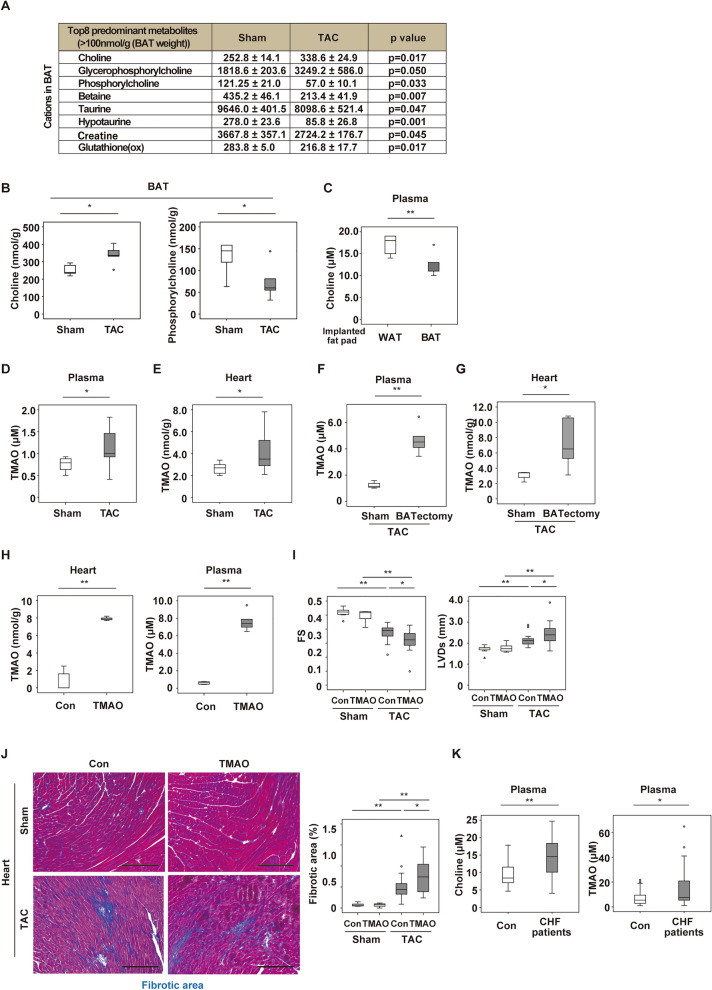
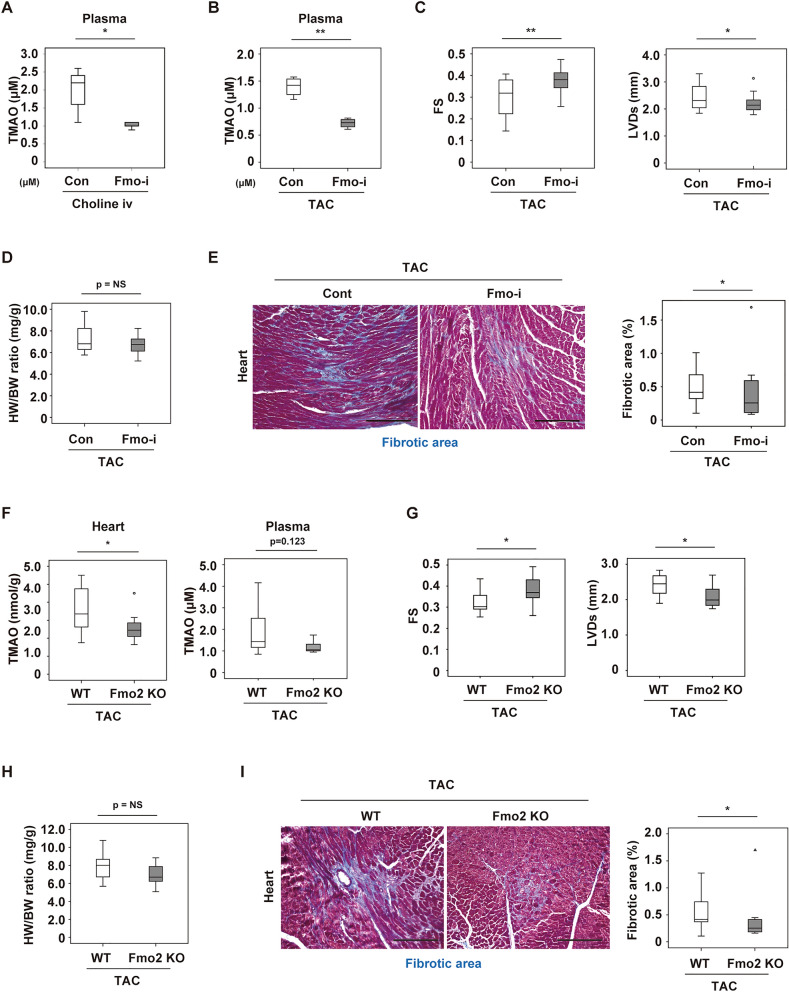
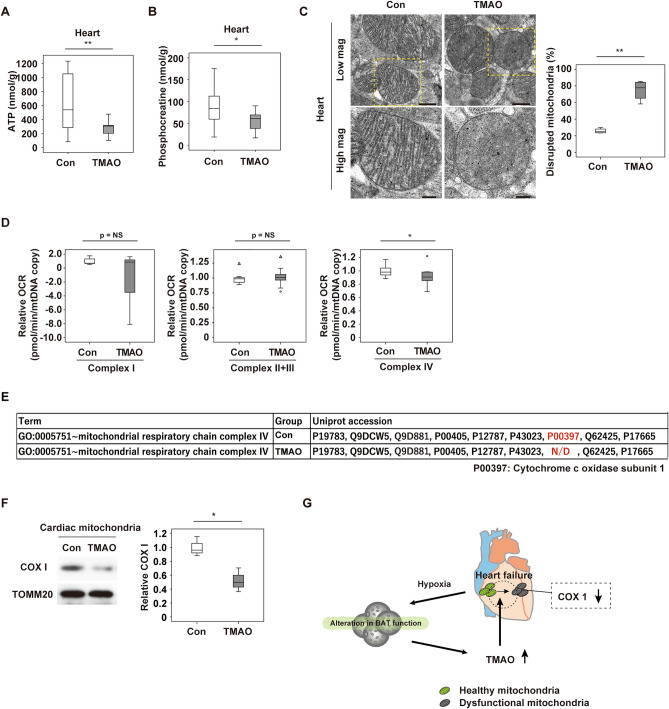
Low body temperature predicts a poor outcome in patients with heart failure, but the underlying pathological mechanisms and implications are largely unknown. Brown adipose tissue (BAT) was initially characterised as a thermogenic organ, and recent studies have suggested it plays a crucial role in maintaining systemic metabolic health. While these reports suggest a potential link between BAT and heart failure, the potential role of BAT dysfunction in heart failure has not been investigated. Here, we demonstrate that alteration of BAT function contributes to development of heart failure through disorientation in choline metabolism. Thoracic aortic constriction (TAC) or myocardial infarction (MI) reduced the thermogenic capacity of BAT in mice, leading to significant reduction of body temperature with cold exposure. BAT became hypoxic with TAC or MI, and hypoxic stress induced apoptosis of brown adipocytes. Enhancement of BAT function improved thermogenesis and cardiac function in TAC mice. Conversely, systolic function was impaired in a mouse model of genetic BAT dysfunction, in association with a low survival rate after TAC. Metabolomic analysis showed that reduced BAT thermogenesis was associated with elevation of plasma trimethylamine N-oxide (TMAO) levels. Administration of TMAO to mice led to significant reduction of phosphocreatine and ATP levels in cardiac tissue via suppression of mitochondrial complex IV activity. Genetic or pharmacological inhibition of flavin-containing monooxygenase reduced the plasma TMAO level in mice, and improved cardiac dysfunction in animals with left ventricular pressure overload. In patients with dilated cardiomyopathy, body temperature was low along with elevation of plasma choline and TMAO levels. These results suggest that maintenance of BAT homeostasis and reducing TMAO production could be potential next-generation therapies for heart failure.


Conflict of interest statement

The authors declare no competing interests.

Figures

Figure 1
Figure 1
Left ventricular pressure overload induces dysfunction of brown adipose tissue. (A) Body temperature of control (Con) subjects and patients with congestive heart failure (CHF) (n = 15, 9). (B) Surface body temperature measured by a thermal camera in mice at 5 weeks after sham surgery (Sham) or TAC. (C) Acute cold tolerance test performed in mice at 4 weeks after Sham or TAC with measurement of body temperature in the scapular region (n = 6 and 7, respectively). (D) Hypothermia-free ratio during the acute cold tolerance test in mice at 4 weeks after Sham or TAC with measurement of the intraperitoneal temperature (n = 4, 4). (E) Pimonidazole staining of BAT in mice from (C) performed by the Hypoxyprobe-1 method. The right panel shows quantification of the hypoxic area (n = 4, 8). Scale bar = 50 μm. (F) Quantification of TUNEL-positive cells in BAT from mice at 6 weeks after Sham or TAC (n = 3, 3). (G) Body weight (BW)-adjusted BAT weight in mice prepared as described in Fig. 1C (n = 5, 4). (H) Hypothermia-free ratio during the acute cold tolerance test in mice with WAT or BAT transplantation at 2 weeks after TAC (n = 11, 17). (I) Assessment of cardiac function in mice with WAT or BAT transplantation at 2 weeks after Sham or TAC. FS: fractional shortening (n = 10, 11, 9, 19), LVDs: left-ventricular systolic dimension (n = 10, 11, 9, 19). Data were analysed by the 2-tailed Student’s t-test (A, E, F, G and I), repeated measures followed by Tukey’s multiple comparison test (C), or the log-rank test for Kaplan–Meier method (D, H). *P < 0.05, **P < 0.01. Values are shown as the mean ± s.e.m.
Figure 2
Figure 2
Brown adipose tissue dysfunction deteriorates cardiac function after TAC. (A) Hematoxylin and eosin (HE) staining of BAT from 8-week-old littermate control (WT) mice or BAT-specific Mfn1/Mfn2 DKO (BAT Mfn DKO) mice. Scale bar = 500 μm. (B) Body temperature of mice at 2 weeks after TAC (n = 4, 4). (C) Cumulative survival rate of mice at 1 week after TAC (n = 49, 49). (D) Assessment of cardiac function in the indicated mice at 1 week after Sham or TAC (FS; n = 5, 4, 28, 16, LVDs; n = 5, 4, 28, 16). (E) Quantification of TUNEL-positive cardiomyocytes in the hearts of mice at 1 week after TAC (n = 4, 4). (F) Masson’s trichrome staining of hearts from the mice. The right panel shows quantification of the fibrotic area (n = 13, 10, 21, 13). Scale bar = 50 μm. Data were analysed by the 2-tailed Student’s t-test (B, E), 2-way ANOVA followed by Dunnett’s comparison test (D), or the log-rank test for Kaplan–Meier method (C). *P < 0.05, **P < 0.01. Values are shown as the mean ± s.e.m.
Figure 3
Figure 3
Choline and trimethylamine N-oxide are increased in heart failure. (A) Changes of cationic metabolites in BAT from mice at 2 weeks after TAC or sham surgery (Sham) assessed by CE-TOF/MS. Results of some metabolites are also shown in Fig. 3B as a box plot panel. (B) Tissue weight-adjusted levels of choline (n = 5, 5) or phosphorylcholine (n = 5, 5) in BAT from mice at 2 weeks after Sham or TAC. (C) Plasma choline level in mice with implantation of WAT or BAT (n = 5, 5). (D, E) Plasma (D) or myocardial (E) trimethylamine N-oxide (TMAO) level in mice at 2 weeks after sham or TAC (n = 11, 11). (F, G) Plasma (F) or heart (G) TMAO level in sham and BATectomy model mice 2 weeks after TAC (n = 3, 5). (H) TMAO levels in myocardium (left) and plasma (right) of WT mice treated with PBS (Con) or TMAO mice for 2 weeks (n = 5, 5). (I) Cardiac function of mice at 2 weeks after Sham or TAC with/without TMAO treatment (n = 7, 7, 19, 16). (J) Masson’s trichrome staining of hearts from mice in (I). The right panel shows quantification of the fibrotic area (n = 7, 7, 21, 17). Scale bar = 50 μm. (K) Plasma choline level (left panel) and TMAO level (right panel) in control subjects (Con) or patients with CHF (n = 23, 30). Data were analysed by the 2-tailed Student’s t-test (AH and K) or 2-way ANOVA followed by Dunnett’s comparison test (I and J). *P < 0.05, **P < 0.01. Values are shown as the mean ± s.e.m.
Figure 4
Figure 4
Inhibition of FMO ameliorates cardiac dysfunction during left ventricular pressure overload. (A) Plasma TMAO level in WT mice after intravenous choline infusion (500 nmol, 6 h), without (Con) or with the administration of 0.05% methimazole (Fmo-i) (n = 5, 5). Fmo-i was administered through drinking water for 1 week, and then choline infusion was performed. (B) Plasma TMAO level in mice at 3 weeks after TAC (n = 4, 4). For this study, 0.05% methimazole (Fmo-i) was administered in drinking water 1 week after TAC operation for 2 weeks total. Experiments were performed 3 weeks after TAC. (C) Cardiac function of mice (FS: fractional shortening, LVDs: left ventricular systolic dimension; n = 22, 21). (D) Body weight-adjusted heart weight of mice (n = 22, 21). (E) Masson’s trichrome staining of hearts from mice. The right panel shows quantification of the fibrotic area (n = 11, 14). Scale bar = 50 μm. (F) TMAO levels in hearts or plasma from littermate wild-type (WT) or systemic Fmo2 knockout (Fmo2 KO) mice at 2 weeks after TAC (n = 8, 9). (G) Cardiac function of mice prepared as described in Fig. 4F (fractional shortening (FS); n = 14, 13, left ventricular systolic dimension (LVDs); n = 14, 13). (H) Body weight-adjusted heart weight of mice (n = 14, 13). (I) Masson’s trichrome staining of hearts. The right panel shows quantification of the fibrotic area (n = 12, 8). Scale bar = 50 μm. Data were analysed by the 2-tailed Student’s t-test (A-I). *P < 0.05, **P < 0.01. Values are shown as the mean ± s.e.m. NS = not significant.
Figure 5
Figure 5
Trimethylamine N-oxide inhibits mitochondrial respiration in the heart. (A, B) Metabolomic study analysing ATP (A) (n = 24, 11) or phosphocreatine (B) (n = 24, 11) in the hearts of WT mice administered PBS (Con) or Trimethylamine N-oxide (TMAO) for 2 weeks. (C) Transmission electron microscopy of cardiac tissues from mice prepared as described in Fig. 5A. The right panel shows quantification of the disrupted mitochondria (n = 4, 4). Scale bar = 500 nm for low magnification and 200 nm for high magnification. (D) Oxygen consumption rate (OCR) assessing respiration by the indicated complexes in mitochondria isolated from the cardiac tissues of mice prepared as described in Fig. 5A (n = 7, 9). (E) Mitochondrial complex IV proteins of cardiac mitochondria assessed by mass spectrometry in the PBS (Con) or TMAO treated WT mice. N/D = Not detected. (F) Western blot analysis of COX1 in cardiac mitochondria prepared as described in (E). TOMM20 was used as the loading control. The right panel shows quantification of the data (n = 3, 3). Original blots are presented in Supplementary Fig. 9. (G) Graphical abstract showing a summary of the findings. Data were analyzed by the 2-tailed Student’s t-test (A, B, C, D and F). *P < 0.05, **P < 0.01. Values represent the mean ± s.e.m. NS not significant.

References

    1. Ikegami R, Shimizu I, Yoshida Y, Minamino T. Metabolomic analysis in heart failure. Circ. J. 2017;82:10–16. doi: 10.1253/circj.CJ-17-1184. - DOI - PubMed
    1. Troseid M, et al. Microbiota-dependent metabolite trimethylamine-N-oxide is associated with disease severity and survival of patients with chronic heart failure. J. Intern. Med. 2015;277:717–726. doi: 10.1111/joim.12328. - DOI - PubMed
    1. Koeth RA, et al. Intestinal microbiota metabolism of L-carnitine, a nutrient in red meat, promotes atherosclerosis. Nat. Med. 2013;19:576–585. doi: 10.1038/nm.3145. - DOI - PMC - PubMed
    1. Ikeda K, Maretich P, Kajimura S. The common and distinct features of brown and beige adipocytes. Trends Endocrinol. Metab. 2018;29:191–200. doi: 10.1016/j.tem.2018.01.001. - DOI - PMC - PubMed
    1. Sacks H, Symonds ME. Anatomical locations of human brown adipose tissue: Functional relevance and implications in obesity and type 2 diabetes. Diabetes. 2013;62:1783–1790. doi: 10.2337/db12-1430. - DOI - PMC - PubMed

Publication types