. 2022 Sep;24(9):1422-1432.
doi: 10.1038/s41556-022-00985-x. Epub 2022 Sep 1.

NRF2 mediates melanoma addiction to GCDH by modulating apoptotic signalling

Affiliations

NRF2 mediates melanoma addiction to GCDH by modulating apoptotic signalling

Sachin Verma et al. Nat Cell Biol. 2022 Sep.

Abstract

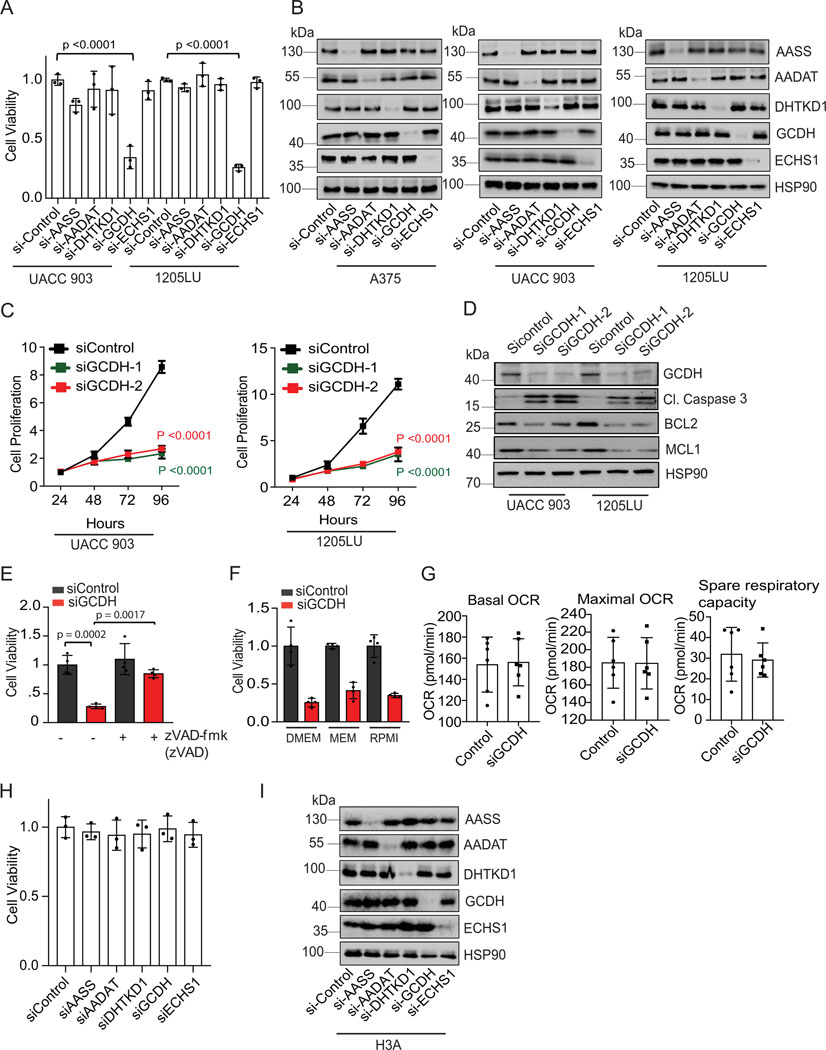
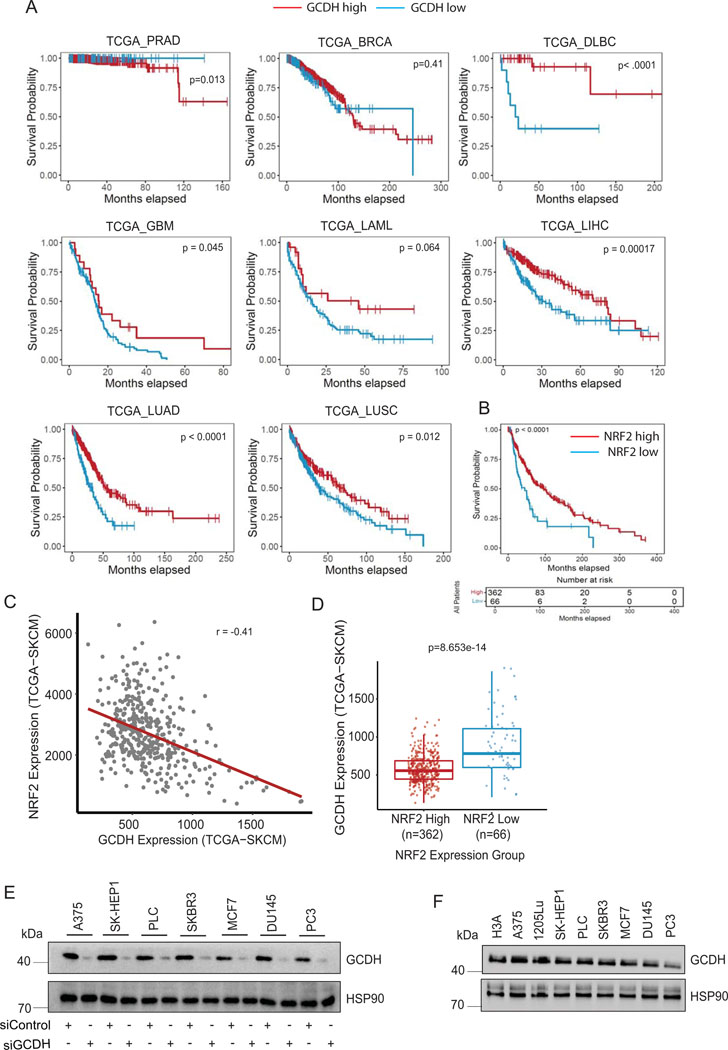
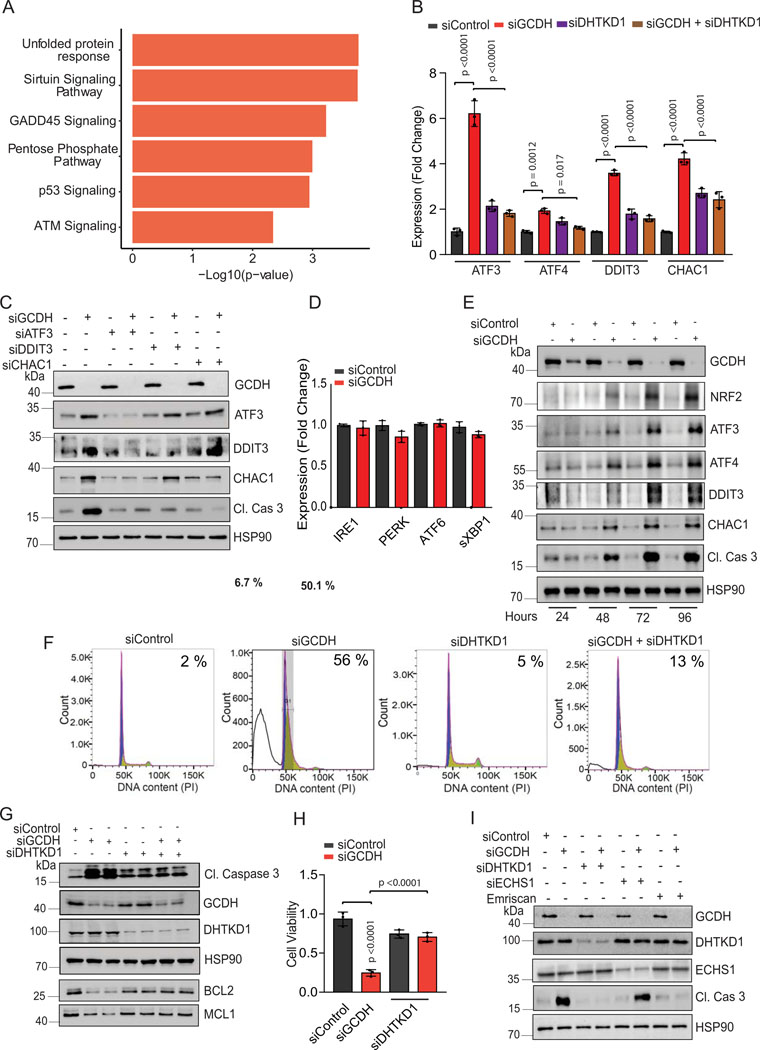
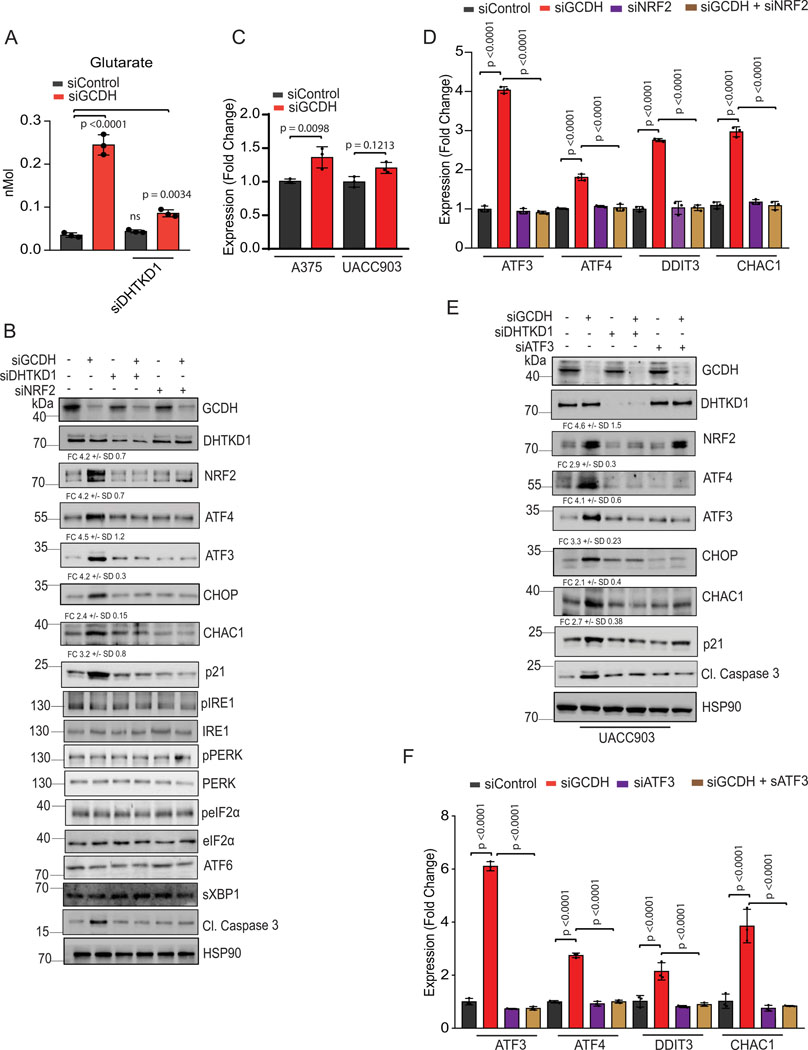
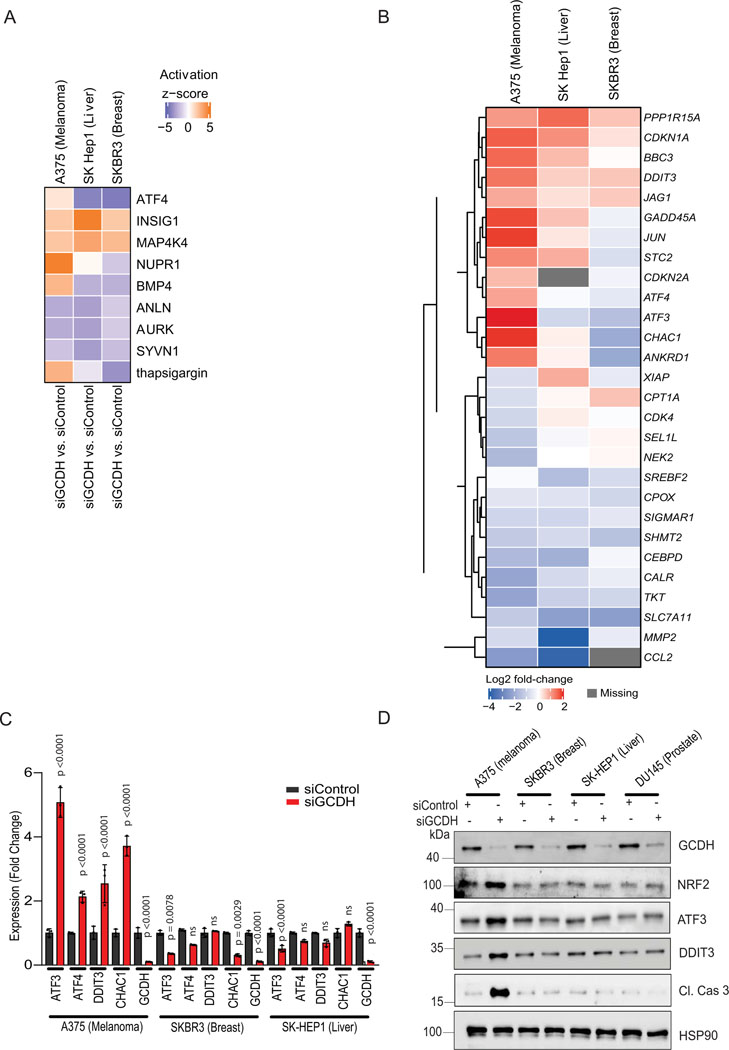
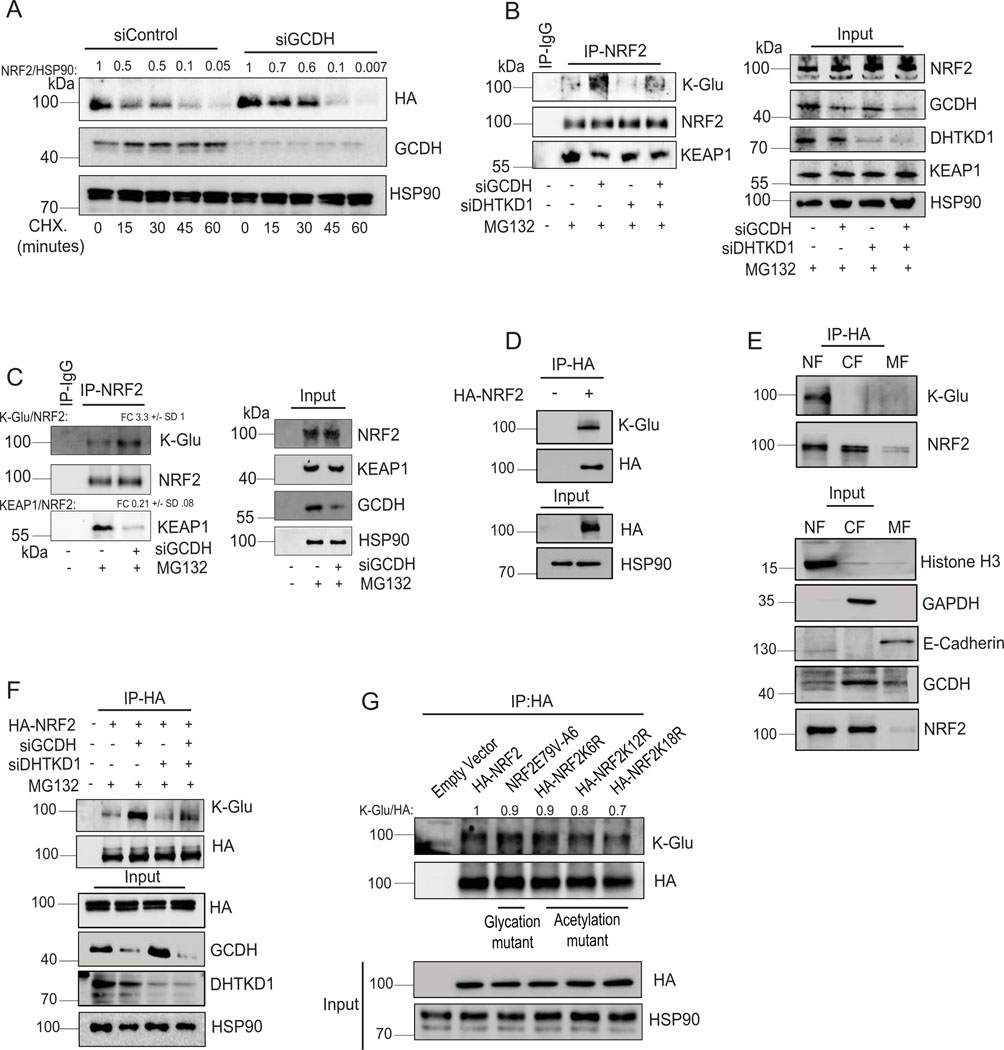
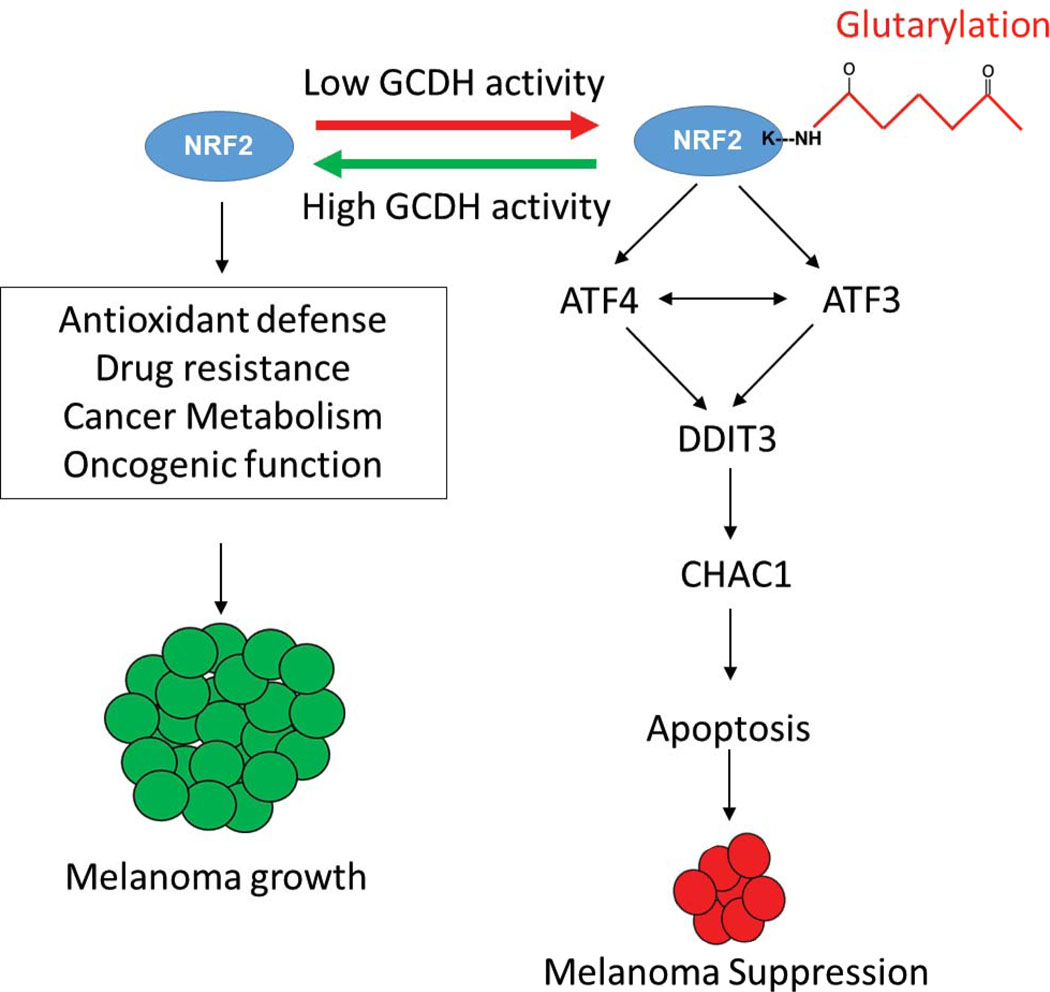
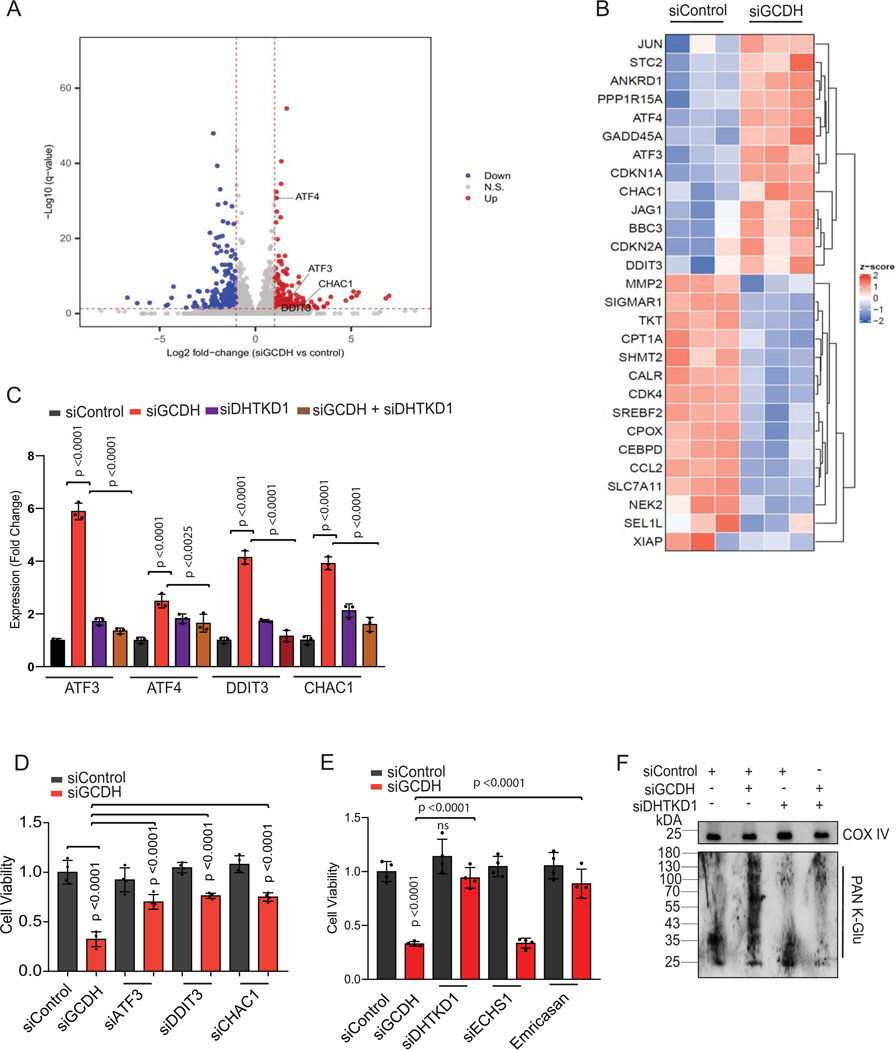
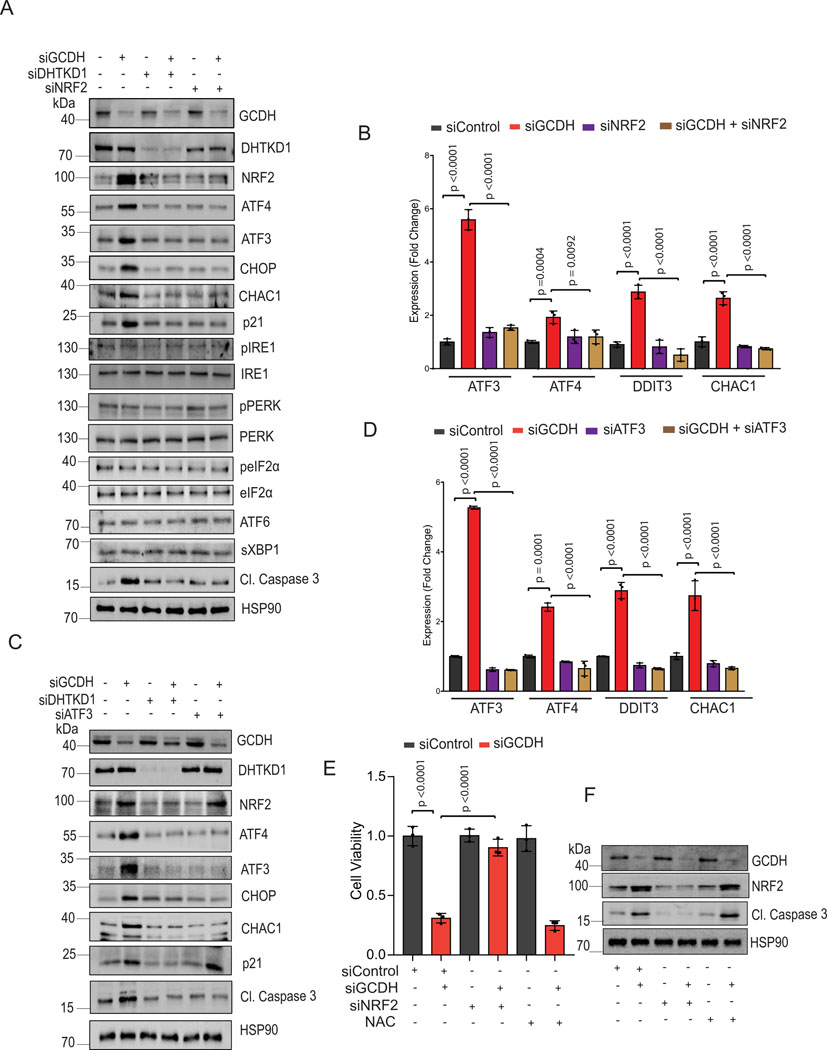
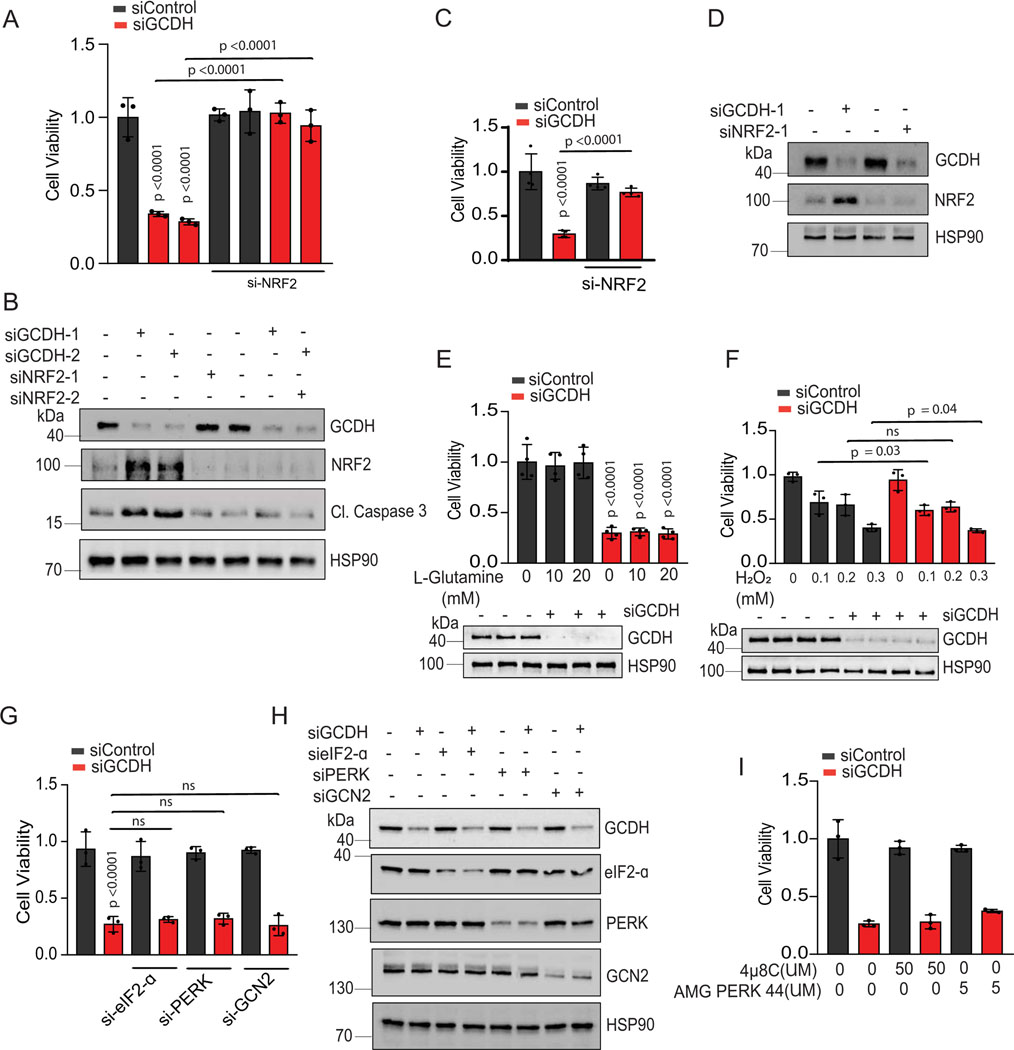
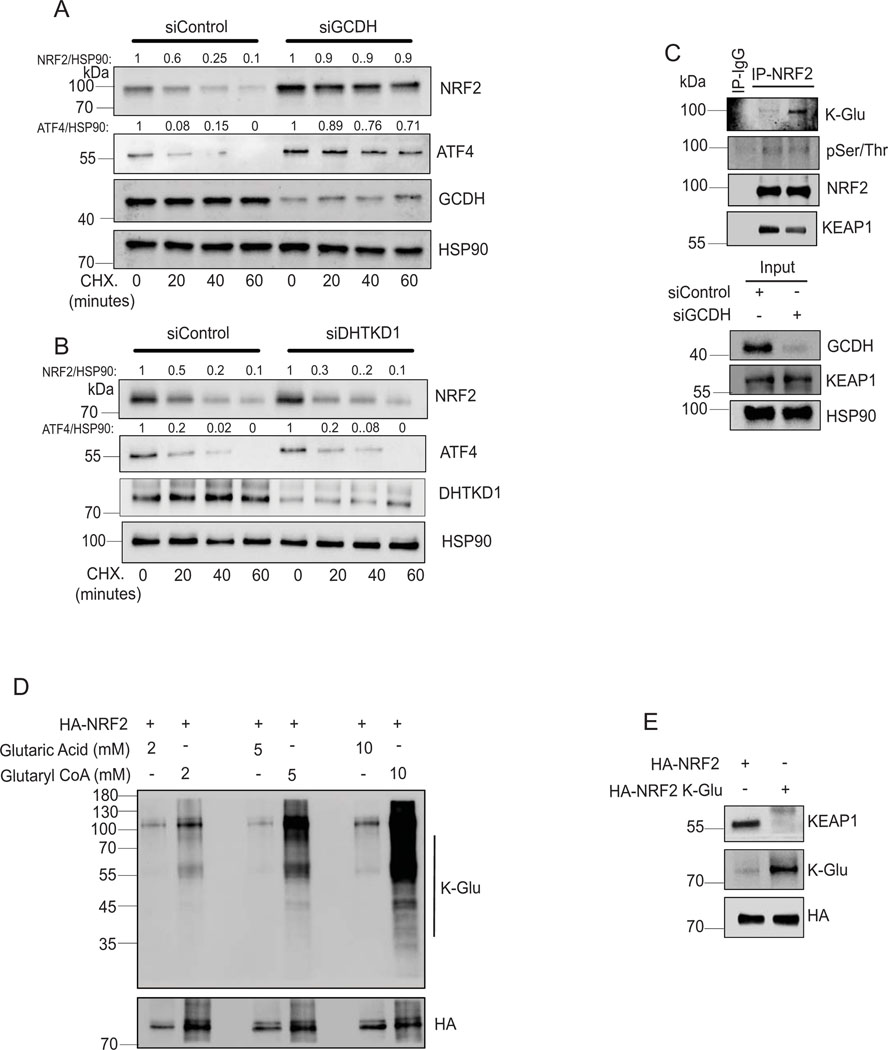
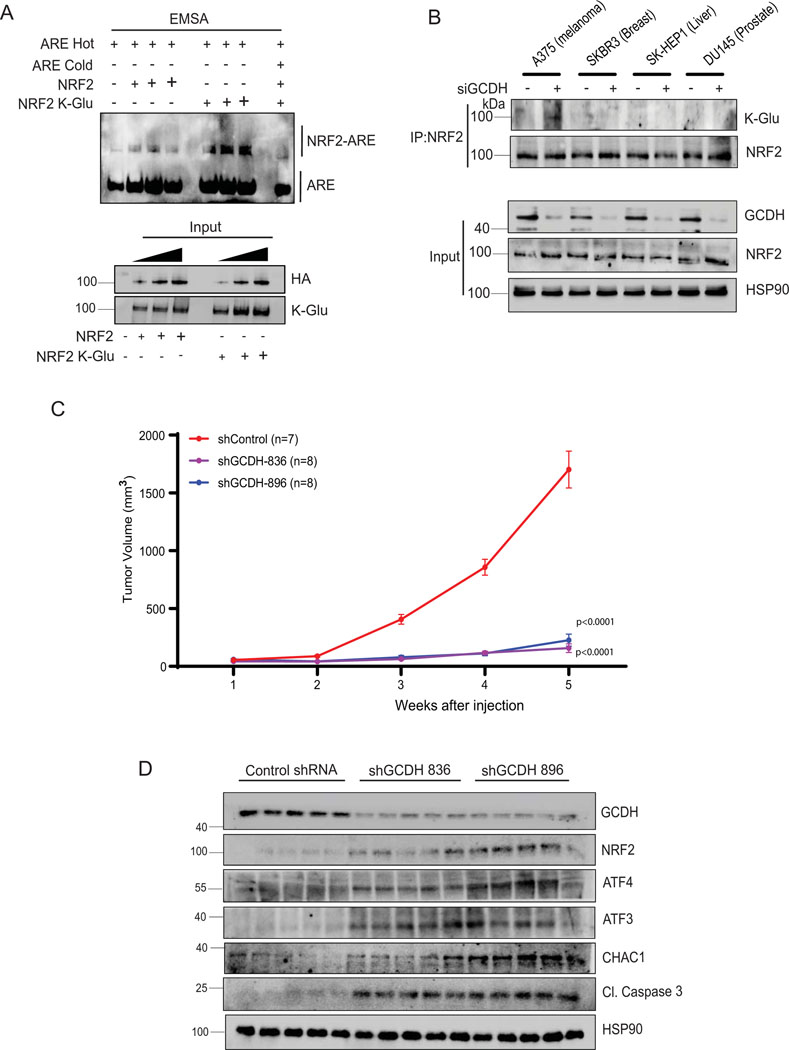
Tumour dependency on specific metabolic signals has been demonstrated and often guided numerous therapeutic approaches. We identify melanoma addiction to the mitochondrial protein glutaryl-CoA dehydrogenase (GCDH), which functions in lysine metabolism and controls protein glutarylation. GCDH knockdown induced cell death programmes in melanoma cells, an activity blocked by inhibition of the upstream lysine catabolism enzyme DHTKD1. The transcription factor NRF2 mediates GCDH-dependent melanoma cell death programmes. Mechanistically, GCDH knockdown induces NRF2 glutarylation, increasing its stability and DNA binding activity, with a concomitant transcriptional upregulation of ATF4, ATF3, DDIT3 and CHAC1, resulting in cell death. In vivo, inducible inactivation of GCDH effectively inhibited melanoma tumour growth. Correspondingly, reduced GCDH expression correlated with improved survival of patients with melanoma. These findings identify melanoma cell addiction to GCDH, limiting apoptotic signalling by controlling NRF2 glutarylation. Inhibiting the GCDH pathway could thus represent a therapeutic approach to treat melanoma.


Conflict of interest statement

Competing Interests Statement

ZAR and ER (fully divested) are founders and scientific advisors for Pangea Therapeutics. All other authors declare no conflict of interest.

Figures

Extended Data Fig. 1
GCDH inhibition promotes apoptosis of melanoma cells (A) UACC903 and 1205LU melanoma cells were transduced with siRNAs targeting AASS, AADAT, DHTKD1, GCDH, or ECHS1 or with a control sequence using Jetprime for 96 hr, followed by an analysis of cell viability. (B) Various melanoma cells were transfected with siRNAs targeting AASS, AADAT, DHTKD1, GCDH, or ECHS1 or with a control sequence for 72 hr, and then lysates were subjected to western analysis with indicated antibodies. (C) Cell growth after GCDH KD with two independent siRNAs for 0–96 hr in UACC903 or 1205LU cells. Proliferation was analyzed by counting cells at indicated time points. (D) UACC903 or 1205LU cells were transfected with GCDH siRNA for 72 hr, and then lysates were subjected to western analysis with indicated antibodies. (E) Viability assay of control or GCDH KD A375 cells treated with the caspase inhibitor Z-VAD(OH)-FMK (10μM for 48 hr). (F) A375 cells transfected with GCDH siRNA were grown in the indicated growth medium, and then viability was determined 96 hr-post transfections. (G) Measurement of basal, maximum oxygen consumption rate (OCR), and spare respiratory capacity using Agilent Seahorse XF Analyzers. A375 cells were transfected with GCDH siRNA for 48 hours before analysis. (H) Viability assay of immortalized H3A cells, 96 hr after transfection with indicated constructs. Viability was measured by quantifying crystal violet staining. (I) Immortalized H3A cells were transfected with siRNAs targeting AASS, AADAT, DHTKD1, GCDH, or ECHS1 or with a control sequence for 72 hours, then lysates were subjected to western analysis with indicated antibodies. Data are representative of three experiments for (B, D, and I) and presented as the mean values ± SD of n = 3 (A, C, and H), n= 4 (E and F) independent experiments and mean values ± SD of n = 6 technical replicates for (G). Each p value is adjusted to account for multiple comparisons. Statistical significance (indicated p-value or ns- not significant w.r.t control) was calculated using One-way ANOVA for (B, E ,F and H) and two-way ANOVA for (C). Statistics source data for Extended data figure 1 can be found in Source data files - Extended data figure 1 and uncropped scans of all blots and gels for Extended data figure 1 can be found in Source data files for blots - Extended figure 1.
Extended Data Fig. 2
GCDH expression correlates with melanoma patients outcome (A) Survival correlation analysis of GCDH expression in various cancer subtypes (prostate adenocarcinoma (PRAD), breast cancer (BRCA), diffuse large B-cell lymphoma (DLBC), glioblastoma (GBM), acute myeloid leukemia (LAML), liver hepatocellular carcinoma (LIHC), lung adenocarcinoma (LUAD), and lung squamous cell carcinoma (LUSC), using TCGA. (B) Comparison of patient survival based on analysis of NRF2 expression in melanoma patients using TCGA. Total number (n) of patients = 428; n (NRF2 high) =362 and n (NRF2 low) =66. (C) Scatterplot depicting a comparison of GCDH and NRF2 expression levels in TCGA-SKCM (melanoma) patient cohort. GCDH and NRF2 expressions are anti-correlated (Spearman correlation coefficient = −0.41). (D) Boxplots depicting GCDH expression in NRF2 high (n=362) and NRF2 low (n=66) patient samples stratified according to survival analysis of TCGA-SKCM patient cohort based on NRF2 expression (refer to NRF2 survival analysis in (B). The difference in expression of GCDH between NRF2 high and low groups is statistically significant (p-value = 8.653e-14, calculated using two-sided Wilcoxon Rank Sum test). NRF2 low group minimum = 242.2, maximum = 1907, median = 815.6, 1st quartile (25th percentile) = 633 and 3rd quartile (75th percentile) = 1142.5. NRF2 high group minimum = 132.8, maximum =1242.4, median =556.4, 1st quartile (25th percentile) = 446 and 3rd quartile (75th percentile) = 686.6. (E) Various cancer cells were transfected with siRNAs targeting GCDH or with a control sequence for 72 hr, and then lysates were subjected to confirm GCDH-KD. (F) GCDH expression was compared among various cancer cells and immortalized H3A cells. HSP90 was used as a loading control. Data are representative of three experiments. Uncropped scans of all blots and gels for Extended data figure 2 can be found in Source data files for blots - Extended figure 2.
Extended Data Fig. 3
DHTKD1 KD rescues GCDH KD- induced phenotypes. (A) Selected enriched canonical pathways from Ingenuity Pathway Analysis (IPA) of siGCDH vs. siControl differentially expressed genes. Shown pathways were selected from the top 20 canonical pathways based on enrichment p-value (p-value < 5.14e-3). (B) RT-qPCR analysis of UACC903 cells for relative expression of indicated transcripts following GCDH-KD or DHTKD1-KD alone or GCDH/DHTKD1 double KD. (C) Western blot analysis with indicated antibodies of lysates from A375 cells transfected with indicated siRNA for 96 hr. (D) RT-qPCR analysis of A375 cells for relative expression of indicated transcripts following GCDH-KD. (E) Western blot analysis on A375 cells after GCDH KD for 24–96 hr in A375 cells. Cells were transfected with siRNA targeting GCDH, and cell lysates were prepared at indicated time points. (F) SubG0 DNA content analysis by flow cytometry to evaluate A375 cell apoptosis. A375 cells were transfected for 72 hr with indicated siRNAs, harvested and fixed in ethanol, and stained with propidium iodide (PI). (G) Western blot analysis of indicated proteins in A375 cells following GCDH-KD or DHTKD1-KD alone or GCDH/DHTKD1 double KD. (H) Rescue of cell death seen in GCDH-KD 1205LU by DHTKD1-KD. Viability was measured by quantifying crystal violet staining. (I) Western blot analysis of indicated proteins in A375 lines. Data are representative of three experiments (C, E, G, and I), n= 1 experiment for F and presented as the mean values ± SD of n = 3 independent experiments for B, D and H. Statistical significance (indicated p-value or ns- not significant w.r.t control) was calculated using one-way ANOVA. Each p value is adjusted to account for multiple comparisons. Statistics source data for Extended data figure 3 can be found in Source data files - Extended data figure 3 and uncropped scans of all blots and gels for Extended data figure 3 can be found in Source data files for blots - Extended figure 3.
Extended Data Fig. 4
GCDH antagonizes NRF2-mediated activation of ATF3/4-dependent apoptotic signaling (A) GC-MS analysis of glutarate concentrations in A375 cells. (B) Western blot analysis of indicated proteins in UACC903 cells, 72 hr after transfection with siRNAs targeting GCDH, NRF2, or DHTKD1 or combinations thereof. (C) RT-qPCR analysis of NRF2 transcript levels in A375 and UACC903 cells, 72 hr following transfection with GCDH siRNAs. (D) RT-qPCR analysis of ATF3, ATF4, DDIT3, and CHAC1 transcript levels in UACC903 cells, 72 hr following transfection with indicated siRNAs. (E) Western blot analysis of indicated proteins in UACC903 cells 72 hr following transfection with siRNAs targeting GCDH, ATF3, or DHTKD1 or combinations thereof. After quantification, signals obtained in panels B and E for 3 independent experiments were used to calculate the ratio of the indicated protein relative to HSP90 levels, described as fold change (FD) +/−SD for indicated proteins. (F) RT-qPCR analysis of ATF3, ATF4, DDIT3, and CHAC1 expression levels in UACC903 following transfection with indicated siRNAs. Data are representative of three experiments for (B and E), presented as the mean values ± SD of n = 3 independent experiments for C, D and F and mean values ± SD of n = 3 technical replicates for A. Statistical significance (indicated p-value or ns- not significant w.r.t control) was calculated using one-way ANOVA. Each p value is adjusted to account for multiple comparisons. Statistics source data for Extended data figure 4 can be found in Source data files - Extended data figure 4 and uncropped scans of all blots and gels for Extended data figure 4 can be found in Source data files for blots - Extended figure 4.
Extended Data Fig. 5
Cell death upon GCDH KD in melanoma is ATF3/4-dependent (A) Selected upstream regulators and their activation z-scores obtained from Ingenuity Pathway Analysis (IPA) of differentially expressed (DE) genes in siGCDH vs. siControl comparisons in A375 (melanoma), SK-Hep1 (liver cancer), and SKBR3 (breast cancer). (B) Heatmap of log2 fold-changes of selected targets of ATF4-ATF3 computed from siGCDH vs. siControl comparisons in melanoma (A375), liver cancer (SK-Hep1), and breast cancer (SKBR3). Rows (genes) were hierarchically clustered. Missing values correspond to genes that were not expressed in the given samples. (C) RTqPCR analysis of ATF3, ATF4, DDIT3 and CHAC1 expression in various cancer cells transfected with indicated siRNAs. (D) Western blot analysis of indicated proteins in indicated cells 72 hr following transfection with control or GCDH siRNAs. Data are representative of three experiments for (D) and presented as the mean values +/− SD of n = 3 independent experiments for (C). Statistical significance (indicated p-value or ns- not significant w.r.t control) was calculated using one-way ANOVA. Each p value is adjusted to account for multiple comparisons. Statistics source data for Extended data figure 5 can be found in Source data files - Extended data figure 5 and uncropped scans of all blots and gels for Extended data figure 5 can be found in Source data files for blots - Extended figure 5.
Extended Data Fig. 6
Lysine glutarylation antagonizes KEAP1 binding, increasing NRF2 stability (A) Cycloheximide (CHX) chase analysis of HA-NRF2 stability in control and GCDH KD HEK-293T cells ectopically expressing HA-NRF2. HEK293T cells were transfected for 72 hr with indicated constructs and treated with 50 μM Cycloheximide (CHX) for different time periods, followed by western blotting with indicated antibodies. After quantification, signals obtained were used to calculate HA-NRF2/HSP90 ratios and described as fold change relative to CHX treatment time = 0. (B) Immunoprecipitation and Western blot analysis of A375 transfected with indicated constructs. Cells were treated with the proteasomal inhibitor MG132 for 4 hr, followed by IP/Western blotting analysis with antibodies to detect K-Glu PTM, KEAP1, and NRF2. (C) Immunoprecipitation and Western blot analysis of UACC903 cells transfected with indicated constructs as described in (B). (D) HEK293T cells were transfected with HA-NRF2 for 72 hr, and NRF2 glutarylation was measured in HA-NRF2 pull-downs fractions using HA-binding beads. (E) Enrichment of NRF2 glutarylation in nuclear fractions was measured in HA-NRF2 pull-downs from HEK293T cells transfected with HA-NRF2 after an initial cell fractionation step to isolate membrane (MF), cytoplasmic (CF), and nuclear (NF) fractions. Successful fractionation was confirmed by immunoblotting with indicated markers: MF (E-cadherin), CF (GAPDH), and NF (Histone H3). (F) HEK293T cells transfected with indicated constructs and IP of indicated HA-NRF2 mutants using HA-affinity beads were performed, followed by Western blot analysis using K-Glu and HA-tag antibodies. (G) HEK293T cells were transfected with indicated constructs and IP of various HA-NRF2 mutants using HA-affinity beads, followed by Western blot analysis using K-Glu and HA-tag antibodies. After quantification, signals obtained were used to calculate K-Glu/HA-NRF2 ratios and described as fold change relative to HA-NRF2 control. After quantification, signals obtained in panels C for 3 independent experiments were used to calculate the ratio of the indicated protein relative to NRF2 levels in IP samples, described as fold change (FD) +/−SD for indicated proteins. Data are representative of three experiments. Statistics source data for Extended data figure 6 can be found in Source data files - Extended data figure 6 and uncropped scans of all blots and gels for Extended data figure 6 can be found in Source data files for blots - Extended figure 6.
Extended Data Fig. 7
Melanoma Addiction to GCDH is mediated by NRF2 The model shows GCDH control of NRF2 glutarylation and the implications for ATF4-ATF3-DDIT3-CHAC1 signaling culminating in apoptosis of melanoma cells subjected to GCDH inhibition.
Figure 1.
Figure 1.. GCDH is required for melanoma cell survival
(A) Schematic representation of enzymes functioning in the lysine catabolic pathway. (B) A375 melanoma cells were transfected 96 hr with siRNAs targeting AASS, AADAT, DHTKD1, GCDH, ECHS1 or control sequence using Jetprime. Cell viability was then measured by quantifying crystal violet staining. (C) Growth of A375 cells upon GCDH KD with two independent siRNAs assessed over a 24–96 hr period post transfection. Growth was analyzed by cell counting at indicated time points. (D) A375 cells were transfected with siRNA against GCDH, and western blot analysis performed with indicated antibodies. (E) Cell viability assay of control or GCDH KD A375 cells treated with the caspase inhibitor Emriscan (10μM for 48 hr). (F) Cell viability assay of indicated cells 96 hr after transfection with siRNAs targeting GCDH. Cell viability was measured by quantifying crystal violet staining. (G) Western blot analysis confirming GCDH KD as described in D. (H) Analysis of A375 cell viability upon GCDH KD alone or combined with treatment with Pifithrin-α or KU-55933. (I) Comparison of patient survival based on analysis of GCDH expression in melanoma patients using TCGA (p value 7.100673e-5). Total number (n) of patients = 428; n (GCDH high) =328 and n (GCDH low) =100. (J) Cell viability was measured by quantifying crystal violet staining upon GCDH KD in indicated cancer lines. Data are representative of three experiments (D and G) and presented as mean values ± SD of n = 3 for (B, C, F, H) and n=4 for (J) independent experiments. Statistical significance (indicated p-value or ns- not significant (w.r.t si-Control) was calculated using one-way ANOVA for (B, F, H, and J) and two-way ANOVA for (C). Each p value is adjusted to account for multiple comparisons. P values in figures correspond to the comparison between siControl and siGCDH. The survival curves and p-values were computed using survfit function in R survival package (Kaplan-Meier survival curve and two-sided log rank test with no adjustments for multiple comparisons) for (I). Statistics source data for Figure 1 can be found in Source data files - Figure 1 and uncropped scans of all blots and gels for figure 1 can be found in Source data files for blot- Figure 1.
Figure 2.
Figure 2.. GCDH inhibition promotes DHTKD1-dependent cell death.
(A) Volcano plot showing elevated expression of ATF4-ATF3 targets controlling the DHTKD1-mediated cell death cascade (ATF3, ATF4, DDIT3, and CHAC1), as identified by RNA-seq analysis. (B) Heatmap showing differential expression of ATF3/4 downstream targets in GCDH KD A375 cells, as identified by RNA-seq analysis. (C) RT-qPCR validation of ATF3, ATF4, DDIT3, and CHAC1 in A375 cells transfected with indicated siRNAs. (D and E) Viability of A375 cells transfected for 96 hr with indicated siRNAs. Viability was analyzed by crystal violet staining. (F) Western blot analysis of mitochondrial extracts from A375 cells using PAN K-Glu antibody to detect lysine glutarylation 72 hr after transfection with indicated siRNAs. COX IV was used as a loading control. Data are representative of three experiments for (F) and presented as the mean values ± SD of n = 3 for (C) and n=4 for (D and E). Statistical significance (indicated p-value or ns- not significant w.r.t control) was calculated using one-way ANOVA for (C, D, and E). Each p value is adjusted to account for multiple comparisons. Statistics source data for Figure 2 can be found in Source data files - Figure 2 and uncropped scans of all blots and gels for figure 2 can be found in Source data files for blot- Figure 2.
Figure 3.
Figure 3.. GCDH loss increases NRF2 levels and enhances cell death.
Western blot analysis of indicated proteins in A375 cells 72 hr following transfection with indicated siRNAs. (B) RT-qPCR analysis of ATF3, ATF4, DDIT3, and CHAC1 expression in A375 cells following transfection with indicated siRNAs. (C) Western blot analysis of indicated proteins in A375 cells 72 hr following transfection with indicated siRNAs. (D) RT-qPCR analysis of ATF3, ATF4, DDIT3, and CHAC1 expression in A375 cells following transfection with indicated siRNAs. (E) Viability assay of A375 cells transfected with indicated siRNAs for 48 hours and then treated or untreated with NAC (10mM) for 48 hours (F) Western blot analysis of indicated proteins in A375 cells 72 hr following transfection. Data are representative of three experiments for (A, C, and F) and presented as the mean values ± SD of n = 3 independent experiments for (B, D, and E). Statistical significance (indicated p-value or ns- not significant w.r.t control) was calculated using one-way ANOVA for (B), (D,) and I. Each p value is adjusted to account for multiple comparisons. Statistics source data for Figure 3 can be found in Source data files – Figure 3 and uncropped scans of all blots and gels for figure 3 can be found in Source data files for blot- Figure 3.
Figure 4.
Figure 4.. Cell death following GCDH inhibition is NRF2 dependent.
(A) Rescue of cell death seen in GCDH-KD A375 cells by NRF2-KD using independent siRNAs. Viability was measured by quantifying crystal violet staining. (B) Western blot analysis of indicated proteins in A375 cells, 72 hr after transfection with siRNAs targeting GCDH and NRF2. (C) Rescue of cell death seen in GCDH-KD UACC903 cells by NRF2-KD. Viability was measured by quantifying crystal violet staining. (D) Western blot analysis of indicated proteins in UACC903 cells, 72 hr after transfection with siRNAs targeting GCDH and NRF2. (E and F) Cell viability assay of control or GCDH KD A375 cells treated with the L-glutamine or hydrogen peroxide (H2O2). GCDH KD was confirmed by western blot analysis. (G) Viability assay of A375 cells transfected with indicated siRNAs for 96 hr. (H) Western blot analysis of indicated proteins in A375 cells 72 hr following transfection. (I) Cell viability assay of control or GCDH KD A375 cells treated with were IRE1 inhibitor (4μ8C) or PERK inhibitor (AMG PERK 44) for 48 hr. Data are representative of three experiments and presented as the mean values ± SD of n = 3 for (A, F, and G) and n=4 for (E and C) independent experiments. Statistical significance (indicated p-value or ns- not significant w.r.t control) was calculated using one-way ANOVA. Each p value is adjusted to account for multiple comparisons. Statistics source data for Figure 4 can be found in Source data files - Figure 4 and uncropped scans of all blots and gels for figure 4 can be found in Source data files for blot- Figure 4.
Figure 5.
Figure 5.. Lysine glutarylation attenuates KEAP1 binding increasing NRF2 stability.
(A, B) Cycloheximide (CHX) chase analysis of half-life of endogenous NRF2 and ATF4 proteins in A375 cells transfected with indicated siRNAs. Western blot was performed on lysates of A375 cells transfected with siControl (A) or siGCDH (B) for 72 hr and then treated with 50 μM Cycloheximide (CHX) for indicated times. After quantification, signals obtained in panels A and B were used to calculate the NRF2/HSP90 and ATF4/HSP90 ratios and described the CHX treatment period as fold change relative to CHX treatment time = 0. (C) Immunoprecipitation and Western blot analysis of A375 transfected with indicated constructs. Cells were treated with the proteasomal inhibitor MG132 for 4 hr, followed by IP/Western blotting analysis with antibodies to detect K-Glu PTM, pSer/Thr PTM, KEAP1, and NRF2. (D) In vitro glutarylation assay on purified HA-NRF2 following incubation with the indicated concentration of glutaryl CoA. (E) In vitro KEAP1 binding analysis was performed using purified HA-NRF2 or K-Glu-NRF2 as bait on A375 cell lysates. Data are representative of three experiments. Statistics source data for Figure 5 can be found in Source data files - Figure 5 and uncropped scans of all blots and gels for figure 5 can be found in Source data files for blot- Figure 5.
Figure 6.
Figure 6.. Inducible GCDH KD decreases melanoma proliferation and tumorigenesis
(A) Relative DNA binding activity of purified HA-NRF2 or K-Glu-NRF2, as measured in vitro by NRF2/ARE EMSA using non-denaturing PAGE followed by western blotting. Gel shifted complex of NRF2/ARE-Biotin labeled DNA probe was detected using a streptavidin-HRP antibody. (B) Immunoprecipitation and Western blot analysis of indicated cell lines using NRF2 antibody. Cells were treated with the proteasomal inhibitor MG132 for 4 hr, followed by IP/Western blotting analysis with HA/NRF2 antibody to detect K-Glu PTM and NRF2. (C) Volume of tumors in NOD/SCID (NOD.CB17-Prkdcscid/J) mice infused with 1 × 10⁶ human A375 melanoma cells harboring one of two GCDH shRNAs (836 or 896) or control shRNA sequence (shControl). Following 5 days post-injection of A375 cells, mice were fed Dox chow to induce KD. After that, tumor volume was measured every 7 days with linear calipers and calculated using the formula: (length in mm × width in mm) x ½ and plotted with respect to time. Tumors were harvested at the end of week 5 for analysis of GCDH KD. (D) Western blot analysis showing levels of indicated proteins in tumors harvested from indicated control or GCDH KD mice (n=5 each), as described in A. Data are presented as the mean values ± SEM of (n = 7 control shRNA, n=8 for shGCDH-836 and n= 8 for shGCDH-896). Each p value is adjusted to account for multiple comparisons. Statistical significance (indicated p-value relative to control) was calculated using 2-way ANOVA. Statistics source data for Figure 6 can be found in Source data files - Figure 6 and uncropped scans of all blots and gels for figure 6 can be found in Source data files for blot- Figure 6.

References

    1. Palm W. & Thompson CB Nutrient acquisition strategies of mammalian cells. Nature 546, 234–242 (2017). - PMC - PubMed
    1. Zhu J. & Thompson CB Metabolic regulation of cell growth and proliferation. Nat Rev Mol Cell Biol 20, 436–450 (2019). - PMC - PubMed
    1. Vander Heiden MG & DeBerardinis RJ Understanding the Intersections between Metabolism and Cancer Biology. Cell 168, 657–669 (2017). - PMC - PubMed
    1. Lieu EL, Nguyen T, Rhyne S. & Kim J. Amino acids in cancer. Exp Mol Med 52, 15–30 (2020). - PMC - PubMed
    1. Hirschey MD & Zhao Y. Metabolic Regulation by Lysine Malonylation, Succinylation, and Glutarylation. Mol Cell Proteomics 14, 2308–2315 (2015). - PMC - PubMed

Publication types

MeSH terms