. 2022 Sep;24(9):1364-1377.
doi: 10.1038/s41556-022-00974-0. Epub 2022 Sep 1.

Identification of two pathways mediating protein targeting from ER to lipid droplets

Affiliations

Identification of two pathways mediating protein targeting from ER to lipid droplets

Jiunn Song et al. Nat Cell Biol. 2022 Sep.

Abstract

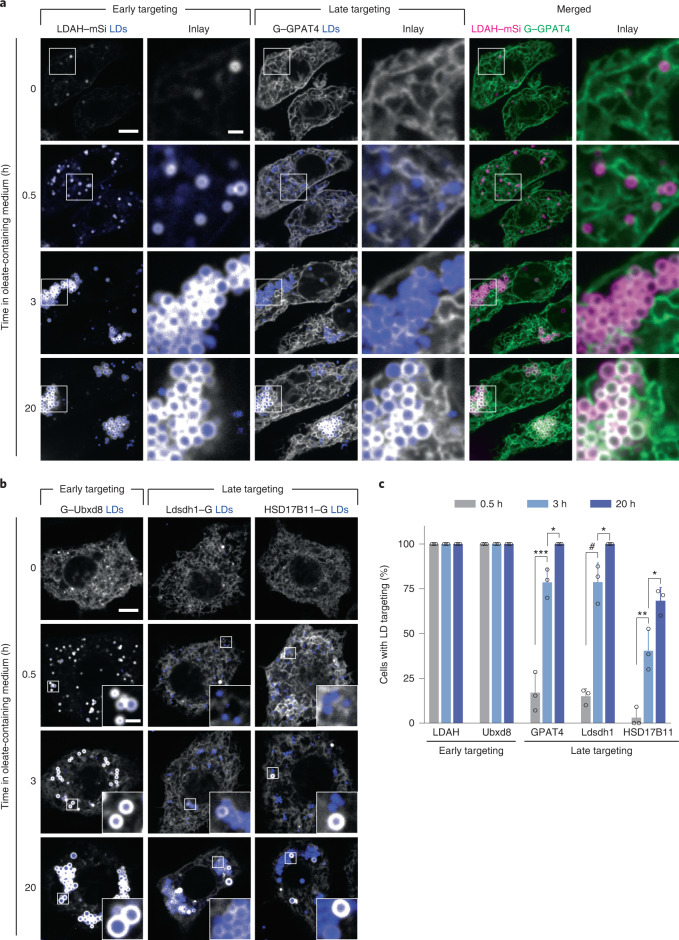
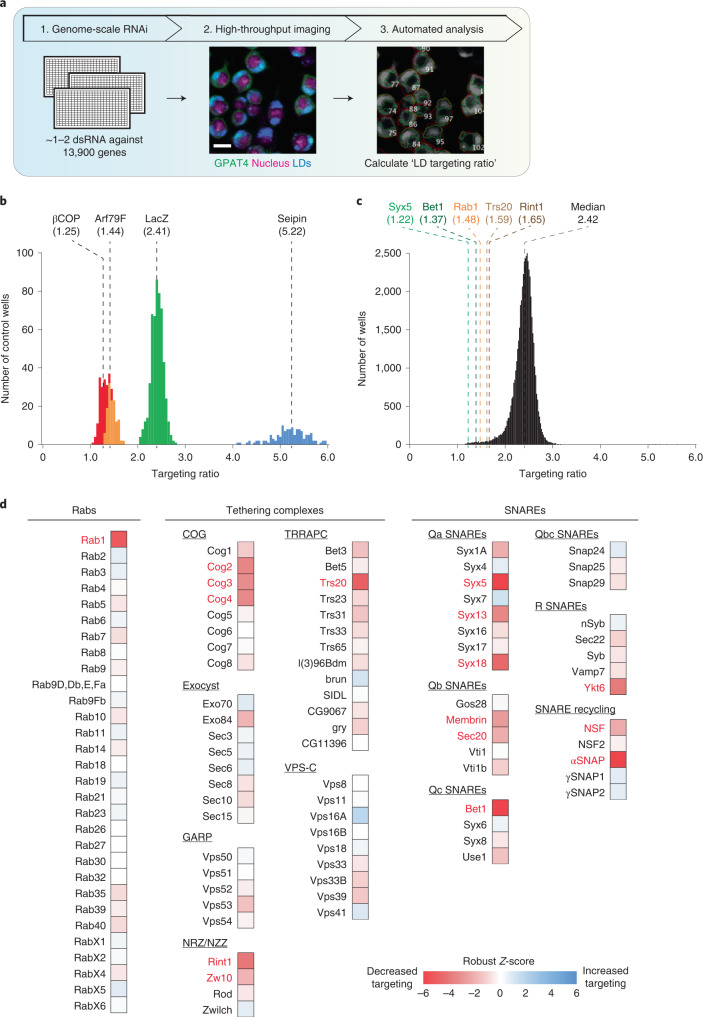
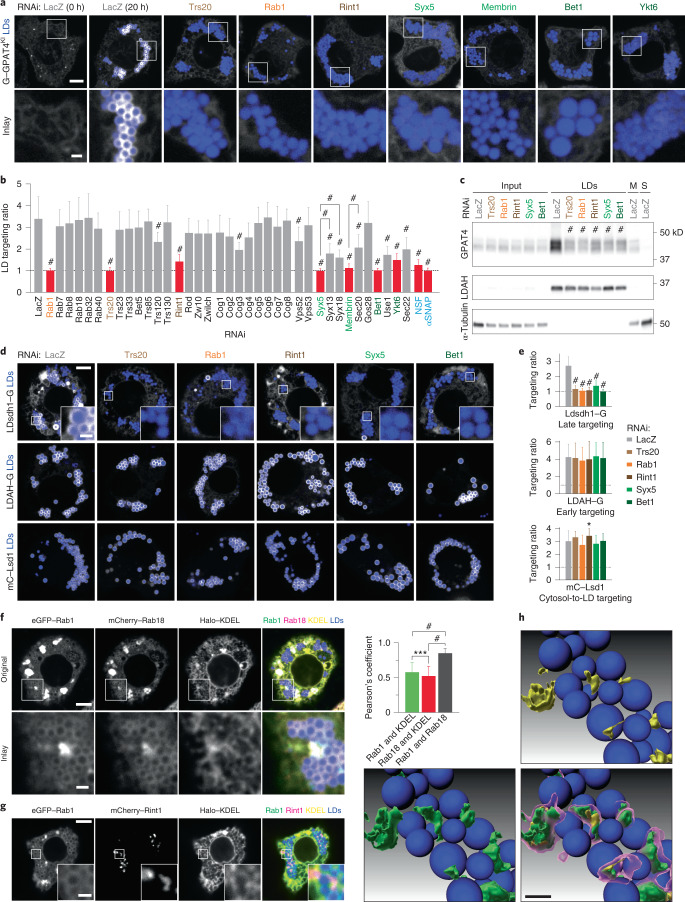
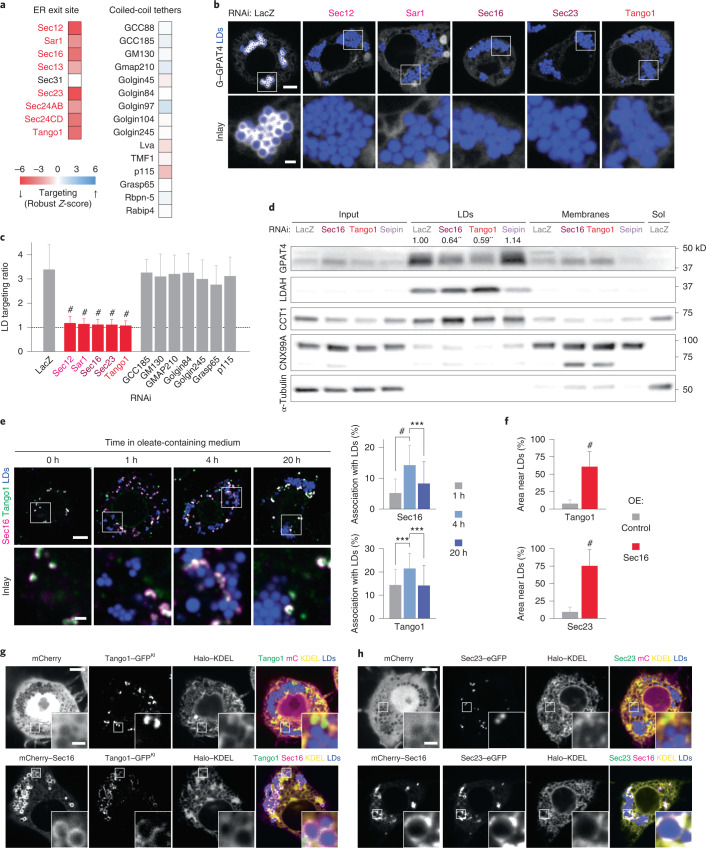
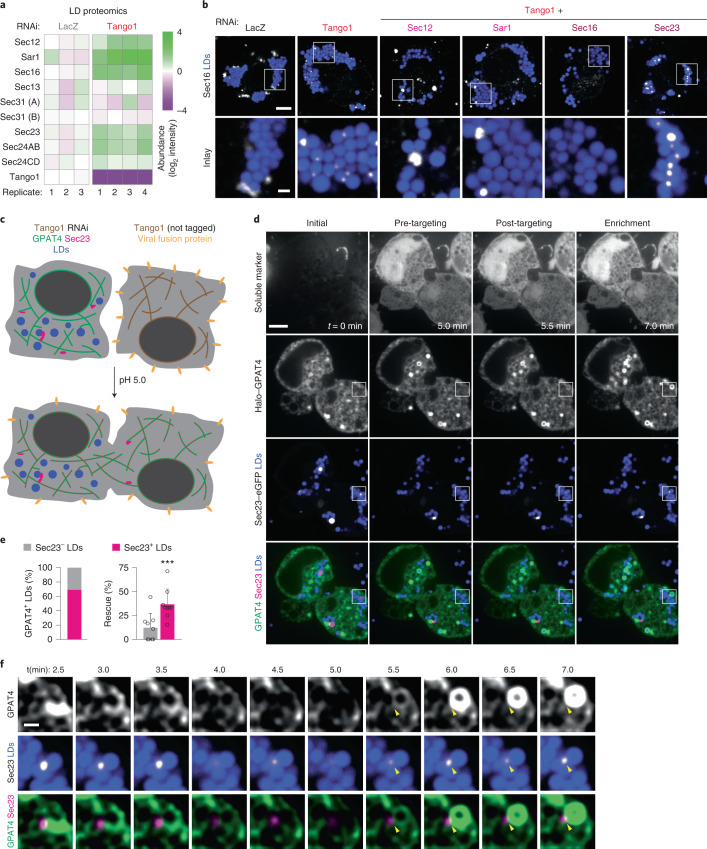
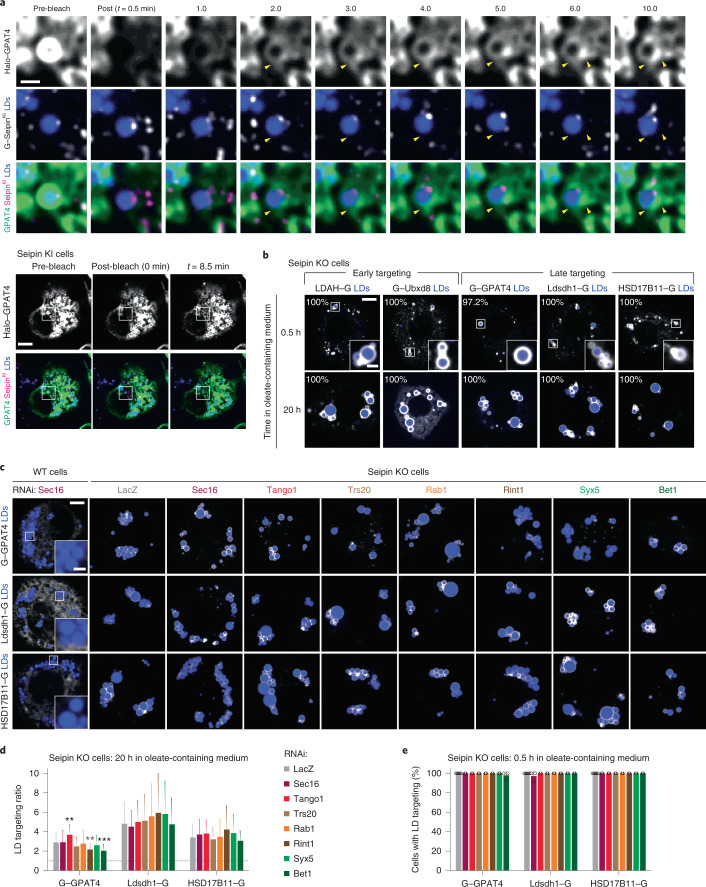
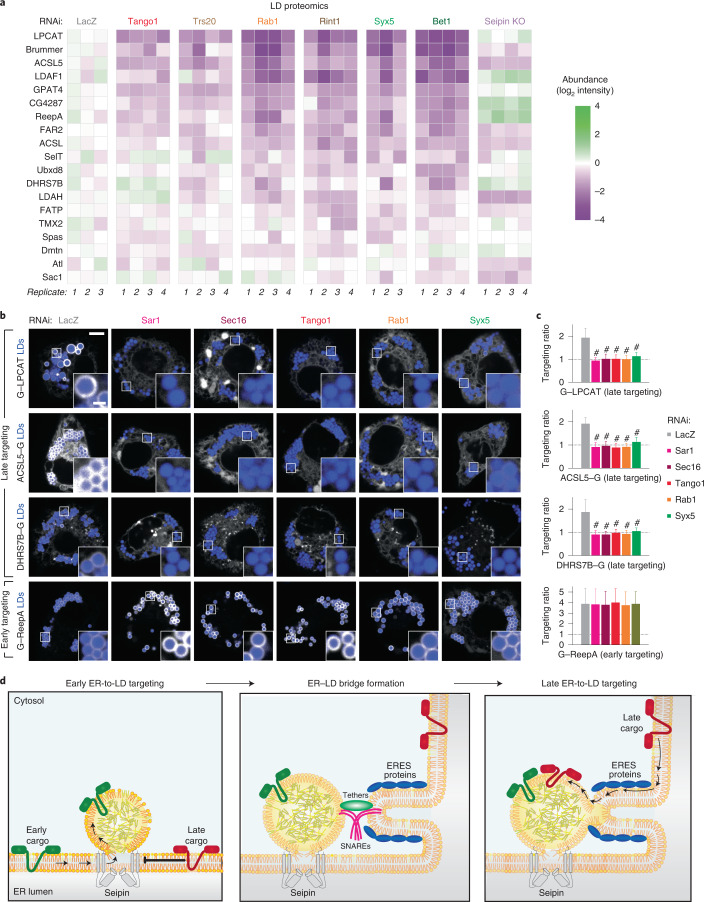
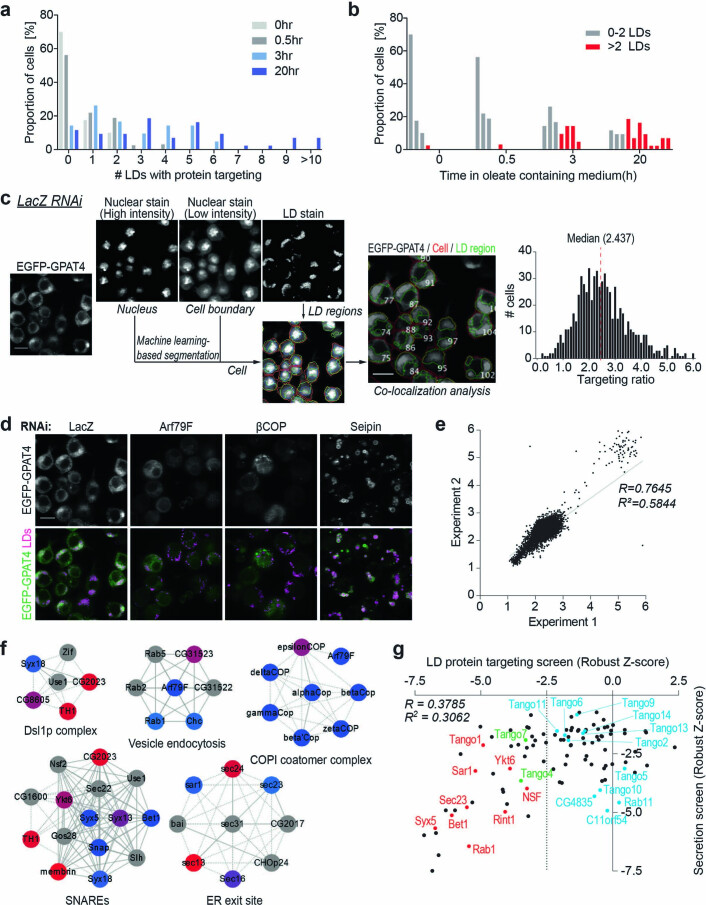
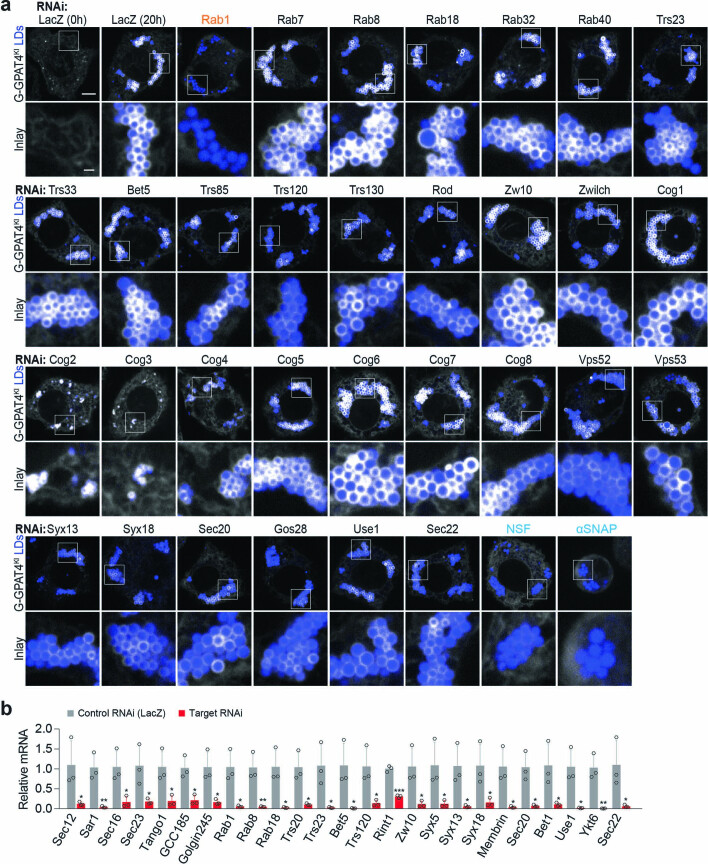
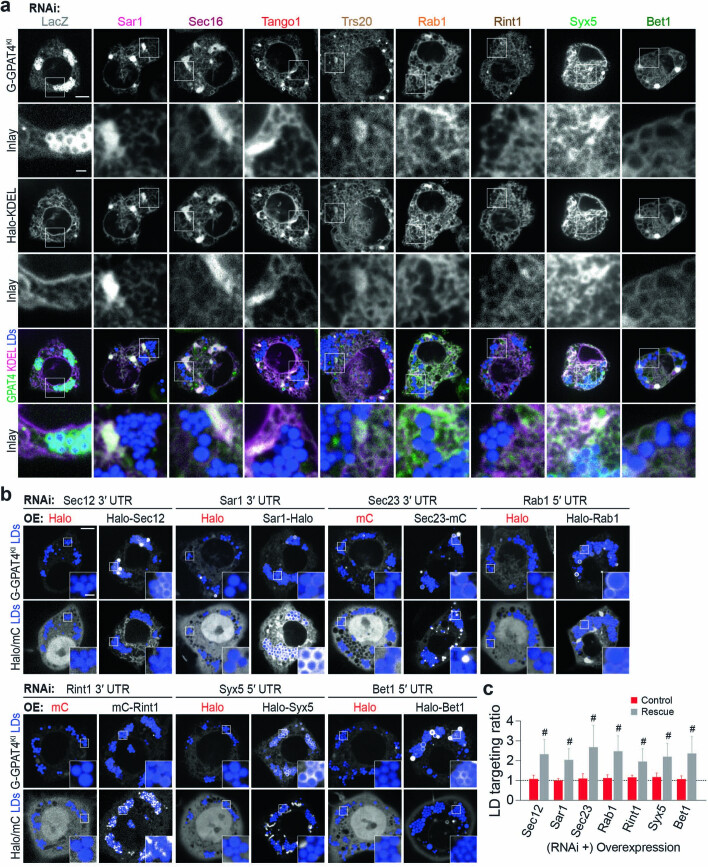
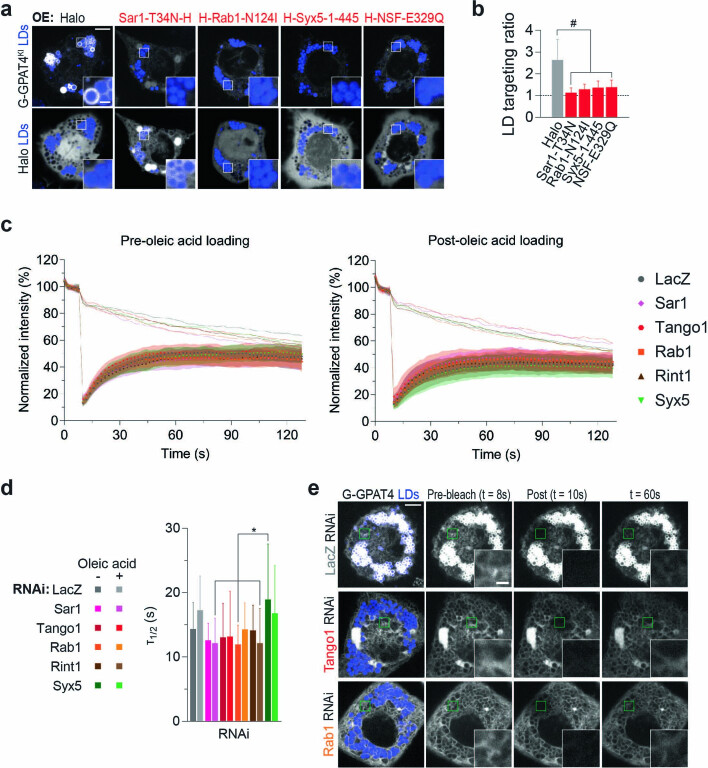
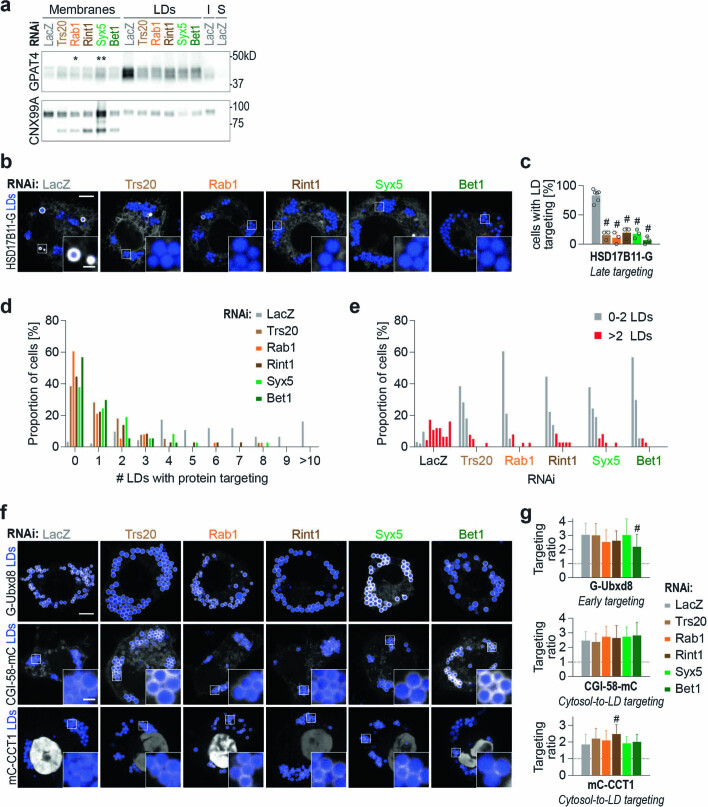
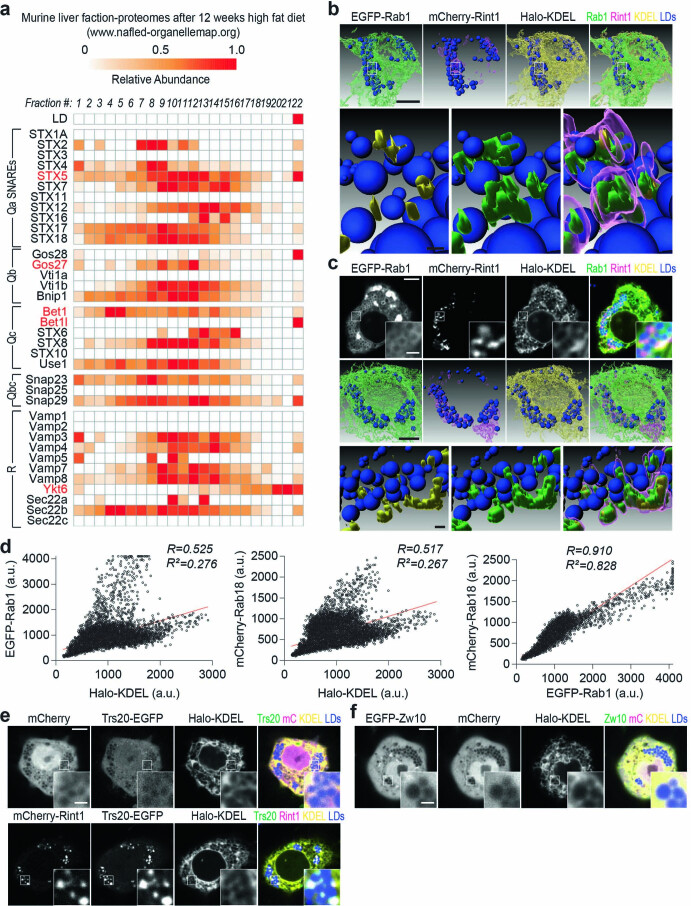
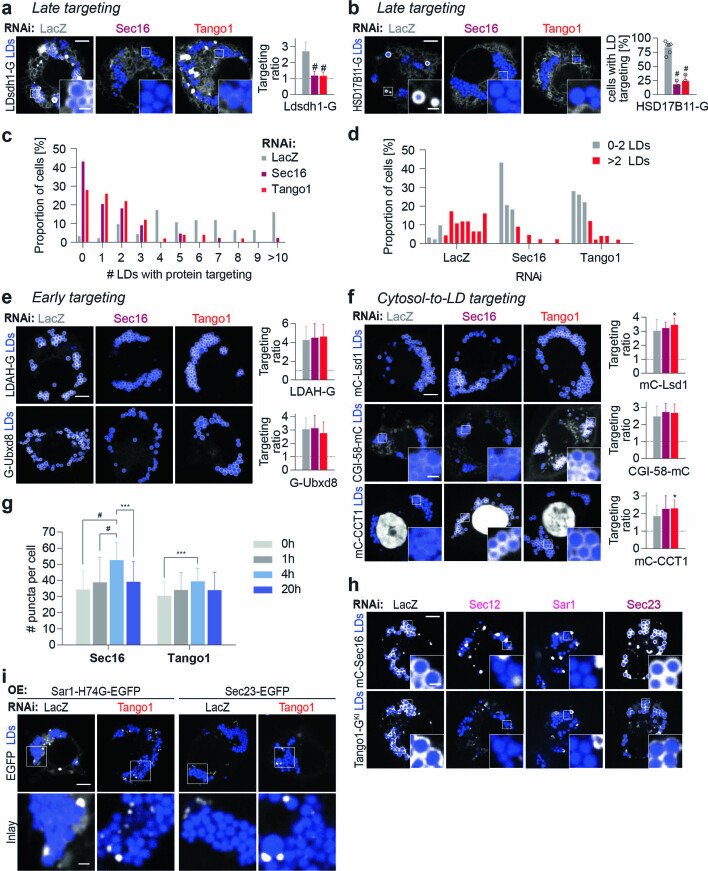
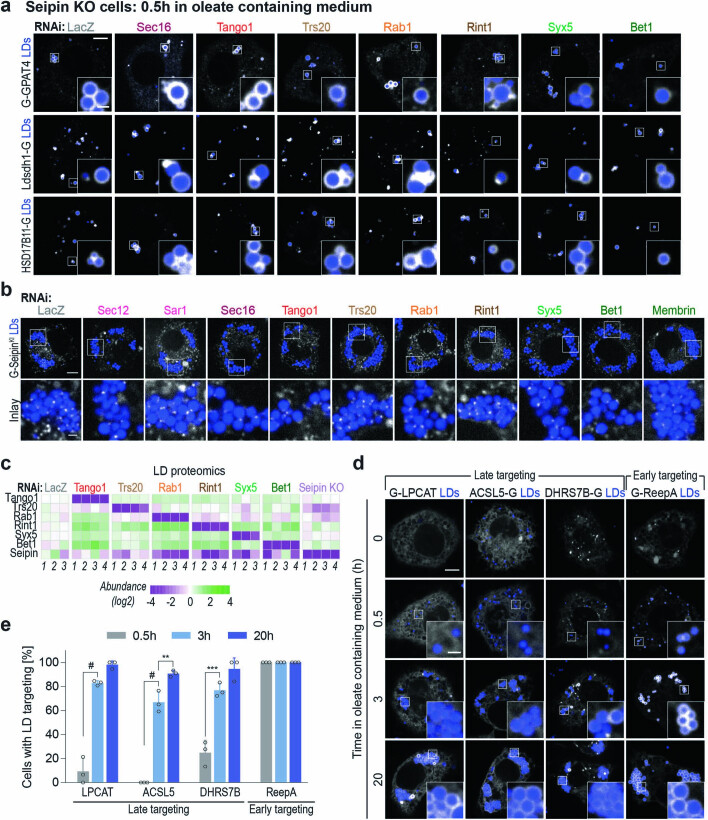
Pathways localizing proteins to their sites of action are essential for eukaryotic cell organization and function. Although mechanisms of protein targeting to many organelles have been defined, how proteins, such as metabolic enzymes, target from the endoplasmic reticulum (ER) to cellular lipid droplets (LDs) is poorly understood. Here we identify two distinct pathways for ER-to-LD protein targeting: early targeting at LD formation sites during formation, and late targeting to mature LDs after their formation. Using systematic, unbiased approaches in Drosophila cells, we identified specific membrane-fusion machinery, including regulators, a tether and SNARE proteins, that are required for the late targeting pathway. Components of this fusion machinery localize to LD-ER interfaces and organize at ER exit sites. We identified multiple cargoes for early and late ER-to-LD targeting pathways. Our findings provide a model for how proteins target to LDs from the ER either during LD formation or by protein-catalysed formation of membrane bridges.


Conflict of interest statement

The authors declare no competing interests.

Figures

Fig. 1
Fig. 1. ER proteins target LDs early during LD formation, or late after LD induction.
a, ER proteins LDAH and GPAT4 target LDs early (by 30 min) or late (after several hours), respectively, upon LD biogenesis. Confocal imaging of live Drosophila S2R+ cells stably overexpressing eGFP (G)–GPAT4 transfected with an LDAH–mScarlet-I (mSi) encoding construct at given timepoints after 1 mM oleic acid treatment. LDs were stained with LipidTOX Deep Red Neutral Lipid Stain. Representative images from three independent experiments are shown. Scale bars, 5 μm and 1 μm (inlay). b, Ubxd8 targets LDs early, and Ldsdh1 and HSD17B11 target LDs late upon LD biogenesis. Confocal imaging of live wild-type cells transiently transfected with eGFP tagged constructs at given timepoints after 1 mM oleic acid treatment. LDs were stained with monodansylpentane (MDH). Representative images are shown. Scale bars, 5 μm and 1 μm (inlay). c, Bar graph showing percentage of cells with LD targeting over time from the imaging experiment in a and b. For HSD17B11, cells with LD targeting were defined as those with more than two LDs with protein targeting in the imaging plane (Extended Data Fig. 1a,b). Mean ± standard deviation (s.d.), n = 3 experiments (10–16 cells each). One-way analysis of variance (ANOVA) with Bonferroni correction, *P < 0.05 (from left to right: 0.0442, 0.0240 and 0.0195), **P = 0.0048, ***P = 0.0002, #P < 0.0001. Source numerical data are available in source data. Source data
Fig. 2
Fig. 2. Genome-scale imaging screen reveals that the membrane-fusion machinery is required for GPAT4 targeting to LDs.
a, Overview of genome-scale imaging screen. Scale bar, 10 μm. b, Histogram of LD targeting ratios of screen controls (n = 528 for LacZ; n = 132 for βCOP, Arf79F and seipin). Dotted lines indicate median values for each control. c, Histogram of all targeting ratios in the screen (n = 50,688). Median of all targeting ratios is indicated in black. Targeting ratios of select screen hits are also indicated. d, Heat map of robust Z-scores for different classes of membrane fusion machinery (Rabs, tethering complexes and SNAREs) from the imaging screen. Genes of which knockdown results in robust Z-score < −2.5 are highlighted in red. Source numerical data are available in source data. Source data
Fig. 3
Fig. 3. A membrane-fusion regulator, a tether and SNAREs are required for late ER-to-LD protein targeting.
a, Depletion of specific Rab, membrane-tethering complex components and SNAREs abolished endogenous GPAT4 targeting to LDs. Confocal imaging of eGFP–GPAT4KI cells upon RNAi of membrane-fusion machinery components, followed by a 20-h incubation in oleate-containing medium. Scale bars, 5 μm and 1 μm (inlay). b, Quantification of a and Extended Data Fig. 2a. Mean ± s.d., n = (left to right) 59; 31, 19, 21, 45, 19 and 18; 26, 31, 32, 18, 30, 38 and 33; 20, 29, 18 and 19; 19, 20, 17, 19, 19, 20, 19 and 18; 23, 20; 27 29 and 25; 18, 37 and 20; 43, 18; 24 and 22; 17 and 30 cells examined over two or three independent experiments. Red: knockdowns that abolish GPAT4 targeting to LDs on imaging. One-way ANOVA with Bonferroni correction, #P < 0.0001, compared with LacZ unless otherwise indicated. c, Depletion of specific Rab, membrane-tethering complex components and SNAREs reduces GPAT4 amount in LD fractions. Western blot analysis of wild-type cell fractions upon RNAi and LD induction. Left: protein target. Right: ladder positions. M, membranes; S, soluble fraction. GPAT4 band intensities in LD fractions: LacZ (1.00), Trs20# (0.34 ± 0.06), Rab1# (0.28 ± 0.03), Rint1# (0.37 ± 0.04), Syx5# (0.35 ± 0.03) and Bet1# (0.38 ± 0.04) (mean ± s.d., n = 3). One-way ANOVA with Bonferroni correction, #P < 0.0001 compared with LacZ. d, Depletion of specific Rab, membrane-tethering complex components and SNAREs impairs LD targeting of Ldsdh1 but not of LDAH or Lsd1. Scale bars, 5 μm and 1 μm (inlay). e, Quantification of d. Mean ± s.d., n = (left to right; top to bottom) 79, 48, 48, 45, 49, 45; 87, 36, 36, 39, 34, 40; 79, 36, 31, 33, 31, 33 cells examined over three independent experiments. One-way ANOVA with Bonferroni correction, *P = 0.0469, #P < 0.0001, compared with LacZ. f, Localization of transiently expressed eGFP–Rab1, mCherry–Rab18, and Halo–KDEL with respect to LDs. Scale bars, 5 μm and 1 μm (inlay). Right: Pearson’s correlation coefficient of intensities between two channels. Mean ± s.d., n = 23 cells examined over three independent experiments. One-way ANOVA with Bonferroni correction, ***P = 0.0001, #P < 0.0001, compared with LacZ. g, Localization of transiently expressed eGFP–Rab1, mCherry–Rint1 and Halo–KDEL with respect to LDs. Representative images from three independent experiments are shown. Scale bars, 5 μm and 1 μm (inlay). h, Three-dimensional reconstruction of images from g. mCherry–Rint1 puncta co-localizes with LD surface and ER. Blue: LDs; magenta: mCherry–Rint1; yellow: overlap between mCherry–Rint1 and ER (Halo–KDEL); green: overlap between mCherry–Rint1 and LD surface (eGFP–Rab1). See also Extended Data Fig. 6b,c. Scale bar, 1 μm. Source numerical data and unprocessed blots are available in source data. Source data
Fig. 4
Fig. 4. ERES organizers associate with LDs and are required for late ER-to-LD protein targeting.
a, Heat map of robust Z-scores for ER exit site organizers and coiled-coil tethers from the imaging screen. Red: gene knockdowns with robust Z-scores < −2.5. b, Depletion of ERES components abolishes endogenous GPAT4 targeting to LDs. Confocal imaging of eGFP–GPAT4KI cells upon RNAi of ERES components, followed by a 20-h incubation in oleate-containing medium. Scale bars, 5 μm and 1 μm (inlay). c, Quantification of b, including select coiled-coil tethers. Mean ± s.d., n = (left to right) 59; 57, 53, 31, 67 and 37; 36, 37, 35, 35, 37, 39 and 34 cells examined over two or three independent experiments. One-way ANOVA with Bonferroni correction, #P < 0.0001, compared with LacZ. d, Depletion of ERES components reduces GPAT4 amount in LD fractions. Western blot analysis of fractions of wild-type Drosophila S2R+ cells upon RNAi and LD induction. Left: protein target. Right: ladder positions. Sol, soluble fraction. GPAT4 band intensities in LD fractions are indicated (mean, n = 3 experiments). One-way ANOVA with Bonferroni correction, **P < 0.01 (from left to right: 0.0043, 0.0019), compared with LacZ. e, ERES components Sec16 and Tango1 associate spatially with LDs 4 h after LD induction. Immunofluorescence in wild-type cells after 1 mM oleic acid treatment. Scale bars, 5 μm and 1 μm (inlay). Bar graph shows percentages of Sec16 or Tango1 puncta associated with LDs, calculated in three-dimensional space per cell. Mean ± s.d., n = (left to right; top to bottom) 39, 34 and 37; 39, 35 and 37 cells examined over two independent experiments. One-way ANOVA with Bonferroni correction, ***P = 0.0002, #P < 0.0001. fh, Overexpressed Sec16 localizes around LDs and recruits endogenous Tango1 and transiently expressed Sec23 to LDs. f shows percentage of Tango1 or Sec23 area near LDs (defined as within one pixel distance from LDs) upon Sec16 or control overexpression (OE) from the imaging experiment in g and h. Mean ± s.d., n = (left to right; top to bottom) 30, 32; 29, 32 cells examined over three independent experiments. Two-tailed Student’s t-test, #P < 0.0001. g and h show confocal images of Tango1–eGFPKI cells or wild-type cells overexpressing Sec23–eGFP upon transfection of mCherry or mCherry–Sec16 constructs, followed by a 20-h incubation in oleate-containing medium. Scale bars, 5 μm and 1 μm (inlay). Source numerical data and unprocessed blots are available in source data. Source data
Fig. 5
Fig. 5. GPAT4 targeting to LDs occurs via ER–LD membrane connections at Sec23-defined spots upon the rescue of Tango1 depletion.
a, ERES components enrich in LD fractions upon Tango1 depletion. Heat map for abundance of ERES organizers in LD fractions upon LacZ versus Tango1 RNAi, as measured by mass spectrometry and normalized to LacZ control. b, Sec16 strongly localizes around LDs upon Tango1 depletion. Immunofluorescence of Sec16 in wild-type cells upon RNAi of Tango1 or Tango1 plus another ERES component, followed by a 20-h incubation in oleate-containing medium. Representative images from three independent experiments are shown. Scale bars, 5 μm and 1 μm (inlay). c, Schematic diagram of cell–cell fusion assay to rescue Tango1 depletion. d, Representative images for the cell–cell fusion assay, showing soluble marker (mCherry) as fusion control, Halo–GPAT4 and Sec23–eGFP, at a timepoint before fusion (t = 0 min) as well as pre-GPAT4 targeting, post-GPAT4 targeting and enrichment phases. Scale bar, 5 μm. See also Supplementary Videos 2 and 3. e, Quantification of experiments in d 10 min after cell–cell fusion. Left: bar graph showing percentages of LDs that undergo rescue of GPAT4 targeting that are marked (or not marked) by Sec23 puncta. Right: bar graph compares percentages of Sec23-negative and Sec23-positive LDs that undergo GPAT4 targeting rescue. Mean ± s.d., n = 9 cells examined over seven independent experiments. Two-tailed, paired Student’s t-test, ***P = 0.0004. f, Inlay of the imaging experiment in d showing Sec23 spot on LD and the apparent ER–LD membrane connection through which GPAT4 targeting rescue occurs. Scale bar, 1 μm. See also Supplementary Videos 2 and 3. Source numerical data are available in source data. Source data
Fig. 6
Fig. 6. Seipin depletion allows for late targeting proteins to target early from the ER to LDs in the absence of fusion machinery or ERES components.
a, GPAT4 targeting occurs at ER–LD connections independent of seipin. FRAP experiment of transiently expressed Halo–GPAT4 on LDs in endogenous GFP–seipin knock-in (KI) cells, after 6–10 h incubation in oleate-containing medium. Top: inlay images. Bottom: whole cell view. Yellow arrowheads indicate apparent ER–LD connections independent of seipin. Scale bars, 5 μm and 1 μm (inlay). Representative images from five independent experiments are shown. See also Supplementary Videos 4 and 5. b, Late targeting proteins target LDs early in the absence of seipin. Confocal imaging of live seipin knock-out (KO) cells transiently transfected with eGFP-tagged constructs at given timepoints after 1 mM oleic acid treatment. LDs were stained with MDH. Representative images are shown. Percentage of cells with LD targeting are indicated (mean, n = 3 independent experiments, 8–13 cells each). Scale bars, 5 μm and 1 μm (inlay). c, Absence of seipin provides an alternative pathway for late ER-to-LD targeting. Confocal imaging of live wild-type (WT) or seipin KO cells upon RNAi of ERES or fusion-machinery components, followed by transient transfection with eGFP-tagged constructs and a 20-h incubation in oleate-containing medium. Scale bars, 5 μm and 1 μm (inlay). d, Bar graph showing targeting ratios from the imaging experiment in c. Mean ± s.d., n = (left to right) 85, 33, 41, 42, 41, 42, 42 and 40; 84, 29, 35, 46, 48, 44, 49 and 44; 89, 42, 38, 41, 46, 47, 48 and 43 cells examined over three independent experiments. One-way ANOVA with Bonferroni correction, **P < 0.01 (from left to right: 0.0029 and 0.0067), ***P = 0.0005, compared with LacZ. e, Bar graph showing percentages of cells with LD targeting after a 0.5-h incubation in oleate-containing medium. Mean ± s.d., n = 6 experiments for LacZ and 3 for the rest. One-way ANOVA with Bonferroni correction, no significant differences. Representative images are shown in Extended Data Fig. 8a. Source numerical data are available in source data. Source data
Fig. 7
Fig. 7. LD proteomics reveal additional late ER-to-LD targeting protein cargoes.
a, Heat map of abundance of potential ER-to-LD targeting proteins in LD fractions upon depletion of the late protein targeting machinery components or seipin (compared with LacZ control), as measured by mass spectrometry. b, LPCAT, ACSL5 and DHRS7B require ERES or fusion-machinery components for LD targeting. Confocal imaging of live wild-type cells upon RNAi of ERES or fusion-machinery components, followed by transient transfection with eGFP-tagged constructs and a 20-h incubation in oleate-containing medium. LDs were stained with MDH. Scale bars, 5 μm and 1 μm (inlay). c, Bar graph showing LD targeting ratios from the imaging experiment in b. Mean ± s.d., n = (left to right; top to bottom) 48, 46, 51, 51, 48 and 48; 46, 46, 49, 54, 47 and 44; 46, 44, 43, 51, 47 and 42; 39, 43, 46, 37, 32 and 30 cells examined over three independent experiments. One-way ANOVA with Bonferroni correction, #P < 0.0001, compared with LacZ. d, Model of ER-to-LD protein targeting. Early cargoes can access forming LDs from the ER through the LDACs, whereas late cargoes cannot. In a process mediated by the membrane-fusion machinery, including a Rab protein, membrane tethers and SNAREs, at ERES, an ER–LD bridge forms independent of seipin, allowing LD targeting of late cargoes (such as GPAT4 and LPCAT) that are crucial for lipid metabolism and remodelling on LD surfaces. Source numerical data are available in source data. Source data
Extended Data Fig. 1
Extended Data Fig. 1. HSD17B11 targeting to LDs and an imaging screen to identify factors required for GPAT4 targeting to LDs.
a, b, Bar graph showing percentage of cells for a given number of LDs with HSD17B11-EGFP targeting over time after 1 mM oleic acid treatment. Representative images in Fig. 1b. c, Schematic diagram for LD targeting ratio calculation in the imaging screen. Sample images for LacZ RNAi are shown. Machine learning is used to segment individual cells and regions of LDs from the nuclear and LD stains, which are superimposed onto EGFP-GPAT4 channel to calculate LD targeting ratio for each cell. Median value from all segmented cells in eight different fields is reported as the final readout. Scale bars, 10 μm. d, Representative images for screen controls. LacZ RNAi has no effect on GPAT4 targeting to LDs, whereas Arf79F and βCOP RNAi reduce and Seipin RNAi increase GPAT4 targeting to LDs. n = 528 for LacZ RNAi; n = 132 for βCOP, Arf79F, and Seipin RNAi. Scale bar, 10 μm. e, Genome-scale screen is reproducible. Scatter plot showing targeting ratios from two independent genome-scale experiments. Grey: linear regression. f, Protein complexes enriched among hits required for GPAT4 targeting to LDs (robust Z-score < −2.5) using COMPLEAT. Blue to red nodes: lowest to highest robust Z-scores; grey node (non-hits, robust Z-score > −2.5). Solid line: known interaction in Drosophila; dashed line: known interaction in other species. Permutation test as compared to 1000 random complexes of the same size, p-value < 0.01 for all complexes shown. g, Comparison of robust Z-scores between the LD protein targeting screen and the secretion screen. In the secretion screen, the effect of genome-scale dsRNA library on the HRP secretion of Drosophila S2 cells was measured using chemiluminescence. Dotted line at robust Z-score < −2.5 for LD protein targeting screen hits. Red: select genes that are hits in both screens and characterized further in this study; green: other genes that are hits in both screens; blue: secretion screen hits that are not LD targeting screen hits. Source numerical data are available in source data. Source data
Extended Data Fig. 2
Extended Data Fig. 2. Membrane-fusion regulator, tether, and SNAREs are required for GPAT4 targeting to LDs.
a, Depletion of specific Rab, tethering-complex components, and SNAREs abolishes GPAT4 targeting to LDs. Confocal imaging of live EGFP-GPAT4 endogenous knock-in cells upon RNAi of membrane fusion machinery components, 20 h after 1 mM oleic acid treatment (except for 0 h timepoint for LacZ RNAi). LDs were stained with MDH. Representative images are shown. Scale bar, 5 and 1 μm (inlay). Quantification of targeting ratios is shown in Fig. 3b. b, Quantitative PCR to verify RNAi. Mean ± SD, n = 3. Two-tailed Student’s t-test for each gene, *p < 0.05 (from left to right: 0.0497, 0.0241, 0.0369, 0.0258, 0.0104, 0.0180, 0.0125, 0.0140, 0.0122, 0.0264, 0.0294, 0.0271, 0.0250, 0.0462, 0.0259, 0.0430, 0.0172, 0.0104, 0.0369, 0.0142, 0.0420), **p < 0.01 (from left to right: 0.0070, 0.0076, 0.0051), ***p = 0.0001, compared to Control (LacZ) RNAi. Source numerical data are available in source data. Source data
Extended Data Fig. 3
Extended Data Fig. 3. GPAT4 remains in the ER when ERES components, membrane-fusion regulator, tether, and SNAREs are depleted.
a, Depletion of ERES components, Rab, tethering-complex components, and SNAREs results in endogenous GPAT4 co-localizing with ER marker Halo-KDEL without enrichment around LDs. Confocal imaging of live EGFP-GPAT4 endogenous knock-in cells upon RNAi of membrane fusion machinery components, transiently transfected with Halo-KDEL construct, 20 h after 1 mM oleic acid treatment. LDs were stained with MDH. Representative images from 3 independent experiments are shown. Scale bar, 5 and 1 μm (inlay). b, Effect of Sec12, Sar1, Sec23, Rab1, Rint1, Syx5, and Bet1 depletion on LD targeting of GPAT4 is rescued by expressing wildtype proteins. Confocal imaging of live EGFP-GPAT4 endogenous knock-in cells upon RNAi of Sec12, Sar1, Sec23, Rab1, Rint1, Syx5, and Bet1, followed by mCherry (mC) or Halo tagged constructs, 20 hr after 1 mM oleic acid treatment. Scale bar, 5 and 1 μm (inlay). c, Bar graph showing LD targeting ratios from the imaging experiment in b. Mean ± SD, n = (left to right) 30, 29, 27, 26, 26, 26, 42, 54, 29, 25, 31, 24, 32, 31 cells examined over 3 independent experiments. Two-tailed Student’s t-test, #p < 0.0001, compared to respective control transfection. Source numerical data are available in source data. Source data
Extended Data Fig. 4
Extended Data Fig. 4. Depletion of ERES components, membrane-fusion regulator, tether, and SNAREs does not affect GPAT4 diffusion in the ER.
a, Expression of dominant-negative Sar1, Rab1, Syx5, and NSF mutants impairs GPAT4 targeting to LDs. Confocal imaging of live EGFP-GPAT4 endogenous knock-in cells upon transient transfection with Halo tagged constructs. H = Halo tag. Scale bar, 5 and 1 μm (inlay). b, Bar graph showing LD targeting ratios from the imaging experiment in a. Mean ± SD, n = (left to right) 60, 44, 46, 45, 40 cells examined over 3 independent experiments. One-way ANOVA with Bonferroni correction, #p < 0.0001. c, FRAP experiment of stably overexpressed EGFP-GPAT4 in the ER upon RNAi of LacZ, Sar1, Tango1, Rab1, Rint1, or Syx5 prior to or 20 h after 1 mM oleic acid treatment. Photobleaching at t = 8 s. Symbols indicate mean normalized intensities within the bleached region. SD is shown in transparent colors around the mean values. Solid lines above show mean normalized intensities outside the bleached region within the cell. d, Tau values for fluorescence recovery are comparable in all RNAi conditions pre- or post-oleic acid loading. Mean ± SD, n = 18 cells from 3 experiments. One-way ANOVA with Bonferroni correction, *p < 0.05 (from left to right: 0.0124, 0.0155, 0.0153). e, Representative images for the FRAP experiment in c, d. Green squares indicate the photobleached region. Scale bar, 5 and 1 μm (inlay). See also Supplementary Video 1. Source numerical data are available in source data. Source data
Extended Data Fig. 5
Extended Data Fig. 5. Membrane-fusion regulator, tether, and SNAREs are required for late ER-to-LD targeting.
a, Western blot analysis of fractions of wildtype cells upon RNAi and LD induction. GPAT4 amounts remain the same or increase in membrane fractions but decrease in LD fractions upon depletion of membrane-fusion machinery components. Left: protein targets; right: ladder positions. I = Input (whole-cell lysate), S = soluble fraction. GPAT4 band intensities in membrane fractions: LacZ (1.00), Trs20 (2.25 ± 0.58), Rab1* (2.62 ± 1.04), Rint1 (2.11 ± 0.25), Syx5** (3.07 ± 0.40), and Bet1 (2.17 ± 0.28) (mean ± SD, n = 3). One-way ANOVA with Bonferroni correction, *p = 0.0455, **p = 0.0074, compared to LacZ. b, HSD17B11 requires membrane-fusion machinery components for LD targeting. Confocal imaging of live wildtype cells transiently transfected with HSD17B11-EGFP upon RNAi of fusion machinery, followed by a 20-hr incubation in oleate-containing medium. Scale bar, 5 and 1 μm (inlay). c, Bar graph showing percentage of cells with LD targeting (defined as those with >2 LDs with protein targeting) from the imaging experiment in b. Mean ± SD, n = 6 experiments for LacZ RNAi and 3 experiments for the rest (12–17 cells each). One-way ANOVA with Bonferroni correction, #p < 0.0001, compared to LacZ. d, e, Bar graph showing percentage of cells for a given number of LDs with HSD17B11-EGFP targeting upon RNAi of membrane-fusion machinery. Representative images in b. f, Depletion of specific Rab, membrane-tethering complex components, and SNAREs does not impair targeting of Ubxd8 (early ER-to-LD targeting) or CGI-58 and CCT1 (cytosol-to-LD targeting). Confocal imaging of live wildtype cells transiently transfected with EGFP- or mCherry-tagged constructs upon RNAi of fusion machinery, followed by a 20-hr incubation in oleate-containing medium. Scale bar, 5 and 1 μm (inlay). g, Bar graph showing targeting ratios from the imaging experiment in f. Mean ± SD, n = (left to right; top to bottom) 85, 35, 34, 36, 36, 34; 74, 33, 33, 31, 33, 31; 54, 36, 32, 33, 29, 32 cells examined over 3 independent experiments. For mCherry-CCT1, nuclear signal was excluded from the calculation. One-way ANOVA with Bonferroni correction, #p < 0.0001, compared to LacZ. Source numerical data and unprocessed blots are available in source data. Source data
Extended Data Fig. 6
Extended Data Fig. 6. Rab1, Rint1, and specific SNAREs associate with LDs.
a, Specific SNAREs are enriched in the LD fraction of murine fatty liver [data mined from nafld-organellemap.org]. In this study, mice were subjected to 12 weeks of high-fat diet. Their livers were harvested and separated into 22 fractions using a sucrose gradient, and proteomes of the fractions were analyzed with mass spectrometry. First row shows the organellar migration pattern for LDs based on protein correlation profiling. SNAREs are classified according to their classes, and the predicted orthologs of SNAREs required for late ER-to-LD protein targeting (Syx5, membrin, Bet1, and Ykt6) are highlighted in red. b, Additional 3D reconstruction images for Fig. 3g, h. For the inlay images at the bottom, blue indicates LDs, yellow indicates regions of mCherry-Rint1 overlapping with ER marker (Halo-KDEL), green indicates regions of mCherry-Rint1 overlapping with LD surface and ER (EGFP-Rab1), and magenta indicates mCherry-Rint1. Scale bar, 5 and 1 μm (inlay). c, Additional example of 3D reconstruction experiment shown in b. Scale bar, 5 and 1 μm (inlay). d, Cytofluorograms between overexpressed tagged Rab1, Rab18, and KDEL (ER marker) for images shown in Fig. 3f. High R value suggests strong correlation between Rab1 and Rab18 intensities compared to between Rab1 and KDEL or between Rab18 and KDEL. R2 values, as well as the regression line (red), are indicated. e, Overexpressed Rint1 recruits Trs20 to LDs. Localization of transiently co-transfected Trs20-EGFP and mCherry-Rint1 with respect to LDs. Representative images from 3 independent experiments are shown. Scale bar, 5 and 1 μm (inlay). f, Overexpressed Zw10 does not associate with LDs, in contrast to Rint1. Localization of transiently transfected EGFP-Zw10 with cytosolic (mCherry) and ER (Halo-KDEL) markers, with respect to LDs that were stained with MDH. Representative images from 3 independent experiments are shown. Scale bar, 5 and 1 μm (inlay). Source numerical data are available in source data. Source data
Extended Data Fig. 7
Extended Data Fig. 7. ERES increase in number upon LD induction and are required for late ER-to-LD protein targeting.
a, Sec16 and Tango1 are required for LD targeting of Ldsdh1. Confocal imaging of wildtype cells upon RNAi of ERES components, followed by transient transfection with Ldsdh1-EGFP and a 20-hr incubation in oleate-containing medium. Scale bar, 5 and 1 μm (inlay). Mean ± SD, n = (left to right) 79, 41, 52 cells examined over 3 independent experiments. One-way ANOVA with Bonferroni correction, #p < 0.0001, compared to LacZ. b, Sec16 and Tango1 are required for LD targeting of HSD17B11. Scale bar, 5 and 1 μm (inlay). Bar graph shows percentage of cells with LD targeting (defined as those with >2 LDs with protein targeting). Mean ± SD, n = 3 experiments except 6 for LacZ RNAi (14–17 cells each). One-way ANOVA with Bonferroni correction, #p < 0.0001, compared to LacZ. c, d, Bar graph showing percentage of cells for a given number of LDs with HSD17B11-EGFP targeting upon RNAi of ERES components. Representative images in b. e, f, Sec16 and Tango1 are dispensable for LD targeting of (e) LDAH and Ubxd8 and (f) Lsd1, CGI-58, and CCT1. Scale bar, 5 and 1 μm (inlay). For mCherry-CCT1, nuclear signal was excluded from the calculation. Mean ± SD, n = (left to right) LDAH 87, 36, 36; Ubxd8 85, 44, 43; Lsd1 79, 39, 41; CGI-58 74, 36, 38; CCT1 54, 26, 31 cells examined over 3 independent experiments. One-way ANOVA with Bonferroni correction, *p < 0.05 (from top to bottom: 0.0159, 0.0193), compared to LacZ. g, LD induction transiently increases the number of Sec16 and Tango1 puncta. Representative images in Fig. 4e. Mean ± SD, n = (left to right) 38, 39, 33, 37; 38, 39, 35, 37 cells examined over 2 independent experiments. One-way ANOVA with Bonferroni correction, ***p < 0.001 (from left to right: 0.0001, 0.0008), #p < 0.0001. h, Localization of Sec16 around LDs and its recruitment of endogenous Tango1 require Sec12 and Sar1 but not Sec23. Representative images from 3 independent experiments are shown. Scale bar, 5 and 1 μm (inlay). i, Overexpressed Sar1-H74G and Sec23 accumulate around LDs upon Tango1 depletion. Representative images from 5 independent experiments are shown. Scale bar, 5 and 1 μm (inlay). Source numerical data are available in source data. Source data
Extended Data Fig. 8
Extended Data Fig. 8. Late ER-to-LD protein targeting occurs independent of seipin, and LD proteomics reveal additional late targeting proteins.
a, Seipin depletion allows for early targeting of late cargoes even in the absence of late ER-to-LD protein targeting machinery. Confocal imaging of live Seipin knock-out cells upon RNAi of ERES or fusion machinery components, followed by transient transfection with EGFP tagged constructs and a 0.5-hr incubation in oleate-containing medium. Scale bar, 5 and 1 μm (inlay). Quantification is shown in Fig. 6e. b, Depletion of late ER-to-LD targeting machinery does not affect association of seipin puncta with LDs. Confocal imaging of live GFP-seipin endogenous knock-in cells upon RNAi of ERES or fusion machinery components, followed by a 20-hr incubation in oleate-containing medium. Representative images from 3 independent experiments are shown. Scale bar, 5 and 1 μm (inlay). c, Heatmap of abundance of ERES and fusion-machinery components and seipin in LD fractions upon their depletion by RNAi (or gene deletion for Seipin) compared to LacZ control, as measured by mass spectrometry. d, ReepA targets LDs early, whereas LPCAT, ACSL5, and DHRS7B target LDs late upon LD induction. Confocal imaging of live wildtype cells transiently transfected with EGFP-tagged constructs at given timepoints after 1 mM oleic acid treatment. LDs were stained with MDH. Representative images are shown. Scale bar, 5 and 1 μm (inlay). e, Bar graph showing percentage of cells with LD targeting over time from the imaging experiment in d. Mean ± SD, n = 3 experiments (10–20 cells each). One-way ANOVA with Bonferroni correction, **p = 0.0043, ***p = 0.0009, #p < 0.0001. Source numerical data are available in source data. Source data

References

    1. Thiam AR, Farese RV, Walther TC. The biophysics and cell biology of lipid droplets. Nat. Rev. Mol. Cell Biol. 2013;14:775–786. doi: 10.1038/nrm3699. - DOI - PMC - PubMed
    1. Olzmann JA, Carvalho P. Dynamics and functions of lipid droplets. Nat. Rev. Mol. Cell Biol. 2019;20:137–155. doi: 10.1038/s41580-018-0085-z. - DOI - PMC - PubMed
    1. Walther TC, Farese RV. Lipid droplets and cellular lipid metabolism. Annu. Rev. Biochem. 2012;81:687–714. doi: 10.1146/annurev-biochem-061009-102430. - DOI - PMC - PubMed
    1. Welte MA. Expanding roles for lipid droplets. Curr. Biol. 2015;25:R470–R481. doi: 10.1016/j.cub.2015.04.004. - DOI - PMC - PubMed
    1. Romeo S, et al. Genetic variation in PNPLA3 confers susceptibility to nonalcoholic fatty liver disease. Nat. Genet. 2008;40:1461–1465. doi: 10.1038/ng.257. - DOI - PMC - PubMed

Publication types

LinkOut - more resources