. 2022 Oct;19(10):1153-1167.
doi: 10.1038/s41423-022-00911-z. Epub 2022 Sep 1.

Sphingosine kinase 1 promotes tumor immune evasion by regulating the MTA3-PD-L1 axis

Affiliations

Sphingosine kinase 1 promotes tumor immune evasion by regulating the MTA3-PD-L1 axis

Poyee Lau et al. Cell Mol Immunol. 2022 Oct.

Abstract

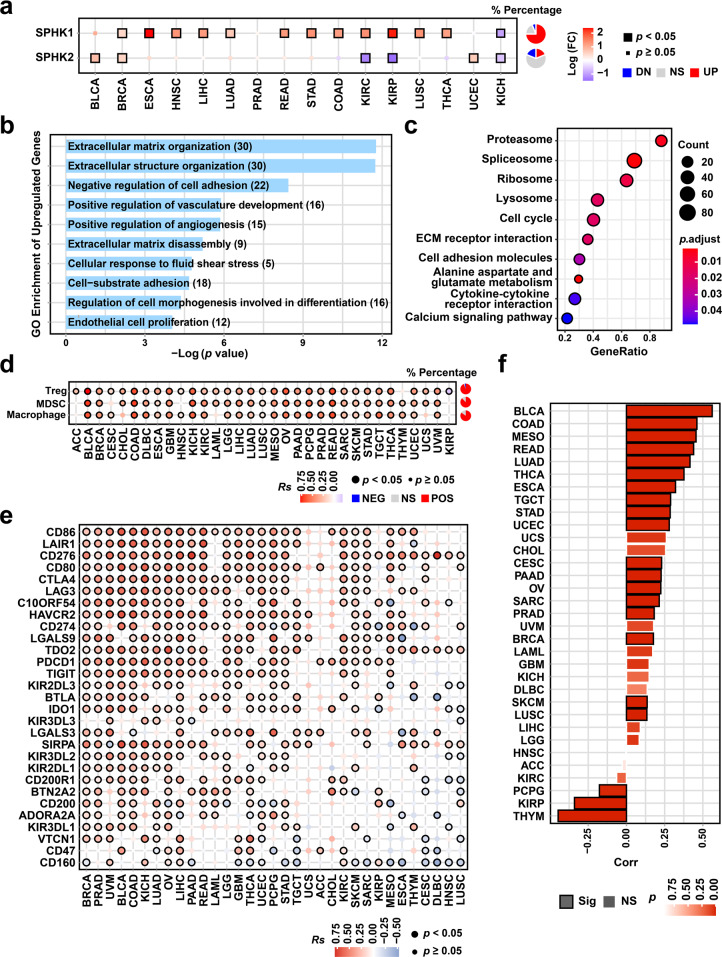
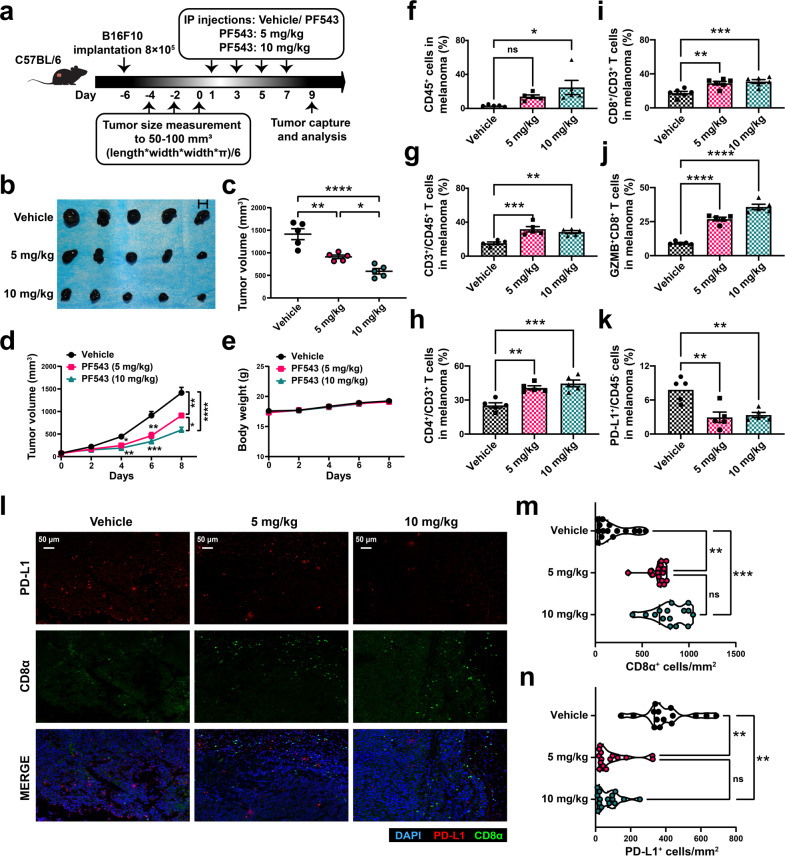
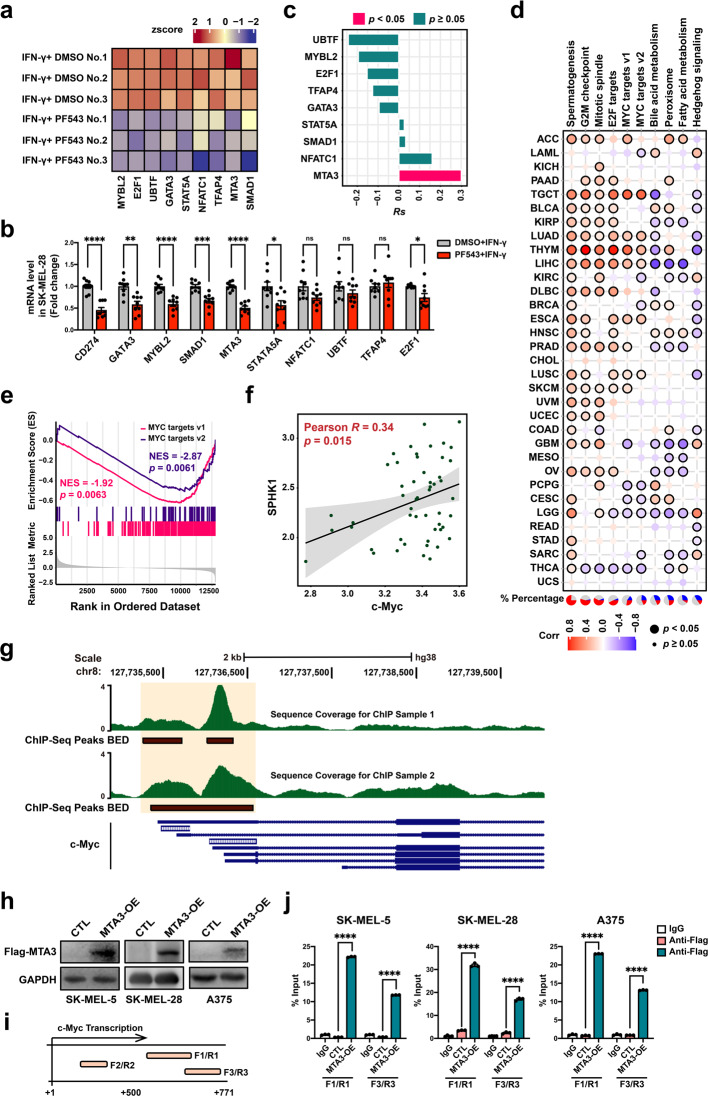
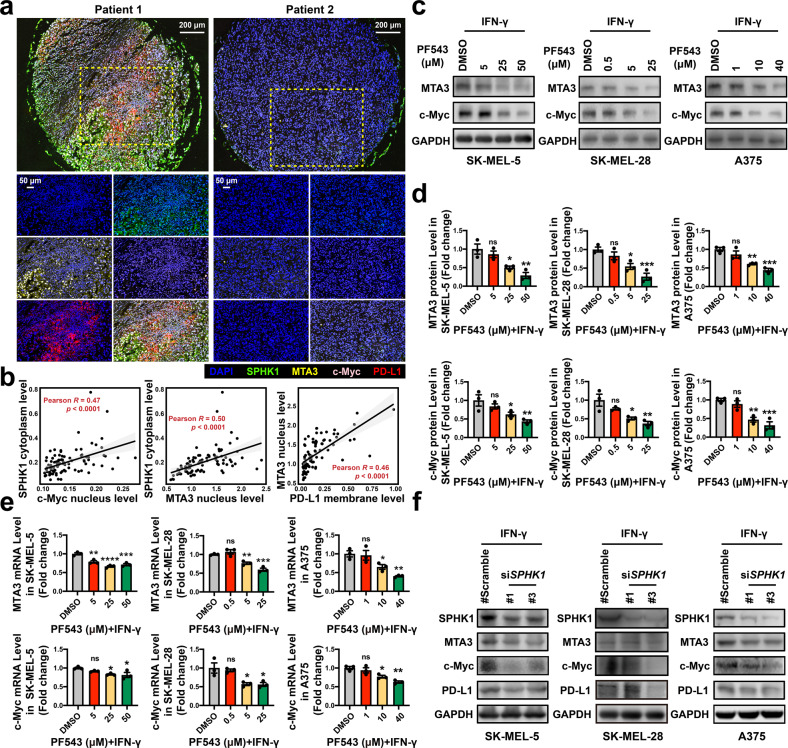
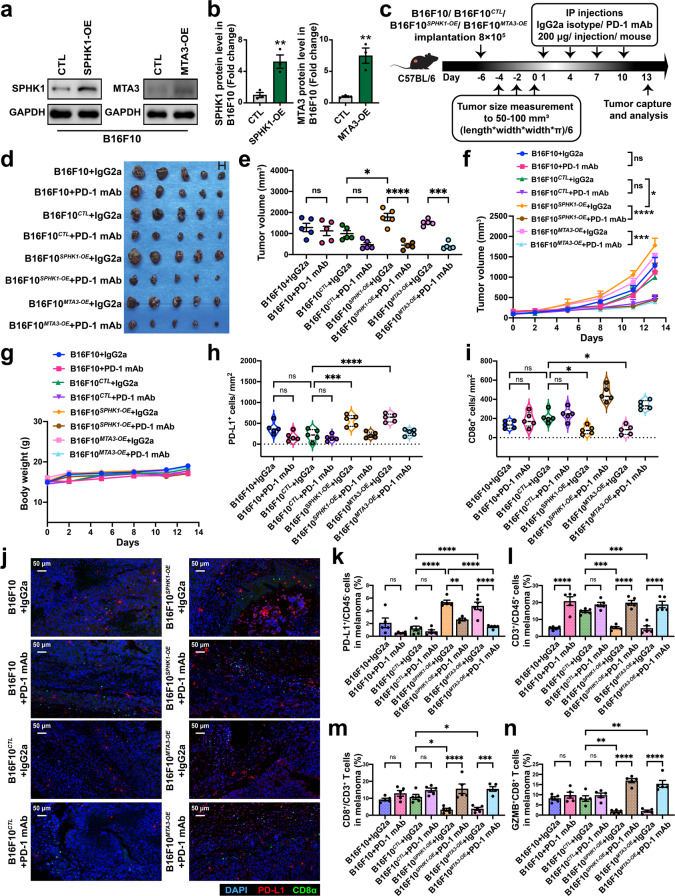
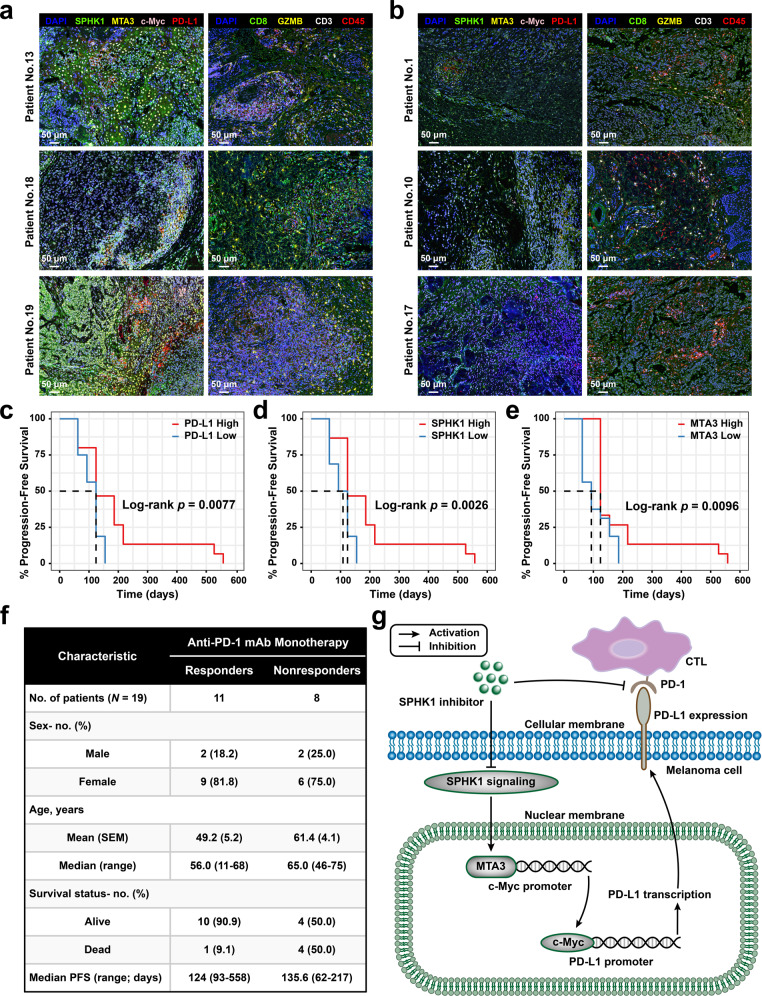
Immune checkpoint blockade (ICB) exhibits considerable benefits in malignancies, but its overall response rate is limited. Previous studies have shown that sphingosine kinases (SPHKs) are critical in the tumor microenvironment (TME), but their role in immunotherapy is unclear. We performed integrative analyses including bioinformatics analysis, functional study, and clinical validation to investigate the role of SPHK1 in tumor immunity. Functionally, we demonstrated that the inhibition of SPHK1 significantly suppressed tumor growth by promoting antitumor immunity in immunocompetent melanoma mouse models and tumor T-cell cocultures. A mechanistic analysis revealed that MTA3 functions as the downstream target of SPHK1 in transcriptionally regulating tumor PD-L1. Preclinically, we found that anti-PD-1 monoclonal antibody (mAb) treatment significantly rescued tumor SPHK1 overexpression or tumor MTA3 overexpression-mediated immune evasion. Significantly, we identified SPHK1 and MTA3 as biological markers for predicting the efficacy of anti-PD-1 mAb therapy in melanoma patients. Our findings revealed a novel role for SPHK1 in tumor evasion mediated by regulating the MTA3-PD-L1 axis, identified SPHK1 and MTA3 as predictors for assessing the efficacy of PD-1 mAb treatment, and provided a therapeutic possibility for the treatment of melanoma patients.

Keywords: Immune checkpoint blockade; Melanoma; Programmed cell death ligand 1; Programmed cell death protein 1; Sphingosine kinase; Tumor microenvironment.


Conflict of interest statement

The authors declare no competing interests.

Figures

Fig. 1
Fig. 1
Asscociations between SPHK1 and tumor-infiltrating lymphocytes and inhibitory biomarkers. a Differential expression of SPHK1 and SPHK2 across 16 cancer types compared with normal samples (identified by limma, |Log2(fold change)| >0.58, BH-adjusted p < 0.05). Pie charts in the right panel represent the percentage of cancer types with significant upregulation (red; UP), downregulation (blue; DN), and non-significant alteration (gray; NS). GO (b) and KEGG (c) functional analysis of differential expressed genes between papillary thyroid cancer cells with SHPK1 overexpression and control (GSE87307). GO enrichment was performed with upregulated genes by hypergeometric test, and KEGG enrichment was performed by the GSEA method. d Correlation between SPHK1 and the relative abundance of suppressive immune cell types including regulatory T cells (Tregs), myeloid-derived suppressor cells (MDSCs), and tumor-associated macrophages (TAMs). Pie charts in the right panel represent the percentage of cancer types with significantly positive (red; POS), negative (blue; NEG), and non-significant correlation (gray; NS). e Correlation between SPHK1 and inhibitory checkpoint gene expression in 33 cancer types. f Correlation between SPHK1 and CD274 across 33 cancer types from the TCGA database
Fig. 2
Fig. 2
Inhibition of SPHK1 suppresses tumor growth by promotion of anti-tumor immunity in melanoma immunocompetent mouse models. a Schematics of the treatment plan using a C57BL/6 female mouse model, established by subcutaneously injecting B16F10. Mice were then either treated with high-dose PF543 (10 mg/kg), low-dose PF543 (5 mg/kg), or solvent (vehicle). b Image of B16F10 tumors, as captured on the ninth day. c Summary tumor volume data harvested on the ninth day. Plots of mice tumor volumes (d) and body weight (e) measured every other day. See also Supplementary Tables 1-2. Flow cytometric analyses of CD45+ cells (f), CD3+ in CD45+ cells (g), CD4+ or CD8+ in CD3+ cells (h, i), GZMB+CD8+ TILs (j), and PD-L1 on CD45- subsets (k) from B16F10 tumor samples. See also Supplementary Fig. 2a–e. l Representative images of trichrome immunohistochemical staining of DAPI, CD8α, and PD-L1 of B16F10 tumor-bearing mice treated with vehicle, PF543 (5 mg/kg or 10 mg/kg). Scale bars, 50 μm. Violin plots indicating densities of CD8α+ (m) and PD-L1+ (n) cells/mm2 in IHC sections of B16F10 allografts. 5 mice per cohort. Data represent mean ± SEM. ns non-significant, p > 0.05, *p < 0.05, **p < 0.01, and ***p < 0.001, as determined by one-way ANOVA and Tukey’s multiple comparisons test (c, fk, m, n)
Fig. 3
Fig. 3
SPHK1 transcriptionally regulates MTA3 and c-Myc in melanoma cells. a Heat map of RNA-seq expression z-scores computed the candidate genes in SK-MEL-28 melanoma cells treated with PF543 (25 μM) and IFN-γ (200 ng/mL) for 24 h. See also Supplementary Table 5. b RT-PCR of CD274 and candidate transcription factors mRNA level was performed from the same sample as RNA-seq (n = 9). Data represent mean ± SEM. ns non-significant, p > 0.05, *p < 0.05, **p < 0.01, ***p < 0.001, and ****p < 0.0001. P values were calculated using unpaired two-sided Student’s t-test. c SPHK1 was positively correlated with MTA3 by using the calculation of Pearson’s correlation coefficient and subsequent significance test in 52 melanoma cell lines from the GDSC database. d Spearman’s correlation between MTA3 expression and MSigDB hallmark pathways across 33 cancer types. Pie charts in the left panel represent the percentage of cancer types with positive (red, Rs > 0.2, p < 0.05), negative (blue, Rs < −0.2, p < 0.05), and non-significant correlation (gray). e Enrichment plot of MYC target gene sets based on RNA sequencing. f Scatterplot for linear-regression of the association between c-Myc and SPHK1, as determined by Pearson’s correlation coefficient and significance test. The solid line corresponds to the regression estimate, and the corresponding 95% CIs, indicated by grey shading. g Overlaid images of MTA3 ChIP-seq enrichment from K562 cell line for two replicates. ChIP-seq tracks are obtained from published data. h SK-MEL-28 melanoma cells were transfected with MTA3 or negative control (CTL) vector. MTA3 expression was analyzed by western blot. i, j Locations of ChIP-qPCR primers at the c-Myc promoter, transcription start site is designated as nucleotide +1. F/R, Forward/Reverse (i). Input % of c-Myc DNA by IgG or Flag antibody were determined by ChIP-qPCR in melanoma cell lines (n = 3). j Data represent mean ± SEM. ns non-significant, p > 0.05, *p < 0.05, **p < 0.01, ***p < 0.001, and ****p < 0.0001. P values were calculated using unpaired two-sided Student’s t-test
Fig. 4
Fig. 4
SPHK1 and MTA3 are positively correlated with PD-L1 expression in melanoma patient samples. a Representative images of tetrachromatic immunohistochemical staining of DAPI, SPHK1, PD-L1, and MTA3 expression in a metastatic melanoma tissue array. Scale bars, 200/50 μm in insets. b Quantification and correlation analysis of SPHK1, PD-L1, and MTA3 based on Log2-transformed fluorescent intensities of multiplex IHC staining. See also Supplementary Table 6. MTA3 or c-Myc expression was analyzed by western blot including images (c) and quantification (d), or RT-PCR (e; n = 3) in melanoma cell lines treated with PF543 or DMSO. The plot (d) was generated from three independent experiments and showed as mean ± SEM. f Melanoma cells transfected with siSPHK1 or scrambled negative control siRNA were visualized by western blot. See also Supplementary Fig. 7. Data represent mean ± SEM. ns non-significant, p > 0.05, *p < 0.05, **p < 0.01, ***p < 0.001, and ****p < 0.0001, as determined by Dunnett’s multiple comparisons test (d, e)
Fig. 5
Fig. 5
SPHK1-MTA3-PD-L1 axis-induced immune surveillance escape could be rescued by PD-1 mAb treatments in melanoma for B16F10 allograft immunocompetent mouse models. B16F10 melanoma cells were transfected with SPHK1, MTA3, or negative control (CTL) vector. SPHK1 and MTA3 expression was analyzed by western blot (a) and quantification (b). The plot (b) was generated from three independent experiments and showed as mean ± SEM. c Schematics of the treatment plan using a C57BL/6 female mouse model, established by subcutaneously injecting B16F10 overexpressing SPHK1, MTA3, or CTL. Mice were then either treated with PD-1 mAb (200 μg/ mouse), or IgG2a isotype control. d Image of B16F10 tumors, as captured on the thirteenth day. e Summary tumor volume data harvested on the thirteenth day. Plots of tumor volumes (f) and mice body weight (g) measured every two days. See also Supplementary Tables 7, 8. h, i Trichrome immunohistochemical staining of DAPI, CD8α, and PD-L1 expression of SPHK1-OE, MTA3-OE, or CTL B16F10 allografts. Violin plots indicating densities of PD-L1+ (h) and CD8α+ (i) cells/mm2 in IHC sections of B16F10 allografts. j Representative images, scale bars, 50 μm. Flow cytometric analyses were performed to measure PD-L1 on CD45- subsets (k), CD3+ in CD45+ cells (l), CD8+ in CD3+ cells (m), and GZMB+CD8+ TILs (n) from B16F10 tumors. See also Supplementary Fig. 10. 5 mice per cohort. Data represent mean ± SEM. ns, non-significant, p > 0.05, *p < 0.05, **p < 0.01, ***p < 0.001, and ****p < 0.0001, as determined by unpaired two-sided Student’s t-test (b), one-way ANOVA and Tukey’s multiple comparisons test (e, h, i, kn)
Fig. 6
Fig. 6
The expression of SPHK1 and MTA3 is related to the prognosis of anti-PD-1 therapy in melanoma patients. a, b Six melanoma patients including responders (No.13, No.18, No.19) and nonresponders (No.1, No.10, No.17) were visualized by multiplex IHC staining of DAPI, SPHK1, MTA3, c-Myc, PD-L1, CD8, GZMB, CD3, and CD45. Scale bars, 50 μm. ce Kaplan–Meier survival curves of melanoma patients’ progression-free survival. Patients were stratified into two groups by median gene expression. Significance was determined by the Log-rank test. f Clinicopathologic characteristics of anti-PD-1 mAb monotherapy cohorts. SEM, standard error of mean, PFS, progression-free survival. All patients were treated with PD-1 monoclonal antibody after surgical resection of primary lesions, and those with recurrence or metastasis ≤6 months were considered as nonresponders (NR), while those without recurrence or metastasis longer than 6 months were considered as responders (R). See also Supplementary Table 9. g Schematic model showing the mechanism and role of SPHK1 in melanoma cells

Similar articles

Cited by

References

    1. Schadendorf D, van Akkooi ACJ, Berking C, Griewank KG, Gutzmer R, Hauschild A, et al. Melanoma. Lancet. 2018;392:971–84. doi: 10.1016/S0140-6736(18)31559-9. - DOI - PubMed
    1. Garbe C. Systematic review of medical treatment in melanoma: current status and future prospects. Oncologist. 2011;16:5–24. doi: 10.1634/theoncologist.2010-0190. - DOI - PMC - PubMed
    1. American Cancer Society. Cancer facts & figures 2020. https://www.cancer.org/research/cancer-facts-statistics.html 2020.
    1. Bruni JG. Approaches to treat immune hot, altered and cold tumours with combination immunotherapies. Nat Rev Drug Disco. 2019;18:197–218. doi: 10.1038/s41573-018-0007-y. - DOI - PubMed
    1. Chen DS, Mellman I. Elements of cancer immunity and the cancer-immune set point. Nature. 2017;541:321–30. doi: 10.1038/nature21349. - DOI - PubMed

Publication types