. 2022 Sep;19(9):1076-1087.
doi: 10.1038/s41592-022-01575-3. Epub 2022 Sep 1.

Cell type-specific inference of differential expression in spatial transcriptomics

Affiliations

Cell type-specific inference of differential expression in spatial transcriptomics

Dylan M Cable et al. Nat Methods. 2022 Sep.

Abstract

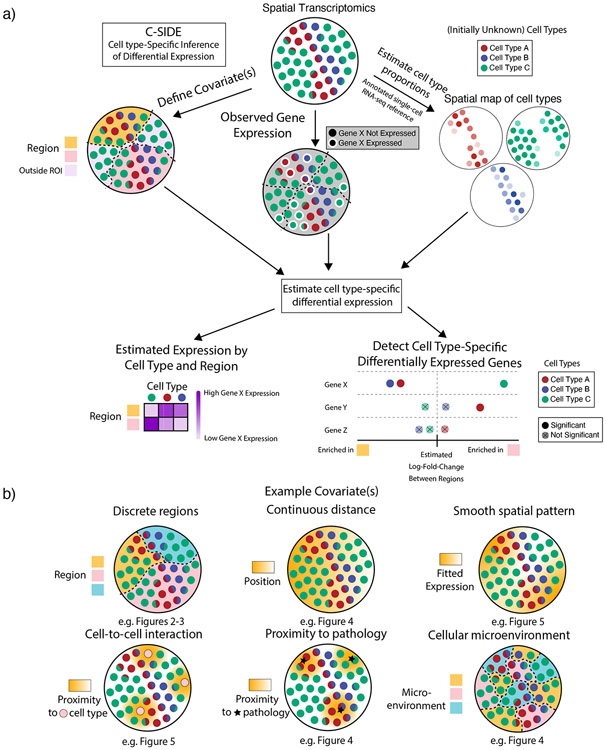
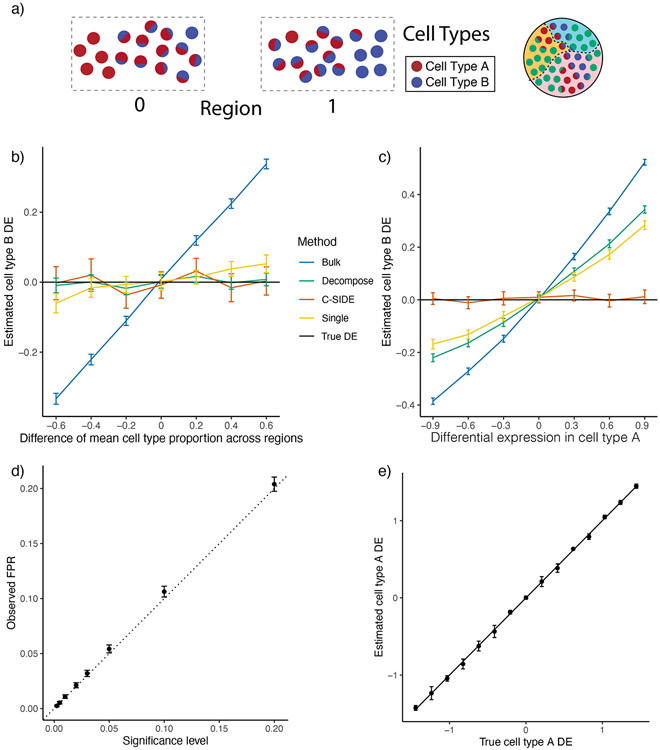
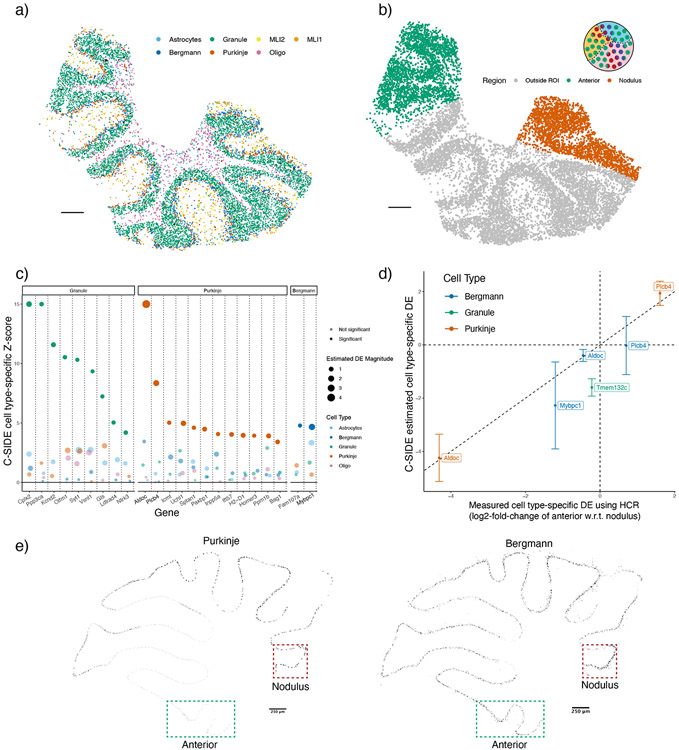
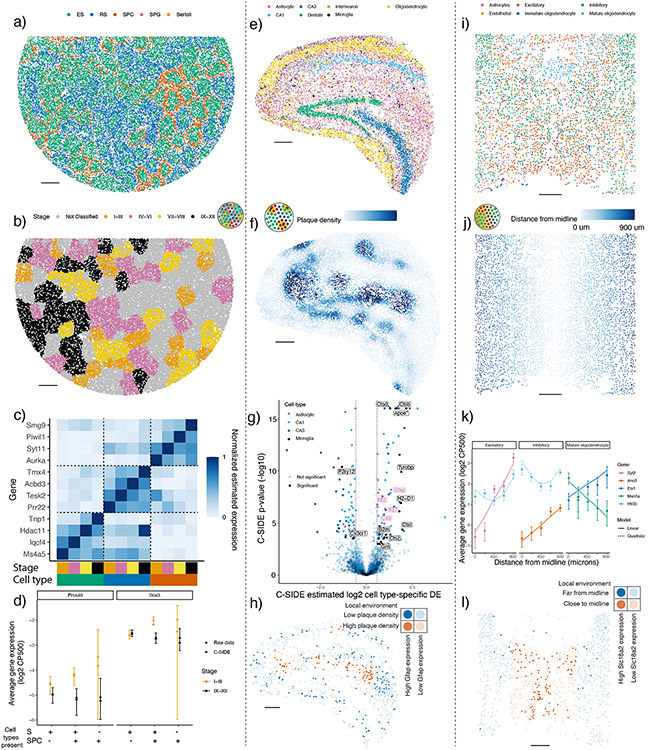
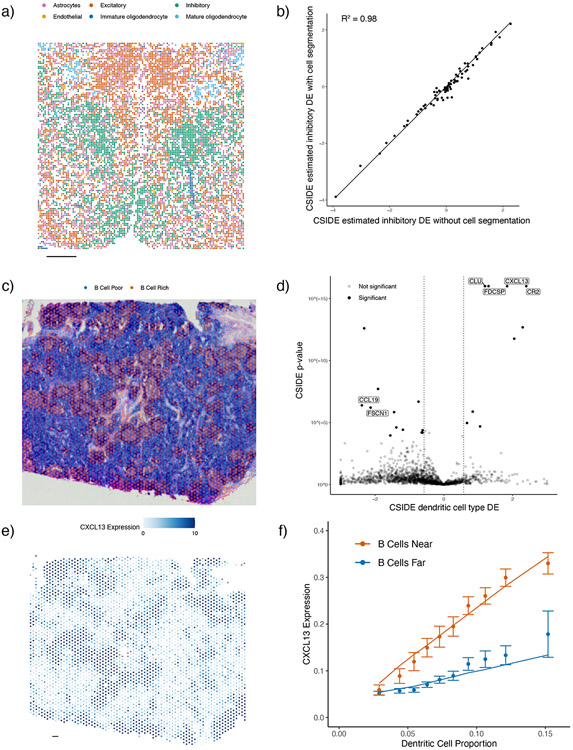
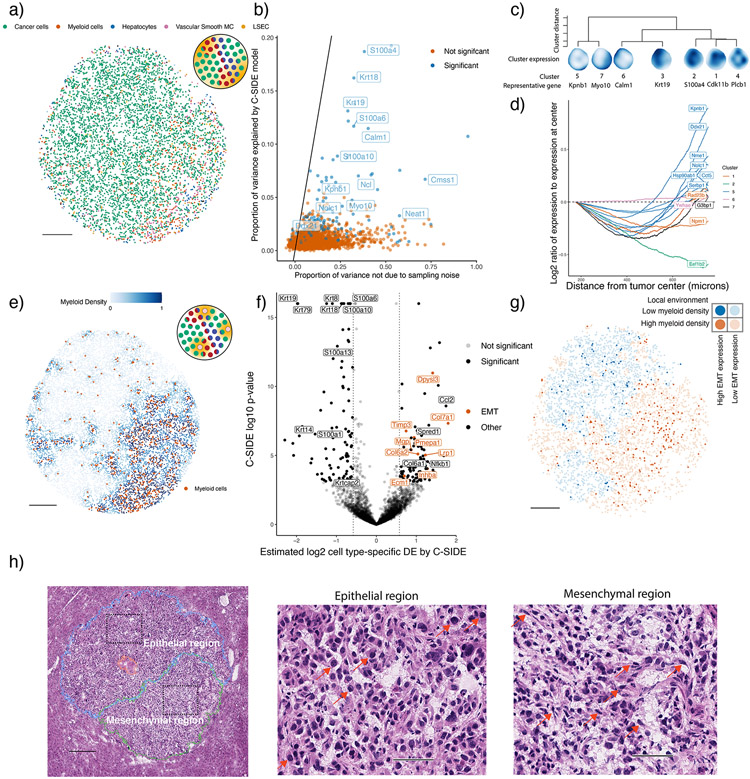
A central problem in spatial transcriptomics is detecting differentially expressed (DE) genes within cell types across tissue context. Challenges to learning DE include changing cell type composition across space and measurement pixels detecting transcripts from multiple cell types. Here, we introduce a statistical method, cell type-specific inference of differential expression (C-SIDE), that identifies cell type-specific DE in spatial transcriptomics, accounting for localization of other cell types. We model gene expression as an additive mixture across cell types of log-linear cell type-specific expression functions. C-SIDE's framework applies to many contexts: DE due to pathology, anatomical regions, cell-to-cell interactions and cellular microenvironment. Furthermore, C-SIDE enables statistical inference across multiple/replicates. Simulations and validation experiments on Slide-seq, MERFISH and Visium datasets demonstrate that C-SIDE accurately identifies DE with valid uncertainty quantification. Last, we apply C-SIDE to identify plaque-dependent immune activity in Alzheimer's disease and cellular interactions between tumor and immune cells. We distribute C-SIDE within the R package https://github.com/dmcable/spacexr .


Figures

Figure 1:
Figure 1:
Cell type-Specific Inference of Differential Expression learns cell type-specific differential expression from spatial transcriptomics data. (a) Schematic of the C-SIDE Method. Top: C-SIDE inputs: a spatial transcriptomics dataset with observed gene expression (potentially containing cell type mixtures) and a covariate for differential expression. Middle: C-SIDE first assigns cell types to the spatial transcriptomics dataset, and covariates are defined. Bottom: C-SIDE estimates cell type-specific gene expression along the covariate axes. (b) Example covariates for explaining differential expression with C-SIDE. Top: Segmentation into multiple regions, continuous distance from some feature, or general smooth patterns (nonparametric). Bottom: density of interaction with another cell type or pathological feature or a discrete covariate representing the cellular microenvironment.
Figure 2:
Figure 2:
C-SIDE provides unbiased estimates of cell type-specific differential expression in simulated data. All: C-SIDE was tested on a dataset of simulated mixtures of single cells from a single-nucleus RNA-seq cerebellum dataset. Differential expression (DE) axes represent DE in log2-space of region 1 w.r.t. region 0. (a) Pixels are grouped into two regions, and genes are simulated with ground truth DE across regions. Each region contains pixels containing mixtures of various proportions between cell type A and cell type B. The difference in average cell type proportion across regions is varied across simulation conditions. (b) Mean estimated cell type B Astn2 DE (differential expression) across two regions as a function of the difference in mean cell type proportion across regions. Astn2 is simulated with ground truth 0 spatial DE, and an average of (n = 100) estimates is shown, along with standard errors. Black line represents ground truth 0 DE (cell type B). Four methods are shown: Bulk, Decompose, Single, and C-SIDE (Methods). (c) Same as (b) for Nrxn3 cell type B differential gene expression as a function of DE in cell type A, where Nrxn3 is simulated to have DE within cell type A but no DE in cell type B. (d) For each significance level, C-SIDE’s false positive rate (FPR), along with ground truth identity line (s.e. shown, n = 1500, 15 genes, 100 replicates per gene). (e) C-SIDE mean estimated cell type A differential expression vs. true cell type A differential expression (average over n = 500 replicates, s.e. shown). Ground truth identity line is shown, and one gene is used for the simulation per DE condition (out of 15 total genes).
Figure 3:
Figure 3:
C-SIDE’s estimated cell type-specific differential expression is validated by HCR-FISH. C-SIDE ran on (n = 3) replicates of cerebellum Slide-seq data. (a) C-SIDE’s spatial map of cell type assignments. Out of 19 cell types, the seven most common appear in the legend. Reproduced from [18]. Three total replicates were used to fit C-SIDE. (b) Covariate used for C-SIDE, representing the anterior lobule region (green) and nodulus (red). Schematic refers to the C-SIDE problem type outlined in Figure 1b. (c) C-SIDE Z-score for testing for DE for each gene and for each cell type. Genes are grouped by cell type with maximum estimated DE, and estimated DE magnitude appears as size of the points. Bold genes appear below in HCR validation. (d) Scatterplot of C-SIDE DE estimates vs. HCR measurements for cell type-specific log2 differential expression. Positive values indicate gene expression enrichment in the anterior region. Error bars represent C-SIDE confidence intervals for predicted DE on a new biological replicate. A dotted identity line is shown, and cell types are colored. (e) HCR images of Aldoc continuous gene expression. Only pixels with high cell type marker measurements for Purkinje (left) and Bergmann (right) are shown. Regions of interest (ROIs) of nodulus and anterior regions are outlined in green and red, respectively. All scale bars 250 microns.
Figure 4:
Figure 4:
C-SIDE discovers cell type-specific DE in a diverse set of problems on testes, Alzheimer’s hippocampus, and hypothalamus datasets. All panels: results of C-SIDE on the Slide-seqV2 testes (left column), MERFISH hypothalamus (middle column), and Slide-seqV2 Alzheimer’s hippocampus (right column). Schematics in b,f,j reference C-SIDE problem types (Figure 1b). (a) C-SIDE’s spatial map of cell type assignments in testes. All cell types are shown with most common in legend. (b) Covariate used for C-SIDE in testes: four discrete tubule stages. (c) Cell type and tubule stage-specific genes identified by C-SIDE. C-SIDE estimated expression is standardized between 0 and 1 for each gene. Columns represent C-SIDE estimates for each cell type and tubule stage. (d) Log2 average expression (in counts per 500 (CP500)) of pixels grouped based on tubule stage and presence or absence of spermatid (S) cell types (defined as elongating spermatid (ES) or round spermatid (RS)) and/or spermatocyte (SPC) cell type. Circles represent raw data averages while triangles represent C-SIDE predictions, and error bars around circular points represent ± 1.96 s.d. (37 ≤ n ≤ 2236 pixels per group, Supplementary Notes). Genes Prss40 and Snx3 are shown on left and right, respectively. (e) Same as (a) for Alzheimer’s hippocampus (n = 4 replicates). (f) Covariate used for C-SIDE in Alzheimer’s hippocampus: continuous density of Aβ plaque. (g) Volcano plot of C-SIDE DE results in log2-space, with positive values corresponding to plaque-upregulated genes. Color represents cell type, and a subset of significant genes are labeled. Dotted lines represents 1.5x fold-change cutoff used for C-SIDE. (h) Spatial visualization of Gfap, identified by C-SIDE as DE in astrocytes. Red/blue represents high/low plaque density areas, respectively. Bold points represent astrocytes expressing Gfap at least 1 CP500. (i) Same as (a) for hypothalamus. (j) Covariate used for C-SIDE in hypothalamus: midline distance. (k) Log2 average expression (CP500) of C-SIDE significant DE genes for excitatory, inhibitory, and mature oligodendrocyte cell types. Single cell type pixels are binned by midline distance, and points represent raw data averages while lines represents C-SIDE predictions and error bars around points represent ± 1.96 s.d. (34 ≤ n ≤ 411 pixels per group). (Supplementary Notes). (l) Spatial visualization of Slc18a2, identified by C-SIDE as DE in inhibitory neurons. Red/blue represents close/far to midline, respectively. Bold points are inhibitory neurons expressing Slc18a2 at least 10 CP500. All scale bars 250 microns.
Figure 5:
Figure 5:
C-SIDE enables differential expression discovery on diverse spatial transcriptomics technologies including Visium and MERFISH. All panels: results of C-SIDE on the Visium lymph node (middle and bottom rows) and MERFISH hypothalamus (top row). (a) C-SIDE’s spatial map of cell type assignments in the hypothalamus, where pixels were defined deterministically as squares without segmentation. All cell types are shown, and the most common cell types appear in the legend. (b) Scatter plot of C-SIDE estimated inhibitory cell type differential expression with an without cell segmentation. (c) Covariate used for C-SIDE: discrete region of B cell-rich areas in the lymph node. Overlayed with Visium histology image. (d) Volcano plot of C-SIDE dendritic cell differential expression results in log2-space, with positive values corresponding to upregulated genes in the B cell regions. A subset of significant genes are labeled (two-sided Z-test with FDR control, Methods). Dotted lines represents 1.5x fold-change cutoff used for C-SIDE. (e) Spatial plot of total expression of the CXCL13 gene, which was determined by C-SIDE to be differentially expressed in dendritic cells (DCs). Color represents counts per spot. (f) Average expression (in counts per 500 (CP500)) of CXCL13 as a function of dendritic cell proportion and germinal center localization. Points represent raw data averages while lines represents C-SIDE predictions and error bars around points represent ± 1.96 s.d. (75 ≤ n ≤ 326 points per group). All scale bars 250 microns.
Figure 6:
Figure 6:
C-SIDE enables the discovery of differentially expressed pathways in a KrasG12D/+ Trp53−/− (KP) mouse model. All panels: C-SIDE ran on multiple cell types; plots show C-SIDE results on the tumor cell type. Nonparametric/parametric C-SIDE results are shown in b–d and e–h, respectively. (a) C-SIDE’s spatial map of cell type assignments. Out of 14 cell types, the five most common appear in the legend. (b) Scatter plot of C-SIDE R2 and overdispersion (defined as proportion of variance not due to sampling noise) for nonparametric C-SIDE results on the tumor cell type. Identity line is shown, representing the maximum possible variance explained. (c) Dendrogram of hierarchical clustering of (n = 162 significant genes) C-SIDE’s fitted smooth spatial patterns at the resolution of 7 clusters. Each spatial plot represents the average fitted gene expression patterns over the genes in each cluster. (d) Moving average plot of C-SIDE fitted gene expression (normalized to expression at center) as a function of distance from the center of the tumor for 12 genes in the Myc targets pathway identified to be significantly spatially DE by C-SIDE. (e) Covariate used for parametric C-SIDE: continuous density of myeloid cell types in the tumor. Schematic refers to C-SIDE problem type (Figure 1b). (f) Volcano plot of C-SIDE log2 DE results (n = 4201 pixels) on the tumor cell type with positive values representing upregulation near myeloid immune cells. A subset of significant genes are labeled, and dotted lines represent 1.5x fold-change cutoff. (g) Spatial plot of total expression in tumor cells of the 9 DE epithelial-mesenchymal transition (EMT) genes identified by C-SIDE in (f). Red/blue represents myeloid-dense and myeloid-poor areas, respectively. Bold points represent tumor cells expressing these EMT genes at least 2.5 counts per 500. (h) Hematoxylin and eosin (H&E) image of adjacent section of the tumor (n = 1 section). Left: mesenchymal (green), necrosis (red), and epithelial (blue) annotated tumor regions, with dotted boxes representing epithelial and mesenchymal areas of focus for the other two panels. Middle/right: enlarged images of epithelial (middle) or mesenchymal (right) regions. Red arrows point to example tumor cells with epithelial (middle) or mesenchymal (right) morphology. 50 micron scale bars (h) middle/right. All other scale bars 250 microns.

Similar articles

Cited by

References

    1. Rodriques SG et al. Slide-seq: A scalable technology for measuring genome-wide expression at high spatial resolution. Science 363, 1463–1467 (2019). - PMC - PubMed
    1. Stickels RR et al. Highly sensitive spatial transcriptomics at near-cellular resolution with Slide-seqV2. Nature biotechnology 39, 313–319 (2021). - PMC - PubMed
    1. Chen KH, Boettiger AN, Moffitt JR, Wang S & Zhuang X Spatially resolved, highly multiplexed RNA profiling in single cells. Science 348 ( 2015). - PMC - PubMed
    1. Wang X. et al. Three-dimensional intact-tissue sequencing of single-cell transcriptional states. Science 361 (2018). - PMC - PubMed
    1. 10x Genomics. 10x genomics: Visium spatial gene expression. https://www.10xgenomics.com/solutions/spatial-gene-expression/ (2020).

Methods References

    1. Yuan YX A review of trust region algorithms for optimization. In Iciam, vol. 99, 271–282 (2000).
    1. Van der Vaart AW Asymptotic statistics, vol. 3 (Cambridge university press, 2000).
    1. Benjamini Y & Hochberg Y Controlling the false discovery rate: a practical and powerful approach to multiple testing. Journal of the Royal statistical society: series B (Methodological) 57, 289–300 (1995).
    1. DerSimonian R & Laird N Meta-analysis in clinical trials. Controlled clinical trials 7, 177–188 (1986). - PubMed
    1. Green CD et al. A comprehensive roadmap of murine spermatogenesis defined by single-cell RNA-seq. Developmental cell 46, 651–667 (2018). - PMC - PubMed

Publication types

MeSH terms