. 2022 Sep;19(9):1072-1075.
doi: 10.1038/s41592-022-01577-1. Epub 2022 Sep 1.

DNA-PAINT MINFLUX nanoscopy

Affiliations

DNA-PAINT MINFLUX nanoscopy

Lynn M Ostersehlt et al. Nat Methods. 2022 Sep.

Abstract

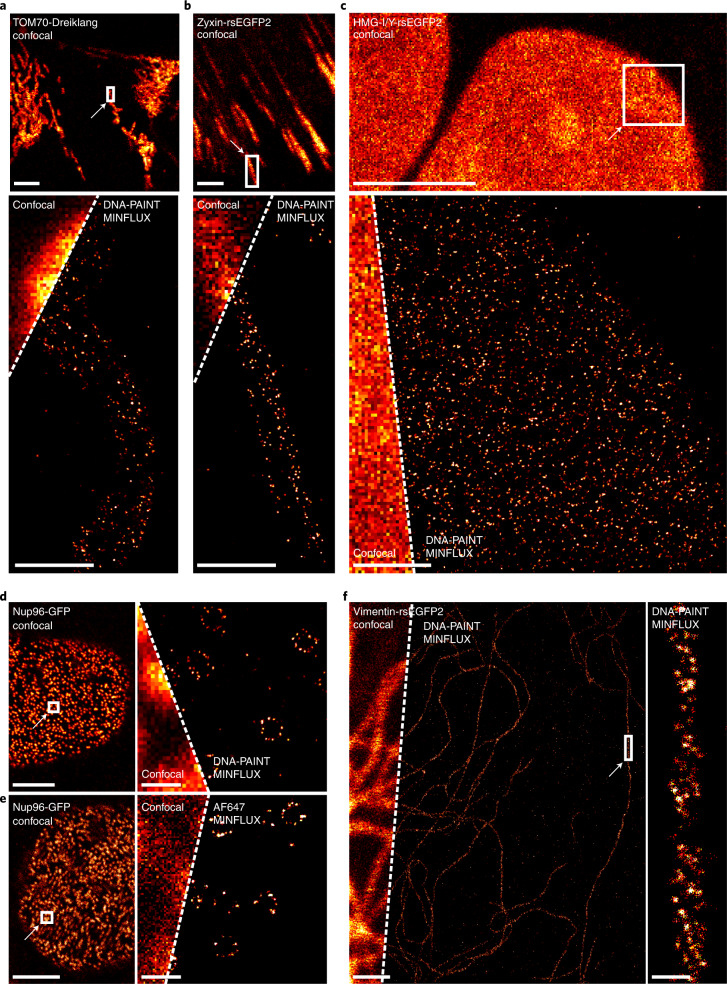
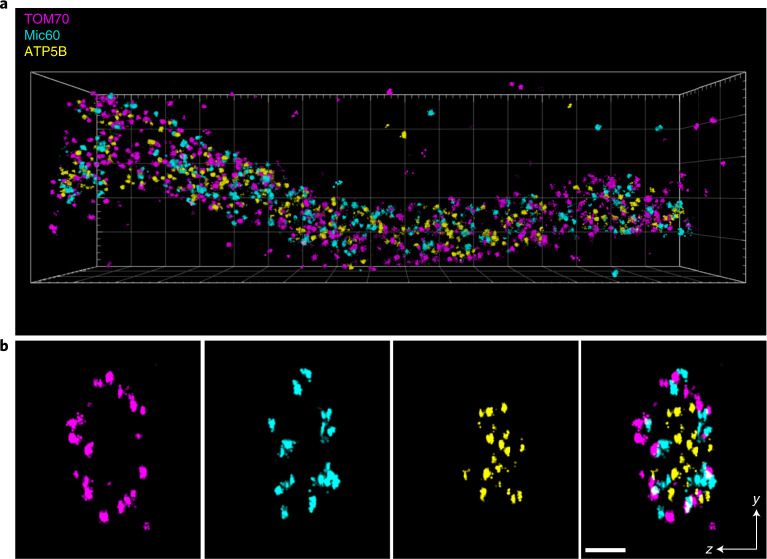
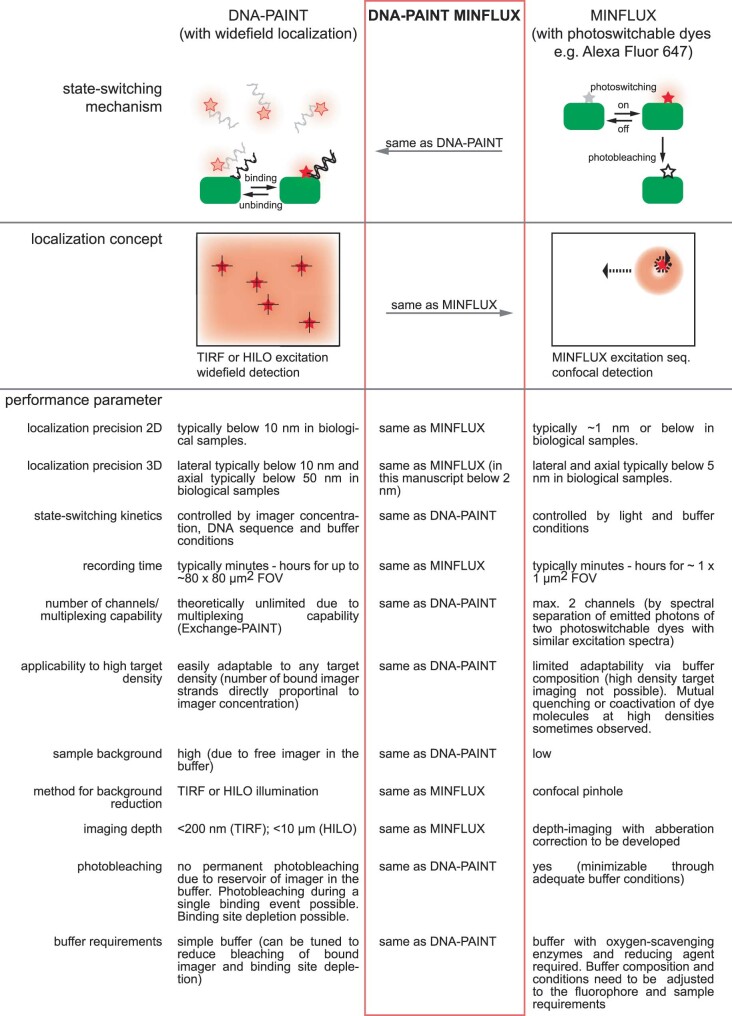
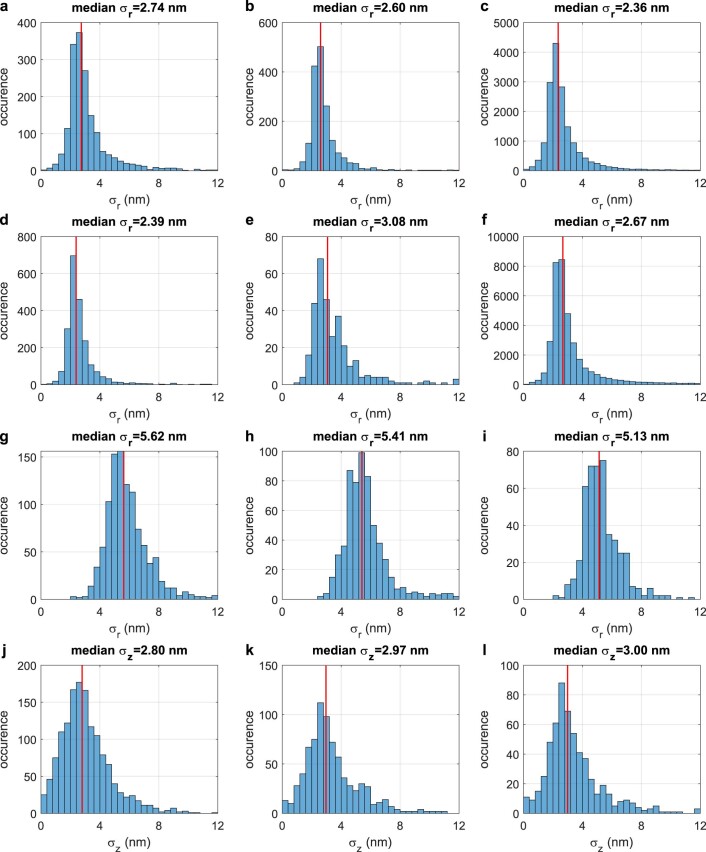
MINimal fluorescence photon FLUXes (MINFLUX) nanoscopy, providing photon-efficient fluorophore localizations, has brought about three-dimensional resolution at nanometer scales. However, by using an intrinsic on-off switching process for single fluorophore separation, initial MINFLUX implementations have been limited to two color channels. Here we show that MINFLUX can be effectively combined with sequentially multiplexed DNA-based labeling (DNA-PAINT), expanding MINFLUX nanoscopy to multiple molecular targets. Our method is exemplified with three-color recordings of mitochondria in human cells.


Conflict of interest statement

S.W.H. holds shares of Abberior Instruments and has revenues through MINFLUX patents held by the Max Planck Society. All other authors declare no competing interests.

Figures

Fig. 1
Fig. 1. 2D DNA-PAINT MINFLUX imaging.
af, Genome-edited cell lines expressing translational fusions with a fluorescent protein from the respective native genomic loci, as indicated (TOM70-Dreiklang (a), Zyxin-rsEGFP2 (b), HMG-I/Y-rsEGFP2 (c), Nup96-GFP (d, e), Vimentin-rsEGFP2 (f)), were labeled with an anti-GFP nanobody coupled to a docking strand and mounted with the imager strand (ad,f), or with an anti-GFP nanobody coupled to Alexa Fluor 647 and mounted in STORM imaging buffer (e). Confocal overview images of the fluorescent protein fluorescence were taken. The rectangles indicate areas of MINFLUX recordings. For imager strand concentrations and localization precisions, see Supplementary Table 1. All Scale bars (confocal images): 5 µm (ae), 1 µm (f). Scale bars (MINFLUX) 0.5 µm (ac), 1 µm (f), 200 nm (d,e). Scale bar (MINFLUX close-up), 50 nm (f).
Fig. 2
Fig. 2. 3D DNA-PAINT MINFLUX multiplexing.
U2OS TOM70-Dreiklang cells were fixed and immuno-labeled with an anti-GFP nanobody and anti-Mic60 and anti-ATP5B synthase antibodies. MINFLUX recordings of the three proteins were performed sequentially by adding and washing out the respective imager strands. Localizations of TOM70, Mic60 and ATP5B are displayed in magenta, cyan and yellow, respectively. a, View on a mitochondrial tubule. Size of the bounding box was 3.4 × 1 × 0.6 µm3. b, Cross section of the tubule shown in a. Thickness of the section 100 nm. Scale bar 100 nm.
Extended Data Fig. 1
Extended Data Fig. 1. Comparison of current DNA-PAINT, DNA-PAINT MINFLUX and MINFLUX implementations.
The three techniques are compared with respect to their state-switching mechanisms, their localization concepts and key performance parameters.
Extended Data Fig. 2
Extended Data Fig. 2. Histograms of the localization precisions in Fig. 1 and Fig. 2.
Blue columns represent the frequencies of localization precisions in the given dataset (a: Fig. 1a; b: Fig. 1b; c: Fig. 1c; d: Fig. 1d; e: Fig. 1e; f: Fig. 1f; g: Fig. 2 TOM70 σr; h: Fig. 2 Mic60 σr; i: Fig. 2 ATP5B σr; j: Fig. 2 TOM70 σz; k: Fig. 2 Mic60 σz; l: Fig. 2 ATP5B σz). The red line represents the median of the localization precisions in the dataset.
Extended Data Fig. 3
Extended Data Fig. 3. The labeling coverage, but not insufficient sampling during a MINFLUX recording, limits the density of localized molecules.
The individual panels show all recorded localizations in the indicated time intervals. The full field of view of the 8-hour data set is shown in Fig. 1f. The FRC resolution was calculated using all data up to a certain time point (blue circles). After 6-7 h almost no new localizations contribute to the recorded Vimentin filament and the FRC resolution reaches a plateau, suggesting that the imaging time was sufficient to localize the vast majority of available binding sites. Scale bar: 50 nm.

References

    1. Hell SW. Microscopy and its focal switch. Nat. Methods. 2009;6:24–32. doi: 10.1038/nmeth.1291. - DOI - PubMed
    1. Balzarotti F, et al. Nanometer resolution imaging and tracking of fluorescent molecules with minimal photon fluxes. Science. 2017;355:606–612. doi: 10.1126/science.aak9913. - DOI - PubMed
    1. Gwosch KC, et al. MINFLUX nanoscopy delivers 3D multicolor nanometer resolution in cells. Nat. Methods. 2020;17:217–224. doi: 10.1038/s41592-019-0688-0. - DOI - PubMed
    1. Schmidt R, et al. MINFLUX nanometer-scale 3D imaging and microsecond-range tracking on a common fluorescence microscope. Nat. Commun. 2021;12:1478. doi: 10.1038/s41467-021-21652-z. - DOI - PMC - PubMed
    1. Sahl SJ, Hell SW, Jakobs S. Fluorescence nanoscopy in cell biology. Nat. Rev. Mol. Cell Biol. 2017;18:685–701. doi: 10.1038/nrm.2017.71. - DOI - PubMed

Publication types