. 2022 Sep;54(9):1376-1389.
doi: 10.1038/s41588-022-01159-z. Epub 2022 Sep 1.

The genomic landscape of pediatric acute lymphoblastic leukemia

Samuel W Brady #  1 Kathryn G Roberts #  2 Zhaohui Gu  3 Lei Shi  4 Stanley Pounds  4 Deqing Pei  4 Cheng Cheng  4 Yunfeng Dai  5 Meenakshi Devidas  6 Chunxu Qu  2 Ashley N Hill  2 Debbie Payne-Turner  2 Xiaotu Ma  1 Ilaria Iacobucci  2 Pradyuamna Baviskar  2 Lei Wei  1 Sasi Arunachalam  1 Kohei Hagiwara  1 Yanling Liu  1 Diane A Flasch  1 Yu Liu  1 Matthew Parker  1 Xiaolong Chen  1 Abdelrahman H Elsayed  2   4 Omkar Pathak  1 Yongjin Li  1 Yiping Fan  1 J Robert Michael  1 Michael Rusch  1 Mark R Wilkinson  1 Scott Foy  1 Dale J Hedges  1 Scott Newman  1 Xin Zhou  1 Jian Wang  1 Colleen Reilly  1 Edgar Sioson  1 Stephen V Rice  1 Victor Pastor Loyola  1 Gang Wu  7 Evadnie Rampersaud  7 Shalini C Reshmi  8 Julie Gastier-Foster  9 Jaime M Guidry Auvil  10   11 Patee Gesuwan  10 Malcolm A Smith  12 Naomi Winick  13 Andrew J Carroll  14 Nyla A Heerema  15 Richard C Harvey  16 Cheryl L Willman  17 Eric Larsen  18 Elizabeth A Raetz  19 Michael J Borowitz  20 Brent L Wood  21 William L Carroll  19 Patrick A Zweidler-McKay  22 Karen R Rabin  9 Leonard A Mattano  23 Kelly W Maloney  24 Stuart S Winter  25 Michael J Burke  26 Wanda Salzer  27 Kimberly P Dunsmore  28 Anne L Angiolillo  29 Kristine R Crews  30 James R Downing  2 Sima Jeha  31 Ching-Hon Pui  31 William E Evans  30 Jun J Yang  30 Mary V Relling  30 Daniela S Gerhard  10 Mignon L Loh  32 Stephen P Hunger  33 Jinghui Zhang  34 Charles G Mullighan  35
Affiliations

The genomic landscape of pediatric acute lymphoblastic leukemia

Samuel W Brady et al. Nat Genet. 2022 Sep.

Abstract

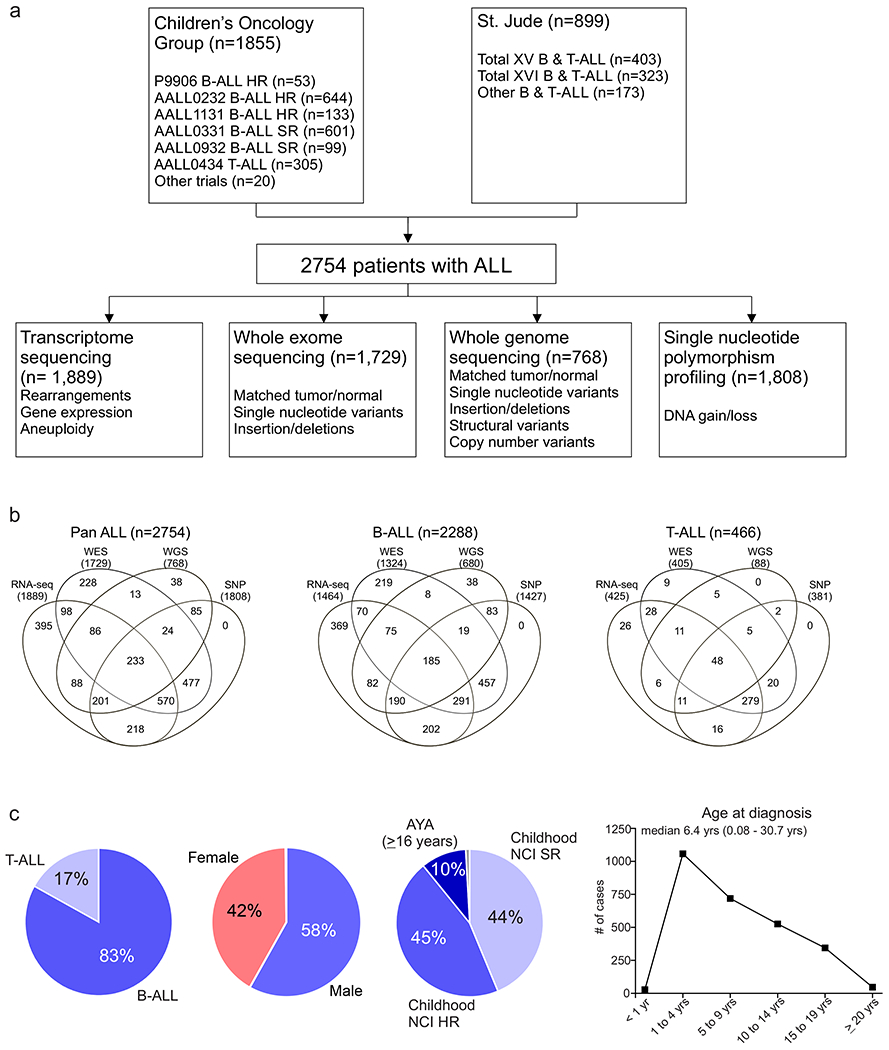
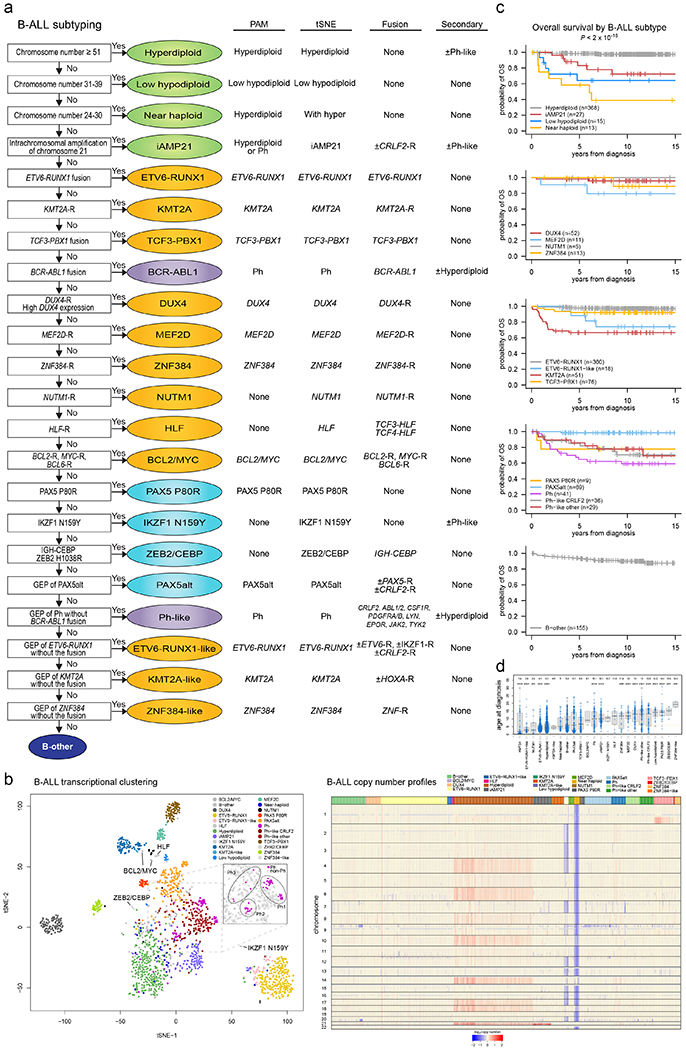
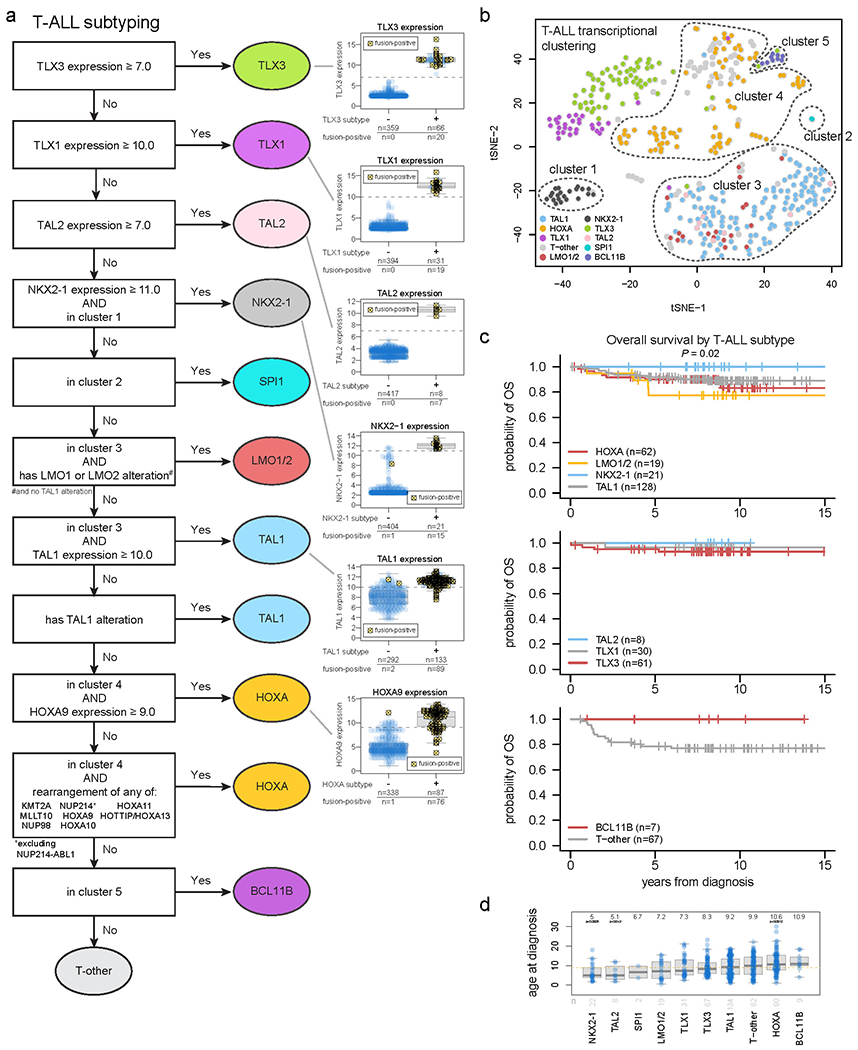
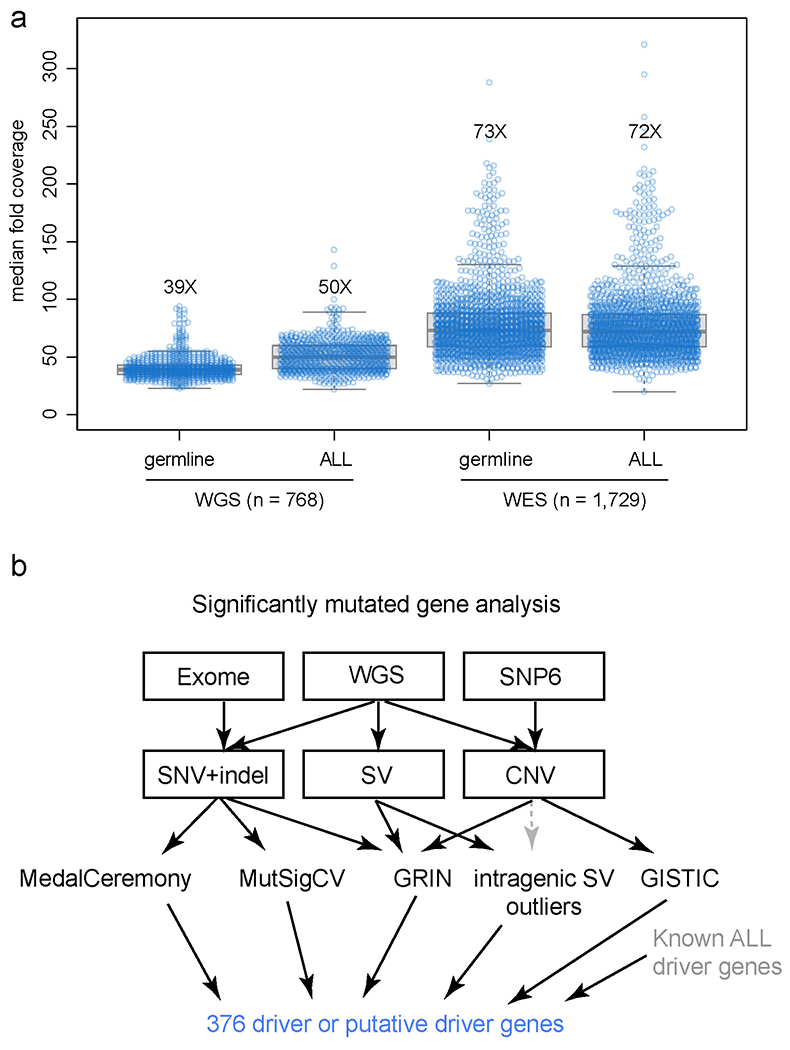
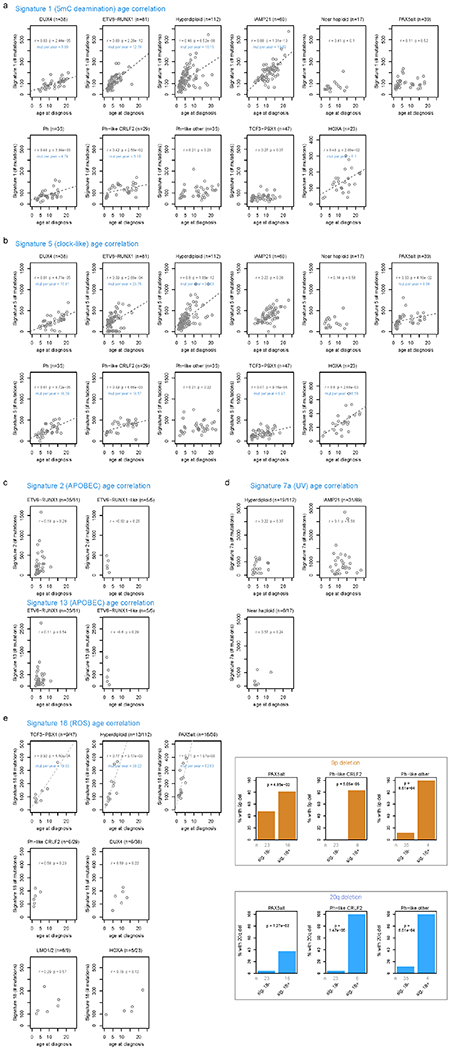
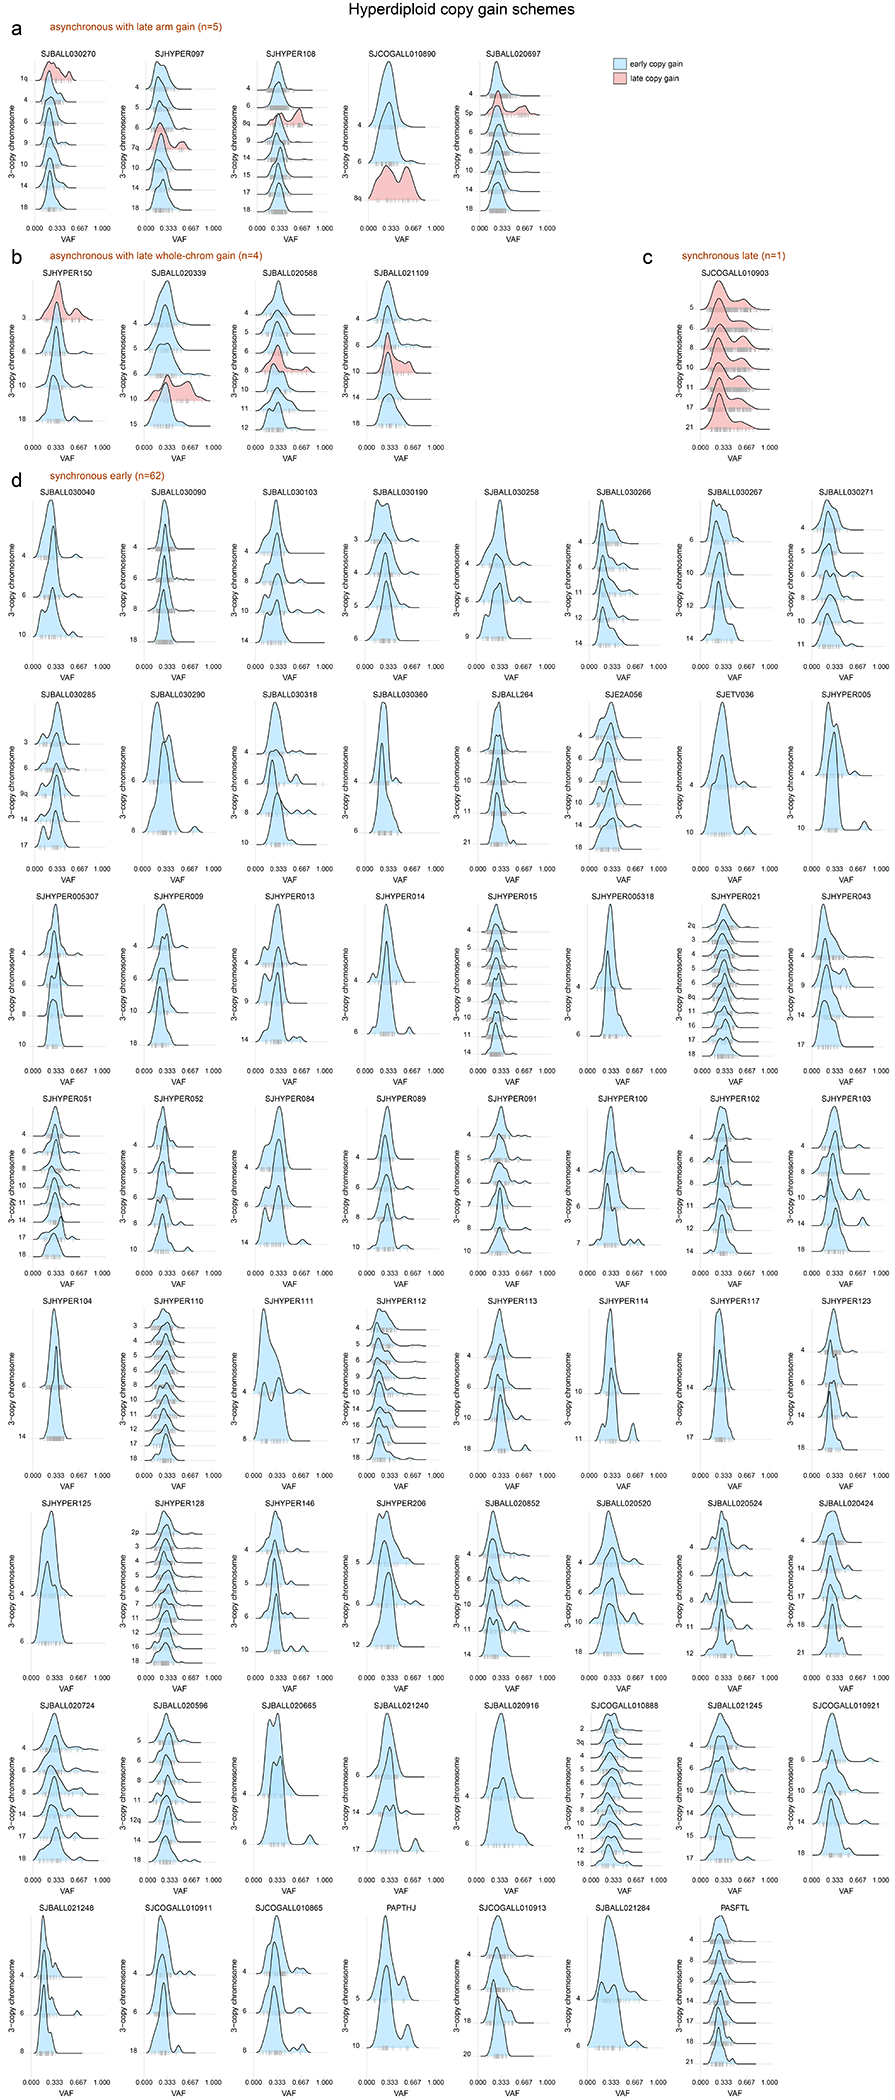
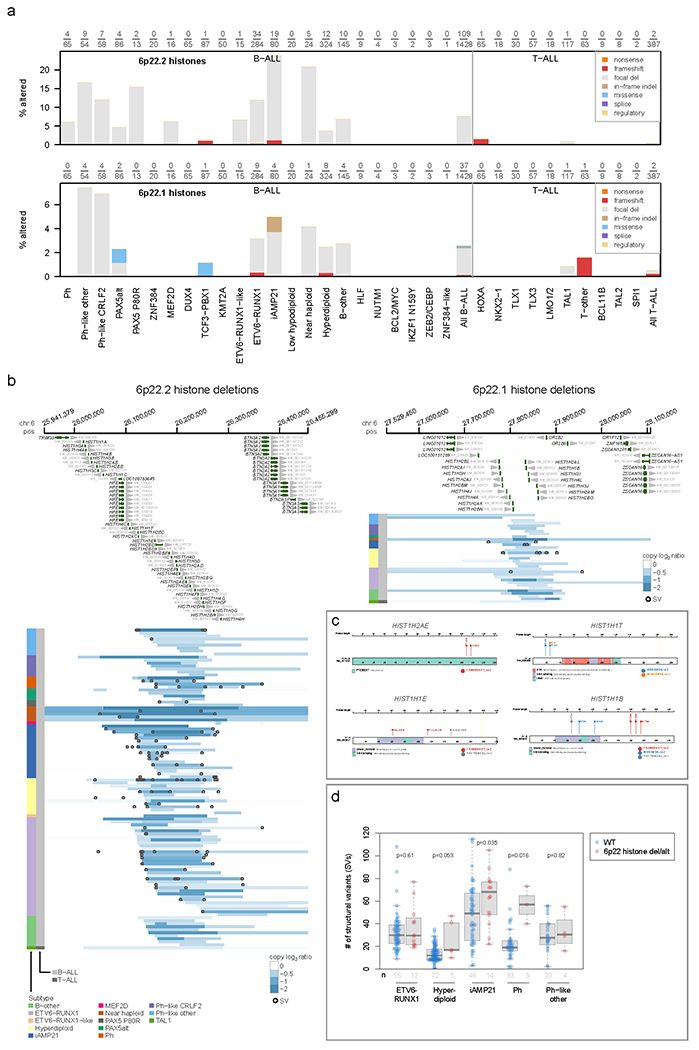
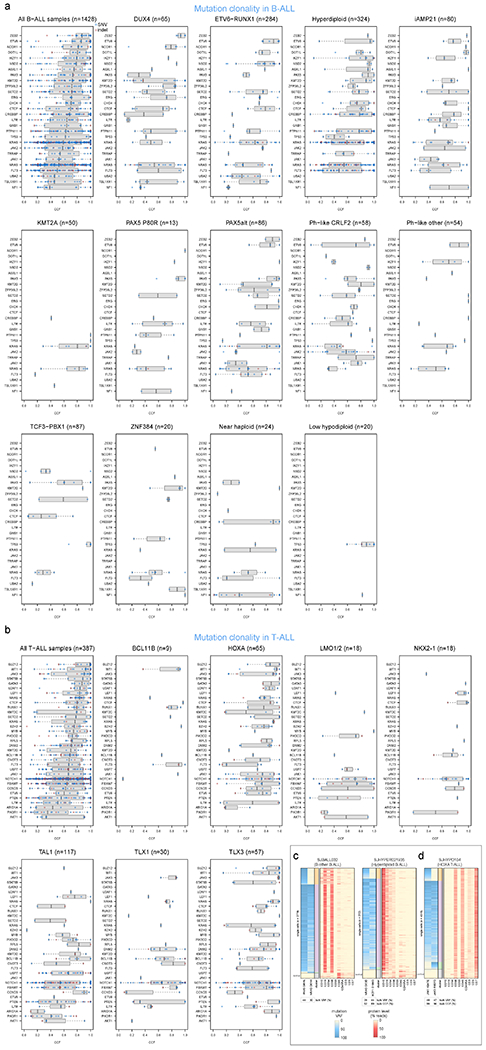
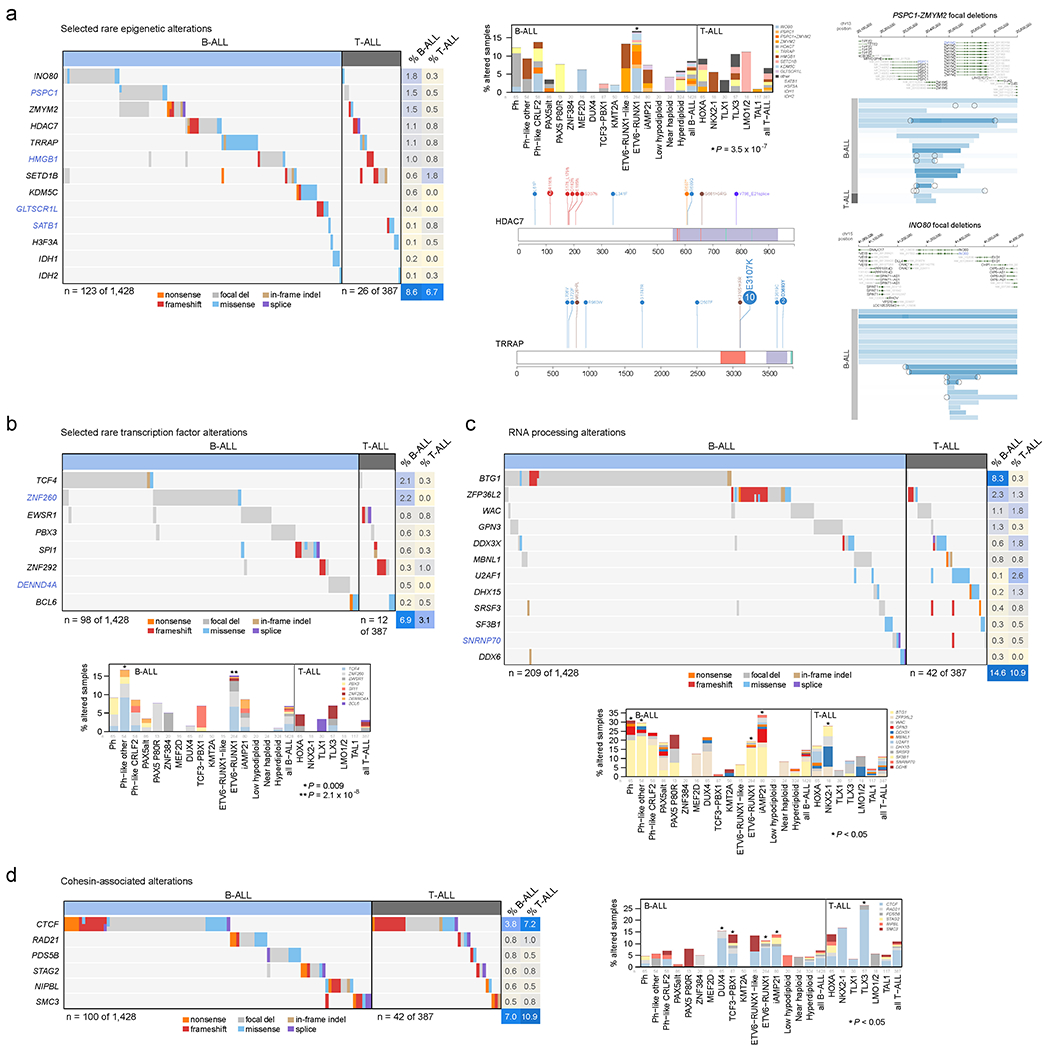
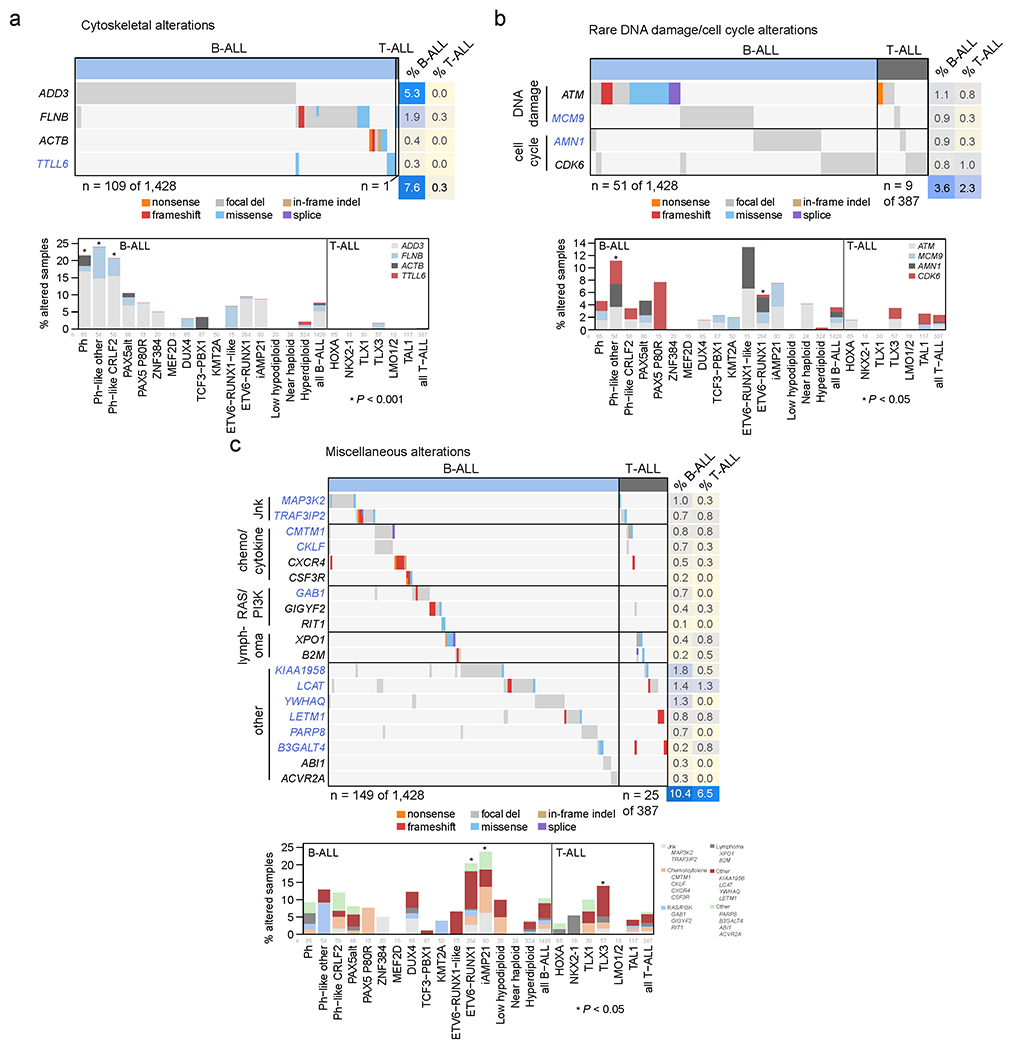
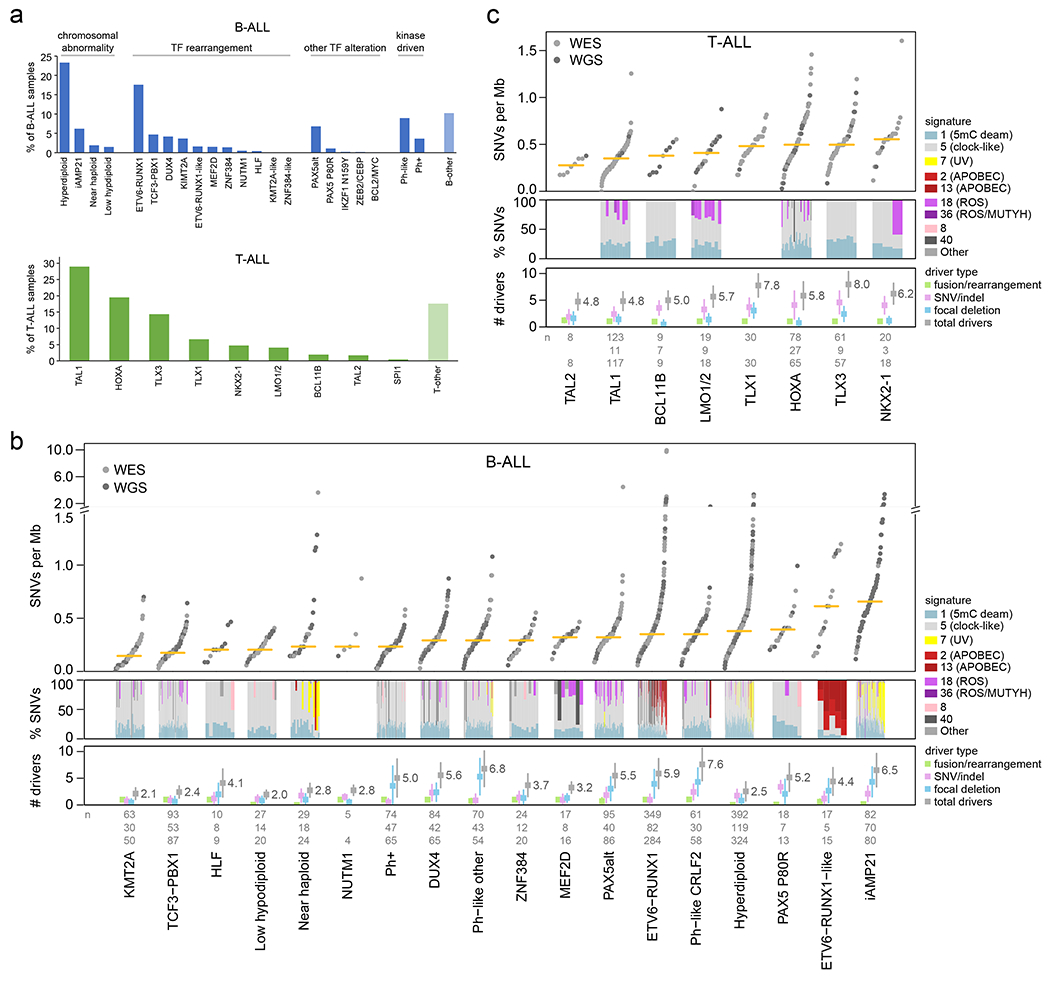
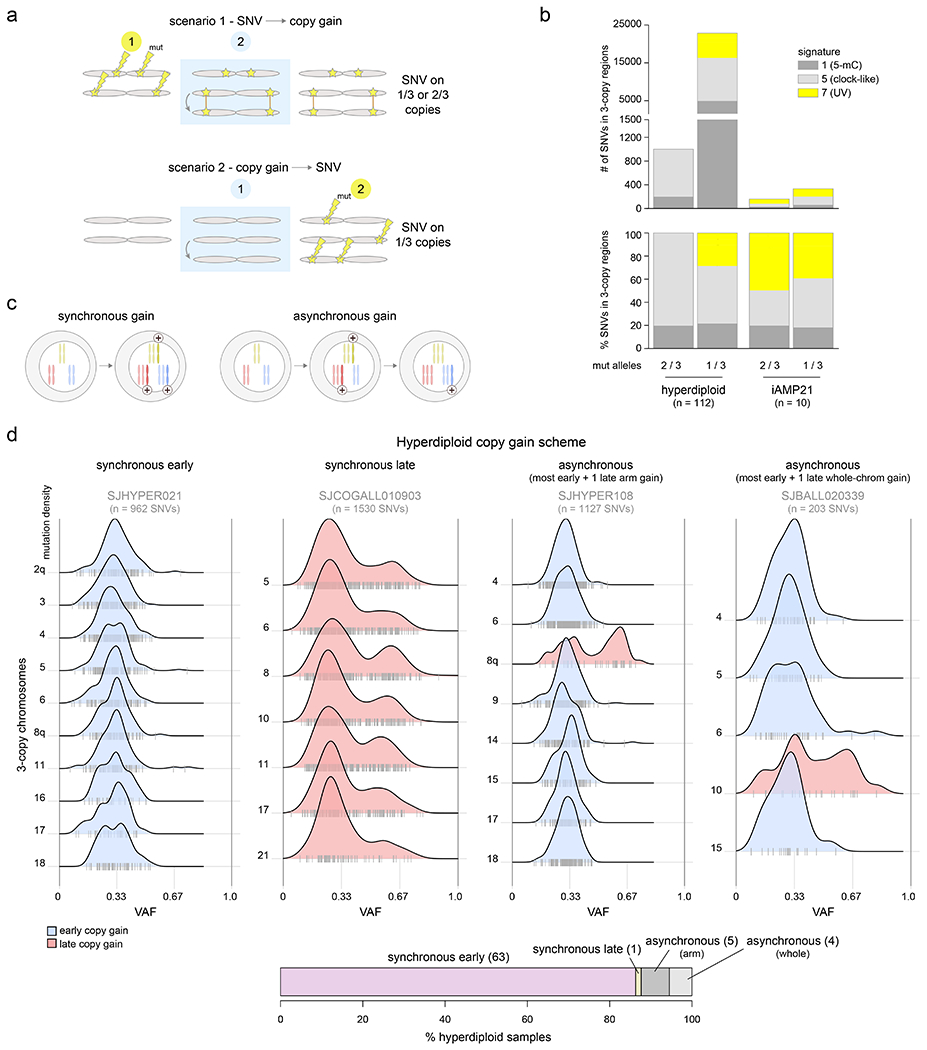
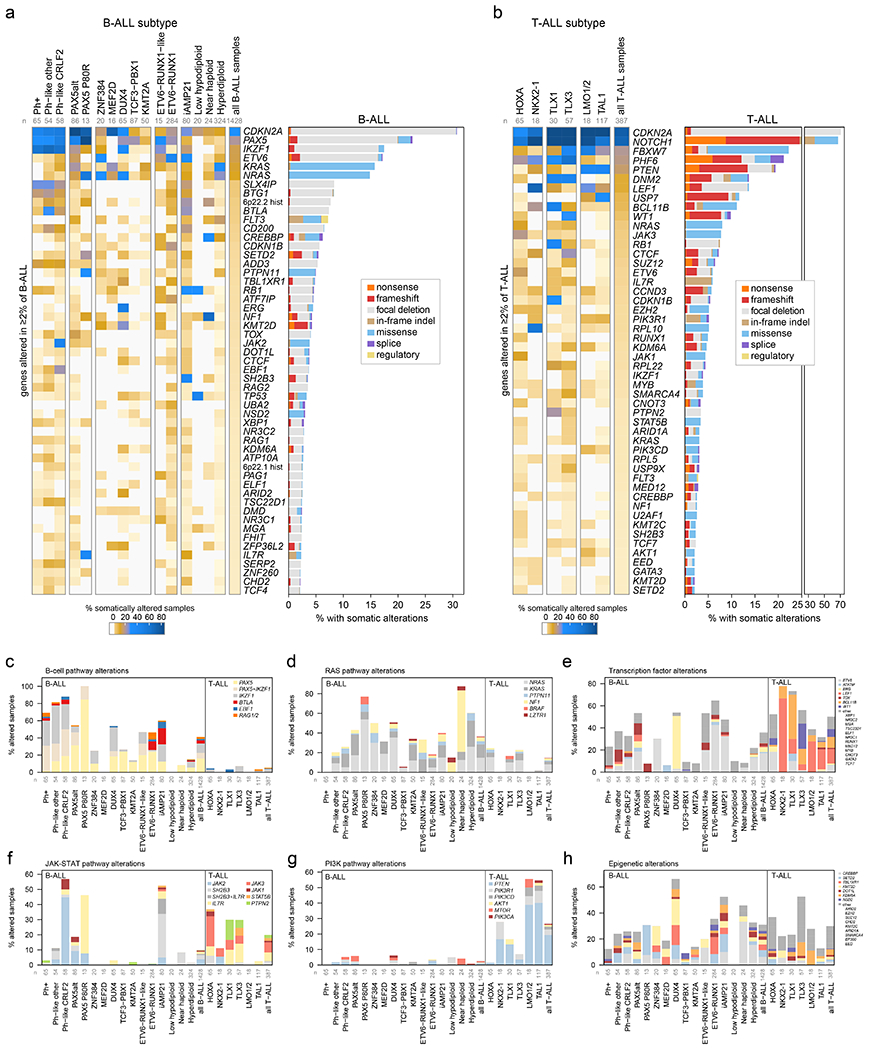
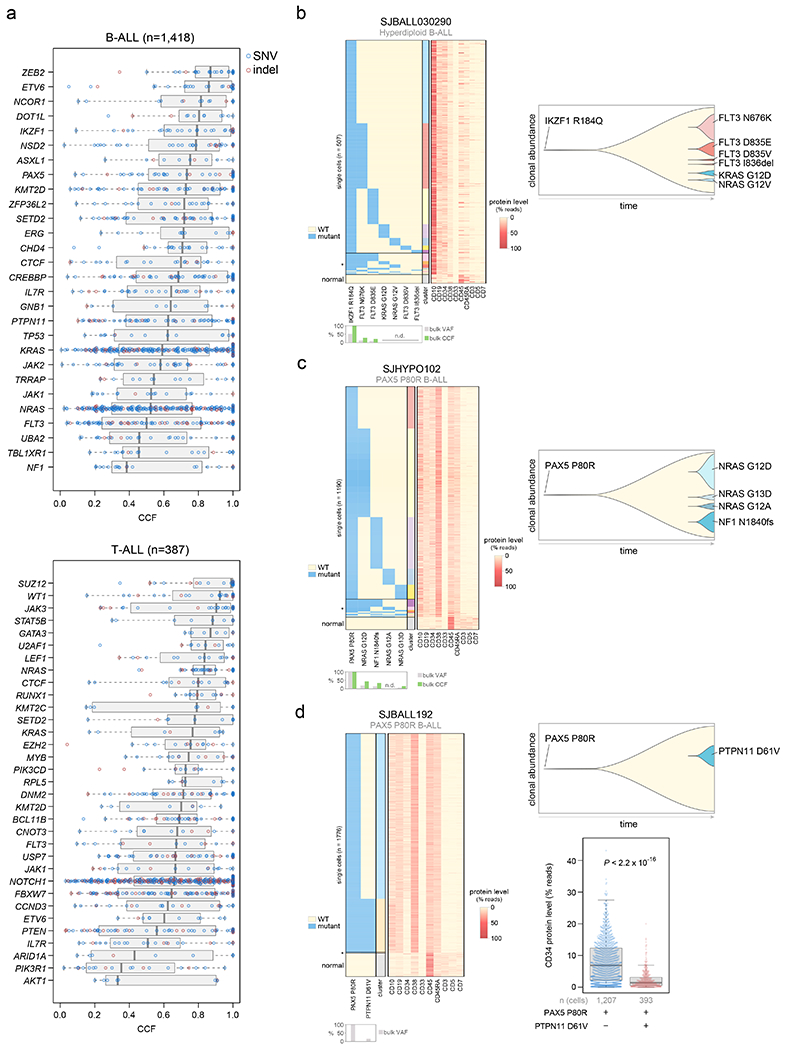
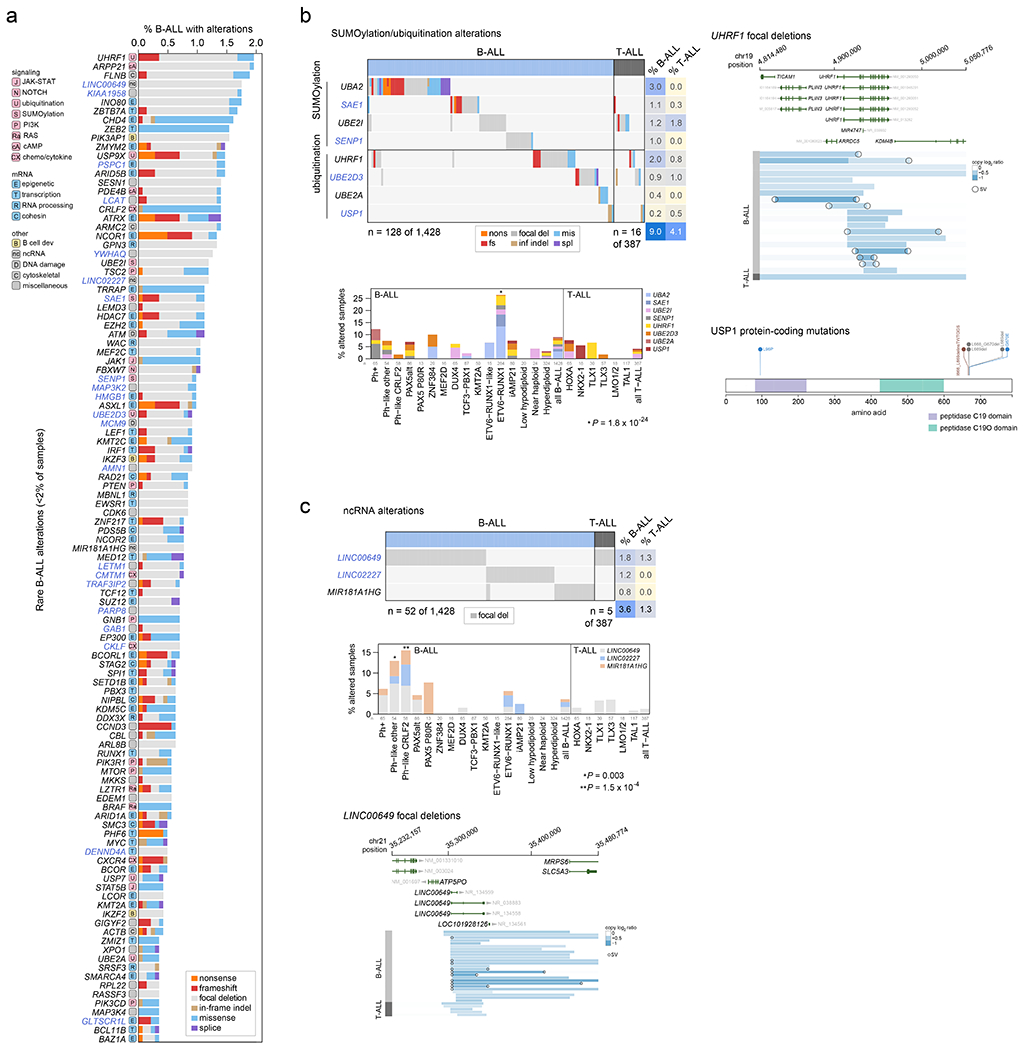
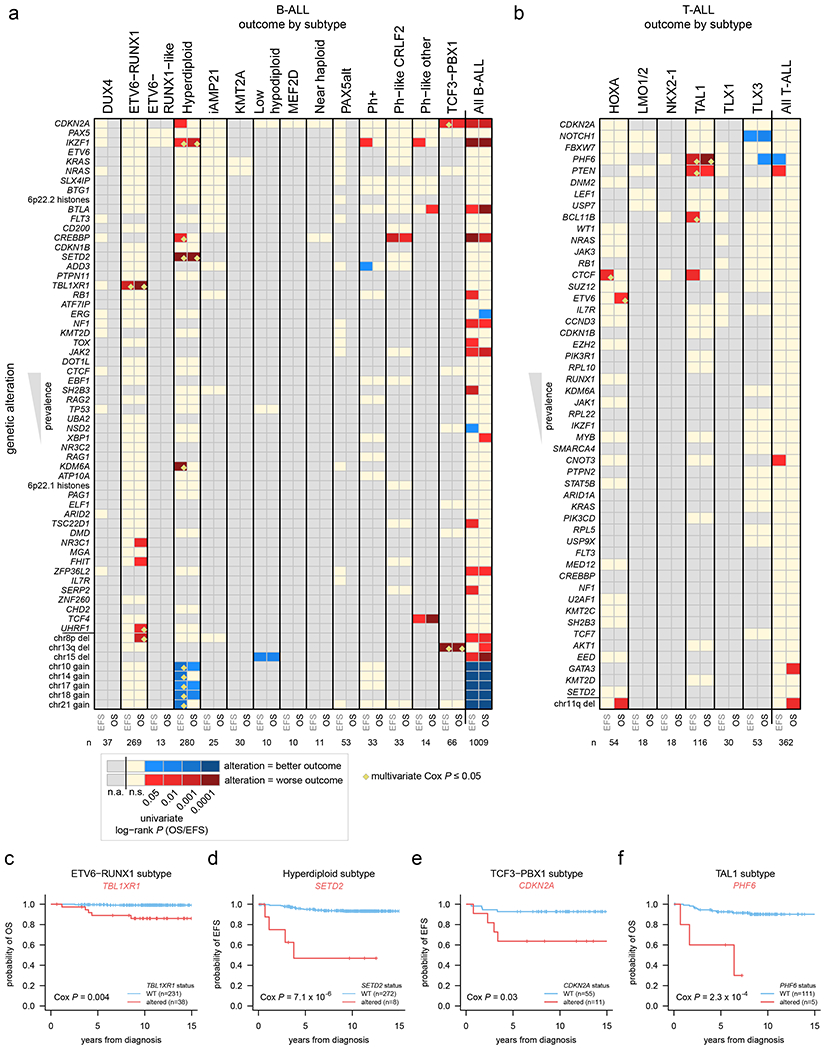
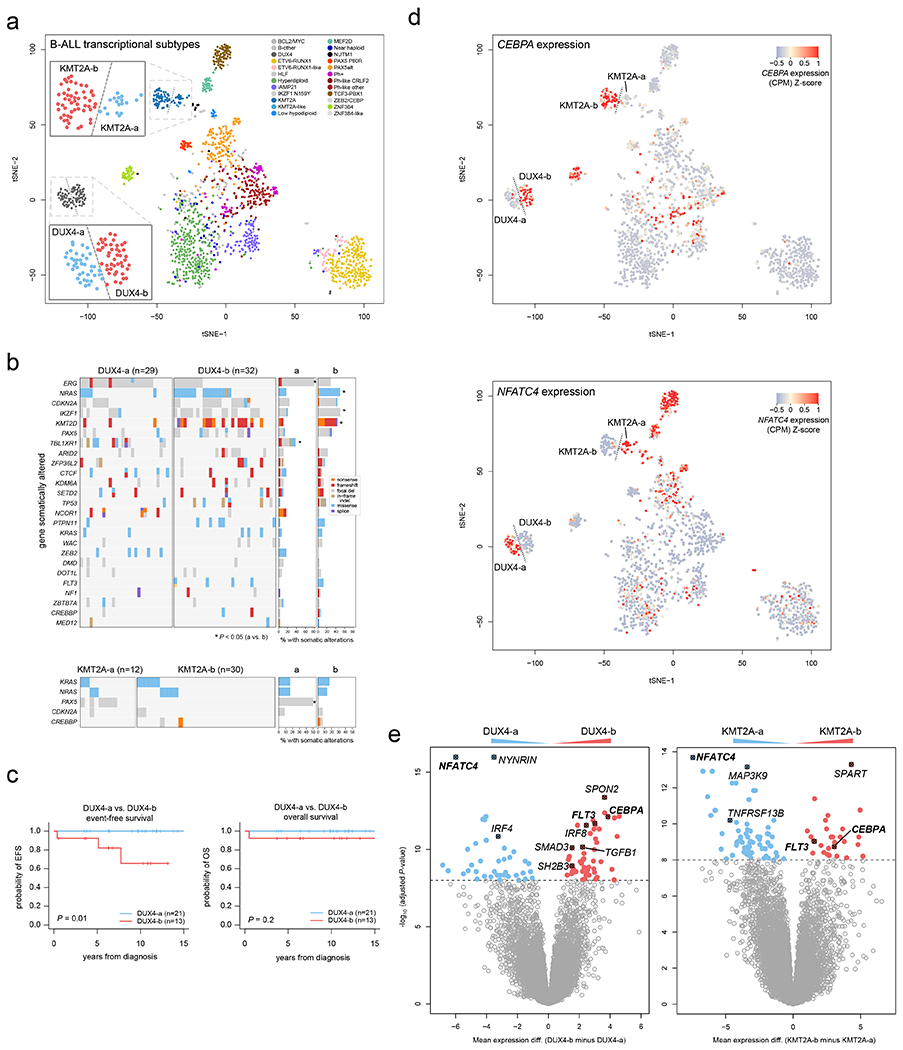
Acute lymphoblastic leukemia (ALL) is the most common childhood cancer. Here, using whole-genome, exome and transcriptome sequencing of 2,754 childhood patients with ALL, we find that, despite a generally low mutation burden, ALL cases harbor a median of four putative somatic driver alterations per sample, with 376 putative driver genes identified varying in prevalence across ALL subtypes. Most samples harbor at least one rare gene alteration, including 70 putative cancer driver genes associated with ubiquitination, SUMOylation, noncoding transcripts and other functions. In hyperdiploid B-ALL, chromosomal gains are acquired early and synchronously before ultraviolet-induced mutation. By contrast, ultraviolet-induced mutations precede chromosomal gains in B-ALL cases with intrachromosomal amplification of chromosome 21. We also demonstrate the prognostic significance of genetic alterations within subtypes. Intriguingly, DUX4- and KMT2A-rearranged subtypes separate into CEBPA/FLT3- or NFATC4-expressing subgroups with potential clinical implications. Together, these results deepen understanding of the ALL genomic landscape and associated outcomes.


Figures

Extended Data Fig. 1.
Extended Data Fig. 1.. Overview of ALL cohort
(a) Number of acute lymphoblastic leukemia (ALL) patients studied (n=2754), the different modalities of sequencing performed, and the genomic alterations identified by each. (b) Venn diagram of samples analysed by transcriptome sequencing (RNA-seq), whole exome sequencing (WES), whole genome sequencing (WGS) and single nucleotide polymorphism (SNP) profiling across the whole cohort (Pan ALL; left), in B-ALL only (middle) and in T-ALL only. (c) Distribution of patients according to lineage (left), sex (middle left), NCI standard-risk (SR), age 1 to 9.99 yrs and WBC < 50,000/μl; high-risk (HR), age 10 to 15.9 yrs and/or WBC ≥ 50,000/μl; adolescent and young adult (AYA; middle right) and age at diagnosis (right).
Extended Data Fig. 2
Extended Data Fig. 2. Subtype classification of B-ALL
(a) Flow chart for B-ALL subtype classification; for detailed description of criteria, see Supplementary Methods. (b) Left, tSNE of B-ALL cases with RNA-seq. Right, copy number heatmap of B-ALL samples as determined by WGS or SNP copy array (n=1,630 samples), with subtype indicated by color at top. (c) Kaplan-Meier survival curves with overall survival distributions for each B-ALL subtype. Subtypes are separated into five graphs for ease of visualizing the various subtypes. Subtypes with at least 5 samples are shown. P value shown is by two-sided log-rank test comparing all subtypes shown in all five graphs. (d) Age at diagnosis by B-ALL subtype. Boxplot shows median (thick center line) and interquartile range (box). Whiskers are described in R boxplot documentation (a 1.5*interquartile range rule is used). Text at top shows median age in the subtype. P values compare ages from the subtype vs. all other B-ALL samples by Wilcoxon rank-sum test; P values ≤ 0.05 are shown. Numbers of patients are shown at bottom, and yellow line indicates median age across B-ALL.
Extended Data Fig. 3
Extended Data Fig. 3. Subtype classification of T-ALL
(a) Flow chart for T-ALL subtype classification and inclusion in clusters 1-4 as drawn on the tSNE plot. Classification begins at the top and samples meeting the indicated criteria are assigned to subtypes shown at right. Boxplots to the right show the expression of these genes in samples assigned to the indicated subtype (+) or not assigned (−). Samples bearing a detected fusion or rearrangement defining the subtype are marked with yellow circles with X marks. The gene expression thresholds indicated at left were determined based on the expression levels in fusion-positive samples. Samples where gene expression was above these thresholds but no fusion was detected were assumed to likely have a fusion and were thus assigned to that subtype, since the fusion may have been undetected due to technical issues (e.g. TLX3 enhancer hijacking rearrangements may be hard to detect with RNA-seq since they do not always create fusion transcripts). Boxplots show median (thick center line) and interquartile range (box). Whiskers are described in R boxplot documentation (a 1.5*interquartile range rule is used). (b) tSNE of T-ALL cases with RNA-seq. (c) Kaplan-Meier survival curves with overall survival distributions for each T-ALL subtype, shown in three graphs for ease of visualization. Subtypes with at least 5 samples are shown. P value shown is by two-sided log-rank test comparing all subtypes shown in all graphs. (d) Age at diagnosis by T-ALL subtype. Boxplot shows median (thick center line) and interquartile range (box). Whiskers are described in R boxplot documentation (a 1.5*interquartile range rule is used). Text at top shows median age in the subtype. P values compare ages from the subtype vs. all other T-ALL samples by two-sided Wilcoxon rank-sum test; P values ≤ 0.05 are shown. Numbers of patients are shown at bottom, and yellow line indicates median age across T-ALL.
Extended Data Fig. 4
Extended Data Fig. 4. Sequencing coverage and identification of significantly mutated genes
(a) Each sample’s median sequencing coverage based on WGS (n=768) or WES (n=1,729) is shown, including both germline and cancer (ALL) samples for each patient. Boxplot shows median (thick center line) and interquartile range (box). Whiskers are described in R boxplot documentation (a 1.5*interquartile range rule is used). The median coverage across all samples is indicated by text (e.g. “39X”). For WGS, the genome-wide coverage for each sample is indicated by each point. For WES, the median coverage in all protein-coding regions of exons (excluding 5’ and 3’ untranslated regions), as defined by the UCSC refGene.txt file, is shown. (b) Approach for identification of significantly mutated genes. The sequencing platform is shown on top, followed by the variant types detected by each platform below, and the third layer shows the tools used to identify significantly altered genes, with arrows indicating the variant types used as input to these tools. Intragenic SV outliers were identified initially by frequent SVs within the gene, and were corroborated manually with copy number analysis (dotted gray line) as the SVs were usually at the boundaries of focal deletions. All significantly mutated genes’ focal deletion and SNV/indel mutation site localization were manually inspected and those considered unlikely drivers were excluded. When combining the significantly mutated genes thus identified with the list of known drivers in ALL, a list of 376 driver or putative driver genes was identified.
Extended Data Fig. 5
Extended Data Fig. 5. Correlation of COSMIC signatures with age and genetic alterations
For each B-ALL and T-ALL subtype, the correlation between signature abundance (in number of SNVs, y-axis) and the age at diagnosis (x-axis) is shown. This includes samples sequenced by WGS which had mutational signature cosine similarities (comparing the sample profile vs. the profile as reconstructed by signatures) of 0.85 or above, and which also had available age information. Only subtypes with at least 5 samples meeting these criteria are shown, and the number of samples in each subtype are shown above each plot. Two-sided Pearson r correlation was performed to obtain the P and r values shown for each subtype. For subtypes with P < 0.05, linear regression was performed resulting in the linear fits shown, along with text indicating the slope of the line in mutations per year. (a) Signature 1 (5mC deamination). (b) Signature 5 (clock-like). (c) Signatures 2 and 13 (APOBEC). (d) Signature 7 (UV). (e) Signature 18 (ROS; left). Somatic alterations significantly correlating with signature 18 (right). Each somatic alteration (chromosome-level copy alterations and driver/putative driver genes) was tested for correlation with the presence vs. absence of signature 18, and 20q deletion and 9p deletion were significantly associated with signature 18 in the subtypes shown. P values are by two-sided Fisher’s exact test, and the number of samples in each group are shown below (n). Only WGS samples were analyzed.
Extended Data Fig. 6
Extended Data Fig. 6. Copy gain schemes in each hyperdiploid sample.
Each hyperdiploid sample sequenced by WGS is shown. This analysis tests whether copy gains likely occurred simultaneously or sequentially and is an expanded version of the examples shown in Fig. 2d, showing all 72 samples. Only 3-copy chromosomes with at least 20 somatic SNVs in the sample were analyzed, and only samples with two or chromosomes meeting this criterion were analyzed. On density plots, x-axes show VAF adjusted for tumor purity, and y-axes show each 3-copy whole-chromosome or arm gain in the sample. Vertical ticks on x-axis show individual SNV VAFs; an abundance of VAFs around 0.67 indicates late copy gains since the SNVs occurred prior to the copy gains (2 of 3 copies), while a preponderance of VAFs around 0.33 indicates early copy gains since most SNVs occurred after the copy gains (1 of 3 copies). Blue indicates an inferred early copy gain and red a late copy gain. (a) Samples falling into the asynchronous with late arm gain scheme, where most copy gains occur early with one chromosome arm gain occurring later. (b) Samples falling into the asynchronous with whole-chromosome gain scheme, where most copy gains occur early with one whole-chromosome gain occurring later. (c) Lone sample belonging to the synchronous late gain scheme, where all copy gains appear to occur simultaneously and occur late, after substantial point mutations have had time to accumulate (thus present on 2 of 3 copies). (d) Samples belonging to the synchronous early gain scheme, where all copy gains appear to occur simultaneously and occur early, before substantial point mutations have had time to accumulate (SNVs are present on 1 of 3 copies).
Extended Data Fig. 7
Extended Data Fig. 7. Genetic alterations affecting histone genes on chromosome 6p22.2 and 6p22.1
(a) Prevalence of genetic alterations affecting any of the histones on 6p22.2 (top) or 6p22.1 (bottom) in each ALL subtype. Y-axis indicates the percentage of samples affected in each subtype, and the exact number of samples altered along with the number of samples analyzed in each subtype is shown above each plot. Samples with characterisation of both SNVs/indels and copy number alterations (through WGS or WES combined with SNP array) were analyzed. Alteration types are indicated by color (see legend at top right) and exclude fusions. If a sample had an alteration in more than one histone or more than one alteration type, only one alteration at the highest rank in the legend of alterations (e.g. “nonsense” has top priority) was shown. (b) Focal deletions (5 Mb or less; blue indicates degree of copy loss in each sample (row) and circles indicate SVs which were available for WGS samples only) at 6p22.2 (left) or 6p22.1 (right) affecting at least one histone in either region. Color at left indicates the subtype and lineage (B-ALL or T-ALL) as indicated by legend at bottom. (c) Sites of non-silent SNVs and indels in histones on 6p22 which were recurrently altered. Protein domains are indicated in color. (d) Somatic structural variant (SV) burden in patients with or without (WT) deletion of one or more histones on 6p22.2 or 6p22.1 or other SNV/indel alterations in histone genes such as those in (c). Only patients with Illumina WGS data were analyzed, and only ALL subtypes with at least 3 histone-altered samples are shown. P values are by two-sided Wilcoxon rank-sum test. Boxplots show median (thick center line) and interquartile range (box). Whiskers are described in R boxplot documentation (a 1.5*interquartile range rule is used).
Extended Data Fig. 8
Extended Data Fig. 8. Clonality of driver SNVs and indels in B-ALL and T-ALL.
(a-b) The cancer cell fraction (CCF, x-axis), i.e. the percentage of cancer cells harboring each mutation, of alterations in each driver or putative driver gene is shown in (a) all B-ALL samples or the indicated B-ALL subtype, or (b) all T-ALL samples or the indicated T-ALL subtype. The CCF was calculated based on the VAF, copy number, and tumor purity of each sample; calculated CCFs above 1.0 were considered 1.0. Samples with both SNV/indel and copy number characterisation are shown. For subtype-specific plots, only subtypes with at least 20 samples meeting this criterion are shown. Each plot shows the number of samples analyzed (n) at top. For most samples, only SNVs/indels in 2-copy regions were analyzed, except for near haploid and low hypodiploid where only SNVs/indels in 1-copy regions were analyzed. SNVs are shown in blue and indels in red; each point represents one somatic mutation. Boxplots show median (thick center line) and interquartile range (box). Whiskers are described in R boxplot documentation (a 1.5*interquartile range rule is used). Known or putative driver genes with at least 10 SNVs/indels in 2-copy regions across all B-ALL samples, or 8 SNVs/indels in 2-copy regions across all T-ALL samples, are shown. (c-d) Targeted single-cell DNA sequencing plus protein analysis of two B-ALL samples (c) and one T-ALL sample (d). For each patient, a heatmap is shown with each row representing one cell, and each column representing either one mutation (left side) or one protein (right side). Mutation VAF is indicated by blue color, while protein level (as a percent of all protein-associated reads detected in the cell) is indicated by red color. At bottom of heatmap likely normal cells are indicated. The bulk VAF of each mutation is indicated below, along with bulk CCF (if copy number was available).
Extended Data Fig. 9
Extended Data Fig. 9. Alterations in rarely mutated genes affecting gene expression.
(a) Selected alterations in rare epigenetic modulators. Putative cancer driver genes are shown in blue text. Left shows an oncoprint showing only samples with alterations in at least one of these genes, with alteration type indicated by color and the percentage of samples in B-ALL or T-ALL altered at right. Top-middle shows the percentage of each subtype with alterations in these genes, color-coded by the specific gene altered. In samples with alterations with more than one gene, only the top-most gene in the legend is shown. Number of samples in each subtype is as in Fig. 5b. Right shows example gene alterations, including focal deletions (5 Mb or less; blue indicates degree of copy loss in each sample (row) and circles indicate SVs which were available for WGS samples only) in PSPC1-ZMYM2 and INO80. Sites of sequence alterations in HDAC7 and TRRAP are shown at middle-bottom. (b-d) Oncoprints and subtype bar plots as in (a) except that shown are selected transcription factors (b), RNA processing factors (c), and cohesion-associated genes (d). P values (asterisks) are by two-sided Fisher’s exact test comparing prevalence in the indicated subtype vs. all samples not belonging to that subtype (within that lineage (B-ALL or T-ALL), so that ETV6-RUNX1 subtype would be compared to B-ALL samples of other subtypes, while TLX3 subtype would be compared to T-ALL samples of other subtypes). In (c), exact P values are 8.6 x 10⁻⁴ (Ph), 0.0047 (Ph-like other), 0.015 (ETV6-RUNX1), 9.7 x 10⁻⁶ (iAMP21), and 0.035 (NKX2-1). In (d), exact P values are 0.020 (DUX4), 0.016 (TCF3-PBX1), 0.0027 (ETV6-RUNX1), 0.023 (iAMP21), and 2.6 x 10⁻⁴ (TLX3).
Extended Data Fig. 10
Extended Data Fig. 10. Alterations in rarely mutated genes affecting the cytoskeleton and other miscellaneous alterations
(a) Selected alterations in cytoskeleton-related genes. Putative cancer driver genes are shown in blue text. Top shows an oncoprint showing only samples with alterations in at least one of these genes, with alteration type indicated by color and the percentage of samples in B-ALL or T-ALL altered at right. Bottom shows the percentage of each subtype with alterations in these genes, color-coded by the specific gene altered. In samples with alterations with more than one gene, only the top-most gene in the legend is shown. Number of samples in each subtype is as in Fig. 5b. (b-c) Oncoprints and subtype bar plots as in (a) except that shown are selected rare alterations affecting DNA damage or the cell cycle (b), and miscellaneous alterations affecting various pathways as indicated by text to the left (c). P values (asterisks) are by two-sided Fisher’s exact test comparing prevalence in the indicated subtype vs. all samples not belonging to that subtype (within that lineage (B-ALL or T-ALL), so that ETV6-RUNX1 subtype would be compared to B-ALL samples of other subtypes, while TLX3 subtype would be compared to T-ALL samples of other subtypes). In (a), exact P values are 2.2 x 10⁻⁴ (Ph), 1.1 x 10⁻⁴ (Ph-like other), and 9.5 x 10⁻⁴ (Ph-like CRLF2). In (b), exact P values are 0.011 (Ph-like other), and 0.048 (ETV6-RUNX1). In (c), exact P values are 1.4 x 10⁻⁸ (ETV6-RUNX1), 4.2 x 10⁻⁴ (iAMP21), and 0.019 (TLX3).
Figure 1.
Figure 1.. ALL cohort, mutational burden, and mutational signatures.
(a) Bar graphs showing the percentage of analyzed samples belonging to each B-ALL (top) or T-ALL (bottom) subtype. (b) Top, mutational burden in each B-ALL subtype with at least 5 samples. This shows the number of somatic SNVs per megabase (Mb) in each sample (points) sequenced by WES (gray) or WGS (dark gray), with the median indicated by a yellow bar. Beneath this, mutational signatures are shown for each WGS sample in subtypes with at least 3 WGS samples. Signatures are shown as the percentage of SNVs caused by each signature (y-axis), as indicated by colors in the legend at right. Samples in each subtype are sorted by increasing mutation burden from left (low burden) to right (high burden). Bottom shows the number of somatic driver or putative driver alterations per sample, with center indicating mean and whiskers indicating standard deviation. Known/putative driver alterations, detected by WGS, WES, or RNA-seq, are separated into fusions/rearrangements (such as driver fusions and enhancer hijacking events), coding SNVs or indels in putative driver genes, and focal deletions in putative driver genes (tumor suppressors). The sum of all putative driver alterations is also shown (total drivers). If the same gene was affected twice by SNVs, indels, or focal deletions in one sample, it was counted as one alteration. The n values at bottom indicate the number of samples analyzed per subtype for mutation burden (top, samples with WGS or WES), mutational signatures (middle, WGS), or putative driver burden (bottom, WGS or WES plus SNP copy array). (c) As in (b), except for T-ALL.
Figure 2.
Figure 2.. Temporal evolution of ultraviolet-associated mutations and copy gains in aneuploid B-ALL subtypes.
(a) Schematic showing how to infer whether copy gains occurred early or late (relative to the occurrence of SNVs). Two homologous chromosomes are shown before (left), during (blue shaded box), and after (right) a somatic gain of one of the two homologs. Top shows a scenario where SNVs (stars) occurred before copy gains, which would lead to half of SNVs being found on 1 of 3 copies and half on 2 of 3 copies, after the gain. Bottom shows a scenario where copy gains happened early, prior to SNVs, and thus all SNVs occur on 1 of 3 copies. (b) Mutational signature analysis pooling all somatic SNVs in 3-copy regions from B-ALL hyperdiploid (n=110 samples) or iAMP21 (n=7) samples (sequenced by WGS), separated into SNVs found on 1 of 3 copies (VAF ≈ 0.33) or 2 of 3 copies (VAF ≈ 0.67; see Methods). Top shows absolute number of SNVs and bottom shows relative number (percentage). (c) Scheme showing two possible modes of acquiring copy gains in hyperdiploid ALL. Left shows a scenario where all copy gains occur simultaneously (synchronous), such as during a single aberrant mitosis. Right shows sequential acquisition of copy gains (asynchronous) through multiple copy gain events occurring over time. (d) Copy gain schemes in hyperdiploid samples, to test whether copy gains likely occurred simultaneously or sequentially. Top shows examples of the four schemes that were detected across 72 hyperdiploid WGS samples, where only 3-copy chromosomes with at least 20 somatic SNVs in the sample were analyzed, and only samples with two or more chromosomes meeting this criterion were analyzed. On density plots, x-axes show VAF adjusted for tumor purity, and y-axes show mutation density for each 3-copy whole-chromosome or arm gain in the sample. Vertical ticks on the x-axis show individual SNV VAFs; an abundance of VAFs around 0.67 indicates late copy gains since the SNVs occurred prior to the copy gains (2 of 3 copies), while a preponderance of VAFs around 0.33 indicates early copy gains since most SNVs occurred after the copy gains (1 of 3 copies). Blue indicates an inferred early copy gain and red a late copy gain. Bottom shows the percentage of the 72 samples falling into each category. The density profiles for all 72 samples are shown in Extended data fig. 6.
Figure 3.
Figure 3.. Mutational landscapes across ALL subtypes.
ALL samples with characterization of both somatic SNVs/indels and copy alterations are shown (WGS samples as well as WES samples which also had SNP array analysis), totaling 1,428 B-ALL and 387 T-ALL samples. Subtypes with at least 15 samples are shown. (a) Left, heatmap showing the percentage of samples in each subtype (column) with somatic alterations (excluding fusions) in all genes (rows) altered in at least 2% of B-ALL samples. Right shows the percentage of samples with alterations in each gene, with the alteration type indicated by color. In samples with more than one type of alteration, only the alteration higher up in the key list (starting with “nonsense”) is shown. “Regulatory” refers to FLT3-region focal deletions thought to increase FLT3 expression. n below subtype name indicates number of samples analyzed in each subtype. (b) As in (a) but for T-ALL. (c-h) Percent of samples with somatic alterations (excluding fusions) in each pathway, broken down by subtype. The specific gene altered is indicated in color. In samples where more than one gene is altered in the pathway, the gene towards the top of the legend is only shown. Frequently co-occurring gene alterations are shown as a separate color (e.g. samples with both PAX5 and IKZF1 alteration in (c)). Sample numbers for each subtype are as in (a-b).
Figure 4.
Figure 4.. Clonality of driver SNVs and indels.
(a) The cancer cell fraction (CCF, x-axis), i.e. the percentage of cancer cells harboring each mutation, of alterations in each driver or putative driver gene is shown in all B-ALL samples (top) or all T-ALL samples (bottom). The CCF was calculated based on the VAF, copy number, and tumor purity of each sample; calculated CCFs above 1.0 were considered 1.0. Samples with both SNV/indel and copy number characterization (WGS or WES plus SNP array) are shown. Each plot shows the number of samples analyzed (n) at top. For most samples, only SNVs/indels in 2-copy regions were analyzed, except for near haploid and low hypodiploid where only SNVs/indels in 1-copy regions were analyzed. SNVs are shown in blue and indels in red; each point represents one somatic mutation. Boxplots show median (thick center line) and interquartile range (box). Whiskers are described in R boxplot documentation (a 1.5*interquartile range rule is used). Known or putative driver genes with at least 10 SNVs/indels in 2-copy regions across all B-ALL samples, or 8 SNVs/indels in 2-copy regions across all T-ALL samples, are shown. (b-d) Simultaneous targeted single-cell DNA sequencing and cell-surface protein expression analysis of three B-ALL samples using the Tapestri platform. Left shows a heatmap with each row representing one cell, and each column representing either one mutation (left side) or one protein (right side). Mutation presence is indicated by blue color, while protein level (as a percent of all protein-associated reads detected in the cell) is indicated by red color. Asterisk (*) indicates likely cell doublets or dropout artifacts, and below these likely normal cells are indicated (neither of which were included in the clonal composition determination at right). The bulk VAF of each mutation is indicated below, along with bulk CCF (if copy number was available). n.d., not detected in bulk sequencing. On the right side of each panel is shown a fish plot showing clonal composition as determined by single-cell sequencing, with x-direction indicating time and y-direction indicating relative CCF of each clone (represented by different colors) as determined by single-cell DNA sequencing. The rightmost edge shows the clonal composition at diagnosis. At bottom-right in (d), the cell-surface protein level of CD34 (percent of reads in each cell assigned to CD34), is shown in a clone with vs. without PTPN11 D61V in patient SJBALL192. P value is by two-sided Wilcoxon rank-sum test. Boxplot shows median (thick center line) and interquartile range (box). Whiskers are described in R boxplot documentation (a 1.5*interquartile range rule is used).
Figure 5.
Figure 5.. Alterations in rare ALL genes.
(a) Percent of B-ALL samples (out of 1,428 with either WGS or WES plus SNP array) with alterations in each infrequently altered gene (altered in <2% of B-ALL samples and ≥0.3% of samples). Alteration type is indicated in color; in samples with more than one type of alteration, only the alteration higher up in the key list (starting with “nonsense”) is shown. Putative driver genes not previously reported in cancer are shown in blue text. The pathway or function of each gene is indicated in boxed letters above each gene (see legend at bottom). (b) Alterations in selected genes involved in SUMOylation or ubiquitination, or the removal of these modifications. Left shows an oncoprint showing only samples with alterations in at least one of these genes, with alteration indicated by color and the percentage of samples in B-ALL or T-ALL altered at right. Bottom-left shows the percentage of each subtype with alterations in these genes, color-coded by the specific gene altered. In samples with alterations in more than one gene, only the top-most gene in the legend is shown. The value of n indicates the number of samples analyzed in each subtype. Right shows example gene alterations, including focal deletions (5 Mb or less; blue indicates degree of copy loss in each sample (row) and circles indicate SVs which were available for WGS samples only) in UHRF1 and sequence alterations in USP1. P value (asterisk) is by two-sided Fisher’s exact test comparing prevalence in the ETV6-RUNX1 subtype vs. all non-ETV6-RUNX1 B-ALL samples. (c) As in (b) but for putative driver alterations in non-coding RNA genes. P values (asterisks) are by two-sided Fisher’s exact test comparing prevalence in the indicated subtype vs. all B-ALL samples not belonging to that subtype.
Figure 6.
Figure 6.. Association of secondary genetic alterations with outcome.
(a) Heatmap showing overall survival (OS) and event-free survival (EFS) in each B-ALL subtype based on the presence of specific somatic alterations. Each row represents a specific gene somatically altered, sorted by most frequently altered in B-ALL (top) to least frequently altered (bottom). The bottom-most portion shows selected large copy gains and losses (not sorted by frequency) based on their significant association with outcome. Columns represent B-ALL subtypes, and EFS (left) and OS (right) were analyzed for each subtype. P values were first calculated by univariate two-sided log-rank test, and significant (0.05 or less) values are shown in red (if alteration was associated with worse outcome) or blue (alteration associated with improved outcome; see scale at bottom). Tan color indicates a P value that was not significant (n.s.), and gray indicates an insufficient number of somatically altered samples in the subtype for analysis (n.a.; at least 3 altered and 3 wild-type samples were required for the gene to be analyzed within the subtype; at least two samples had to have events (death, relapse, etc.) in the wild-type or altered group as well). Significant associations (P ≤ 0.05 by univariate analysis) were then subject to multivariate Cox proportional-hazards analysis (Methods) and associations with P ≤ 0.05 by this multivariate method are marked by yellow diamonds (not performed for the “all B-ALL” and “all T-ALL” analyses). The number of samples analyzed in each subtype is indicated at bottom and includes samples with SNV/indel and copy data (WGS, or WES plus SNP copy array) and available outcome information. All B-ALL samples, regardless of subtype, were also analyzed in the rightmost heatmap column. (b) Heatmap showing OS and EFS in each T-ALL subtype based on somatic alterations, similar to panel (a) but for T-ALL. (c-f) Kaplan-Meier OS or EFS curves showing selected genetic alterations with significant outcome associations within indicated subtypes. P values are by multivariate Cox proportional-hazards analysis.
Figure 7.
Figure 7.. Dichotomous CEBPA and NFATC4 expression identifies subgroups of KMT2A-and DUX4-rearranged subtypes.
(a) tSNE analysis of B-ALL transcriptional profiles including 1,464 B-ALL samples sequenced by RNA-seq. Each point represents one sample. Legend shows the samples colored by subtype, and dotted lines delineate visually apparent subgroups further subdividing the KMT2A and DUX4 subtypes. Zoomed-in regions showing DUX4-a vs. DUX4-b and KMT2A-a vs. KMT2A-b subgroups are shown. (b) Heatmaps showing mutations present in DUX4-a vs. DUX4-b (top), or KMT2A-a vs. KMT2A-b (bottom) subgroups. Each row indicates a gene somatically altered in the subtype, sorted by most frequently (top) to least frequently (bottom) altered within the DUX4 or KMT2A subtype. Each column is one sample. Right indicates the percentage of samples with somatic alterations in each gene in the a vs. b subgroups, with significant P values by two-sided Fisher’s exact test (a vs. b subgroups) shown with asterisks. Exact P values are 9.3 x 10⁻⁵ (ERG), 0.014 (NRAS), 0.032 (IKZF1), 0.0045 (KMT2D), 8.3 x 10⁻⁵ (TBL1XR1), and 1.8 x 10⁻⁴ (PAX5). Variant types are indicated by color as shown in the key at right in the DUX4 plot. This analysis includes samples that had RNA-seq, SNV/indel, and copy number characterisation (RNA-seq plus WGS, or RNA-seq plus WES plus SNP array), with sample numbers indicated above each plot. (c) Kaplan-Meier curves showing event-free (left) or overall survival comparing DUX4-a and DUX4-b subgroups. P values are by two-sided log-rank test. (d) tSNE plots as in (a), including 1,464 B-ALL samples, except that the expression of CEBPA (top) or NFATC4 (bottom) are indicated by color, with red indicating high expression and blue/gray indicating lower expression (see scale). (e) Left, differential gene expression with Limma, comparing the DUX4-a (n=36 samples) and DUX4-b (n=43) subgroups, defined as shown in (a). X-axis represents the log2 fold change in gene expression comparing DUX4-b minus DUX4-a, where values above zero indicate an increase in DUX4-b and below zero indicate an increase in DUX4-a. Y-axis represents the −1*log10 (adjusted P value) for each gene (represented as points). The top differentially expressed genes are shown in red (increased in DUX4-b) or blue (increased in DUX4-a), and selected genes are highlighted. Right, differential gene expression comparing KMT2A-a (n=17) vs. KMT2A-b (n=45).

References

Main References

    1. Iacobucci I, Kimura S & Mullighan CG Biologic and Therapeutic Implications of Genomic Alterations in Acute Lymphoblastic Leukemia. J Clin Med 10, 3792 (2021). - PMC - PubMed
    1. Roberts KG & Mullighan CG The Biology of B-Progenitor Acute Lymphoblastic Leukemia. Cold Spring Harb Perspect Med 10(2020). - PMC - PubMed
    1. Den Boer ML et al. A subtype of childhood acute lymphoblastic leukaemia with poor treatment outcome: a genome-wide classification study. Lancet Oncol 10, 125–34 (2009). - PMC - PubMed
    1. Mullighan CG et al. Deletion of IKZF1 and prognosis in acute lymphoblastic leukemia. N Engl J Med 360, 470–80 (2009). - PMC - PubMed
    1. Roberts KG Why and how to treat Ph-like ALL? Best Pract Res Clin Haematol 31, 351–356 (2018). - PubMed

Methods References

    1. Pui CH et al. Treating childhood acute lymphoblastic leukemia without cranial irradiation. N Engl J Med 360, 2730–41 (2009). - PMC - PubMed
    1. Jeha S et al. Improved CNS Control of Childhood Acute Lymphoblastic Leukemia Without Cranial Irradiation: St Jude Total Therapy Study 16. J Clin Oncol 37, 3377–3391 (2019). - PMC - PubMed
    1. Bowman WP et al. Augmented therapy improves outcome for pediatric high risk acute lymphocytic leukemia: results of Children’s Oncology Group trial P9906. Pediatr Blood Cancer 57, 569–77 (2011). - PMC - PubMed
    1. Larsen EC et al. Dexamethasone and High-Dose Methotrexate Improve Outcome for Children and Young Adults With High-Risk B-Acute Lymphoblastic Leukemia: A Report From Children’s Oncology Group Study AALL0232. J Clin Oncol 34, 2380–8 (2016). - PMC - PubMed
    1. Salzer WL et al. Impact of Intrathecal Triple Therapy Versus Intrathecal Methotrexate on Disease-Free Survival for High-Risk B-Lymphoblastic Leukemia: Children’s Oncology Group Study AALL1131. J Clin Oncol 38, 2628–2638 (2020). - PMC - PubMed

Publication types