. 2022 Oct;54(10):1572-1580.
doi: 10.1038/s41588-022-01167-z. Epub 2022 Sep 1.

Polygenic enrichment distinguishes disease associations of individual cells in single-cell RNA-seq data

Affiliations

Polygenic enrichment distinguishes disease associations of individual cells in single-cell RNA-seq data

Martin Jinye Zhang et al. Nat Genet. 2022 Oct.

Abstract

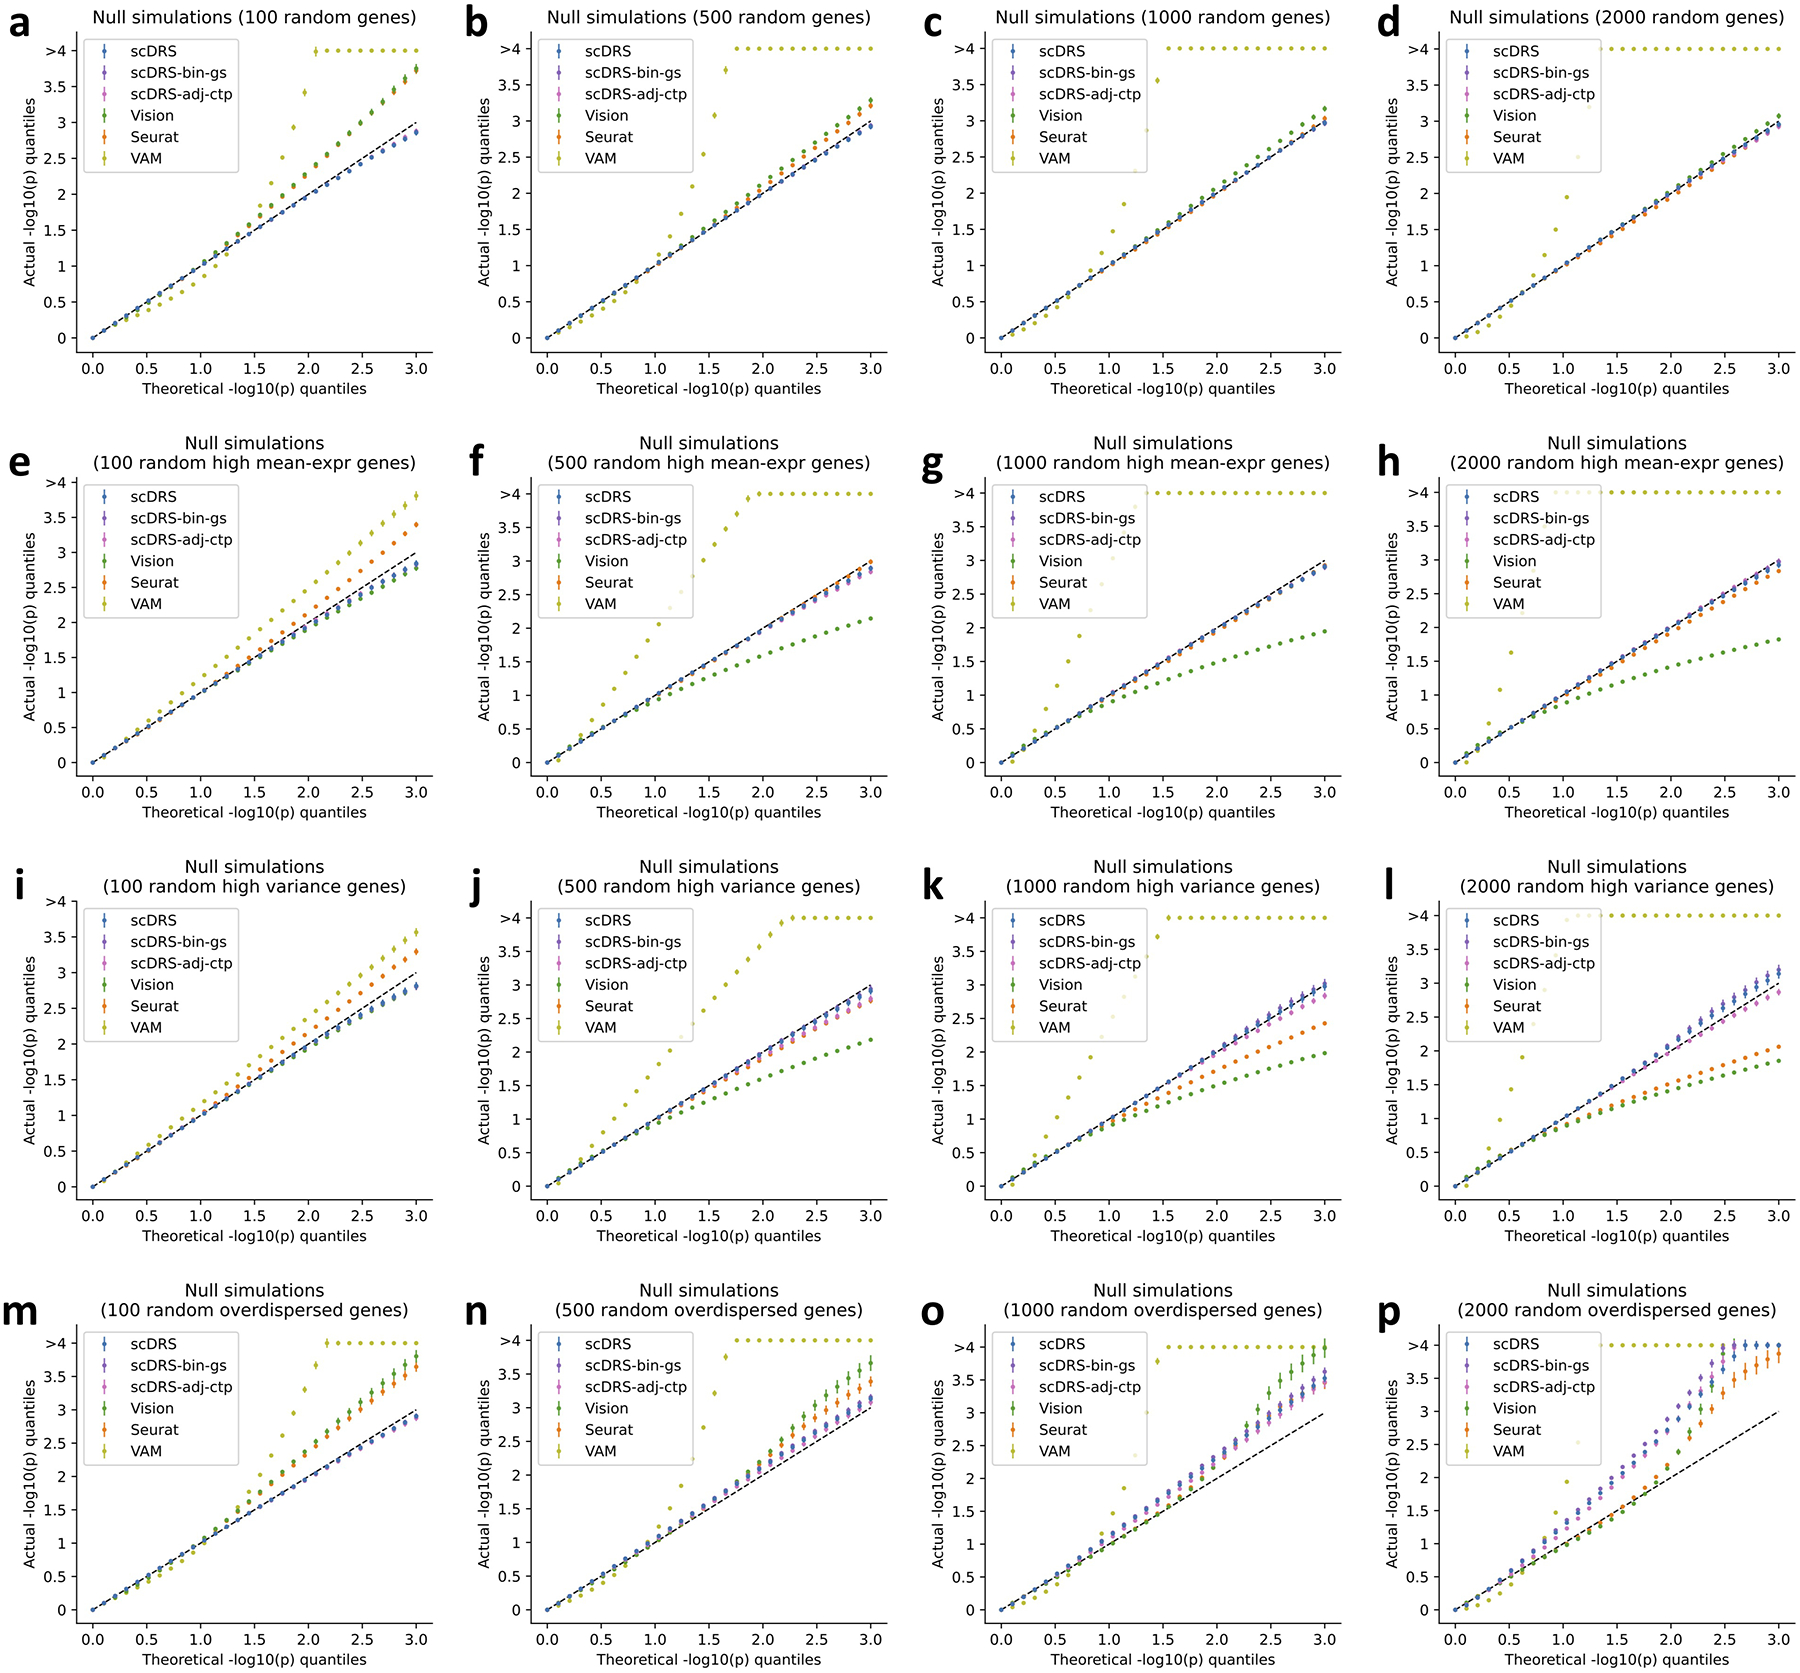
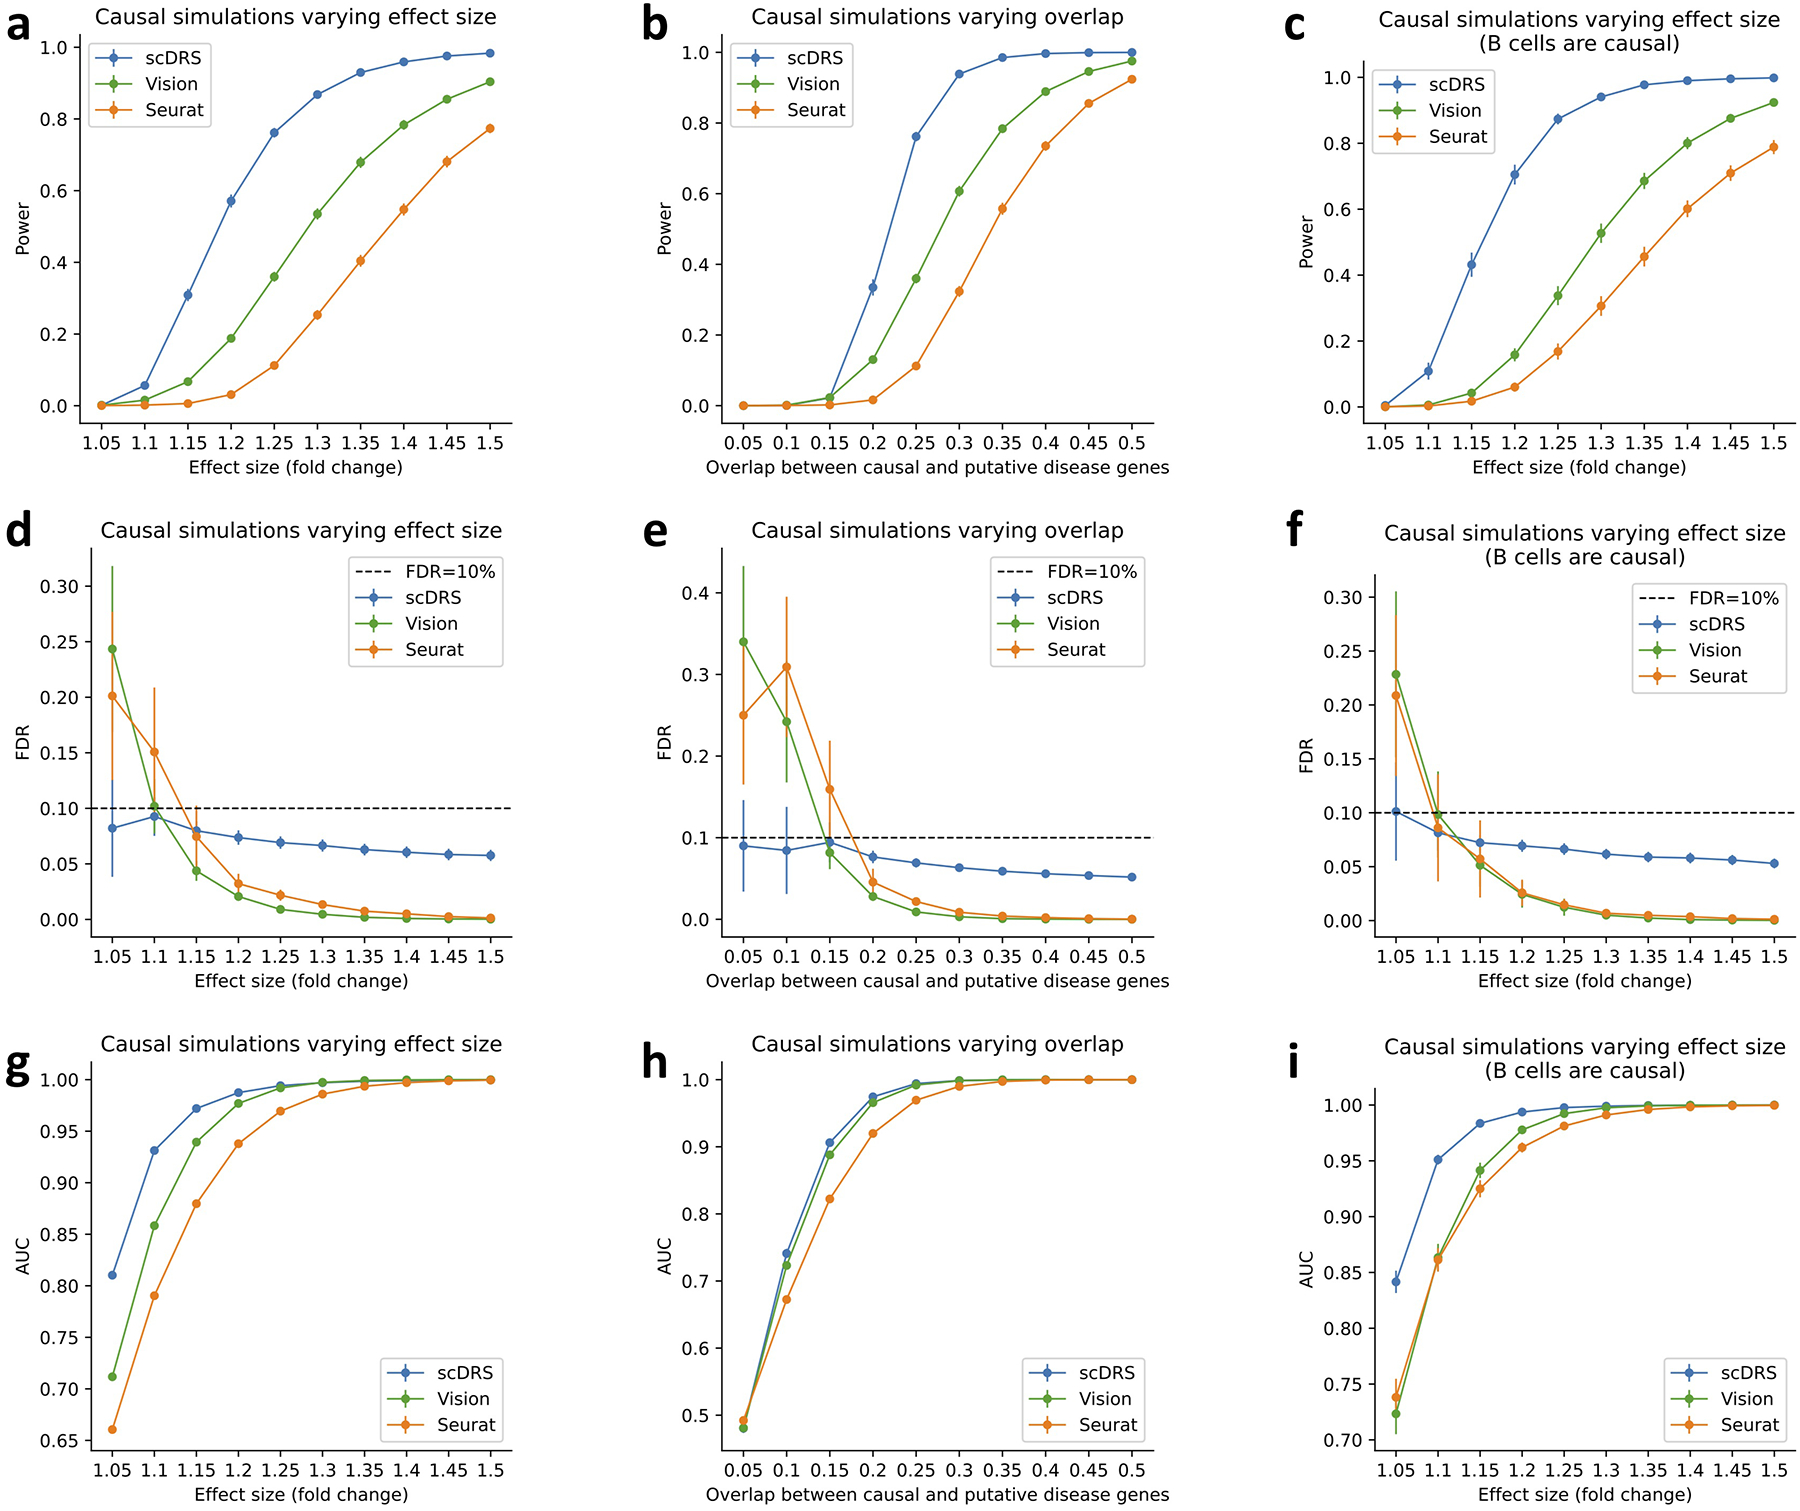
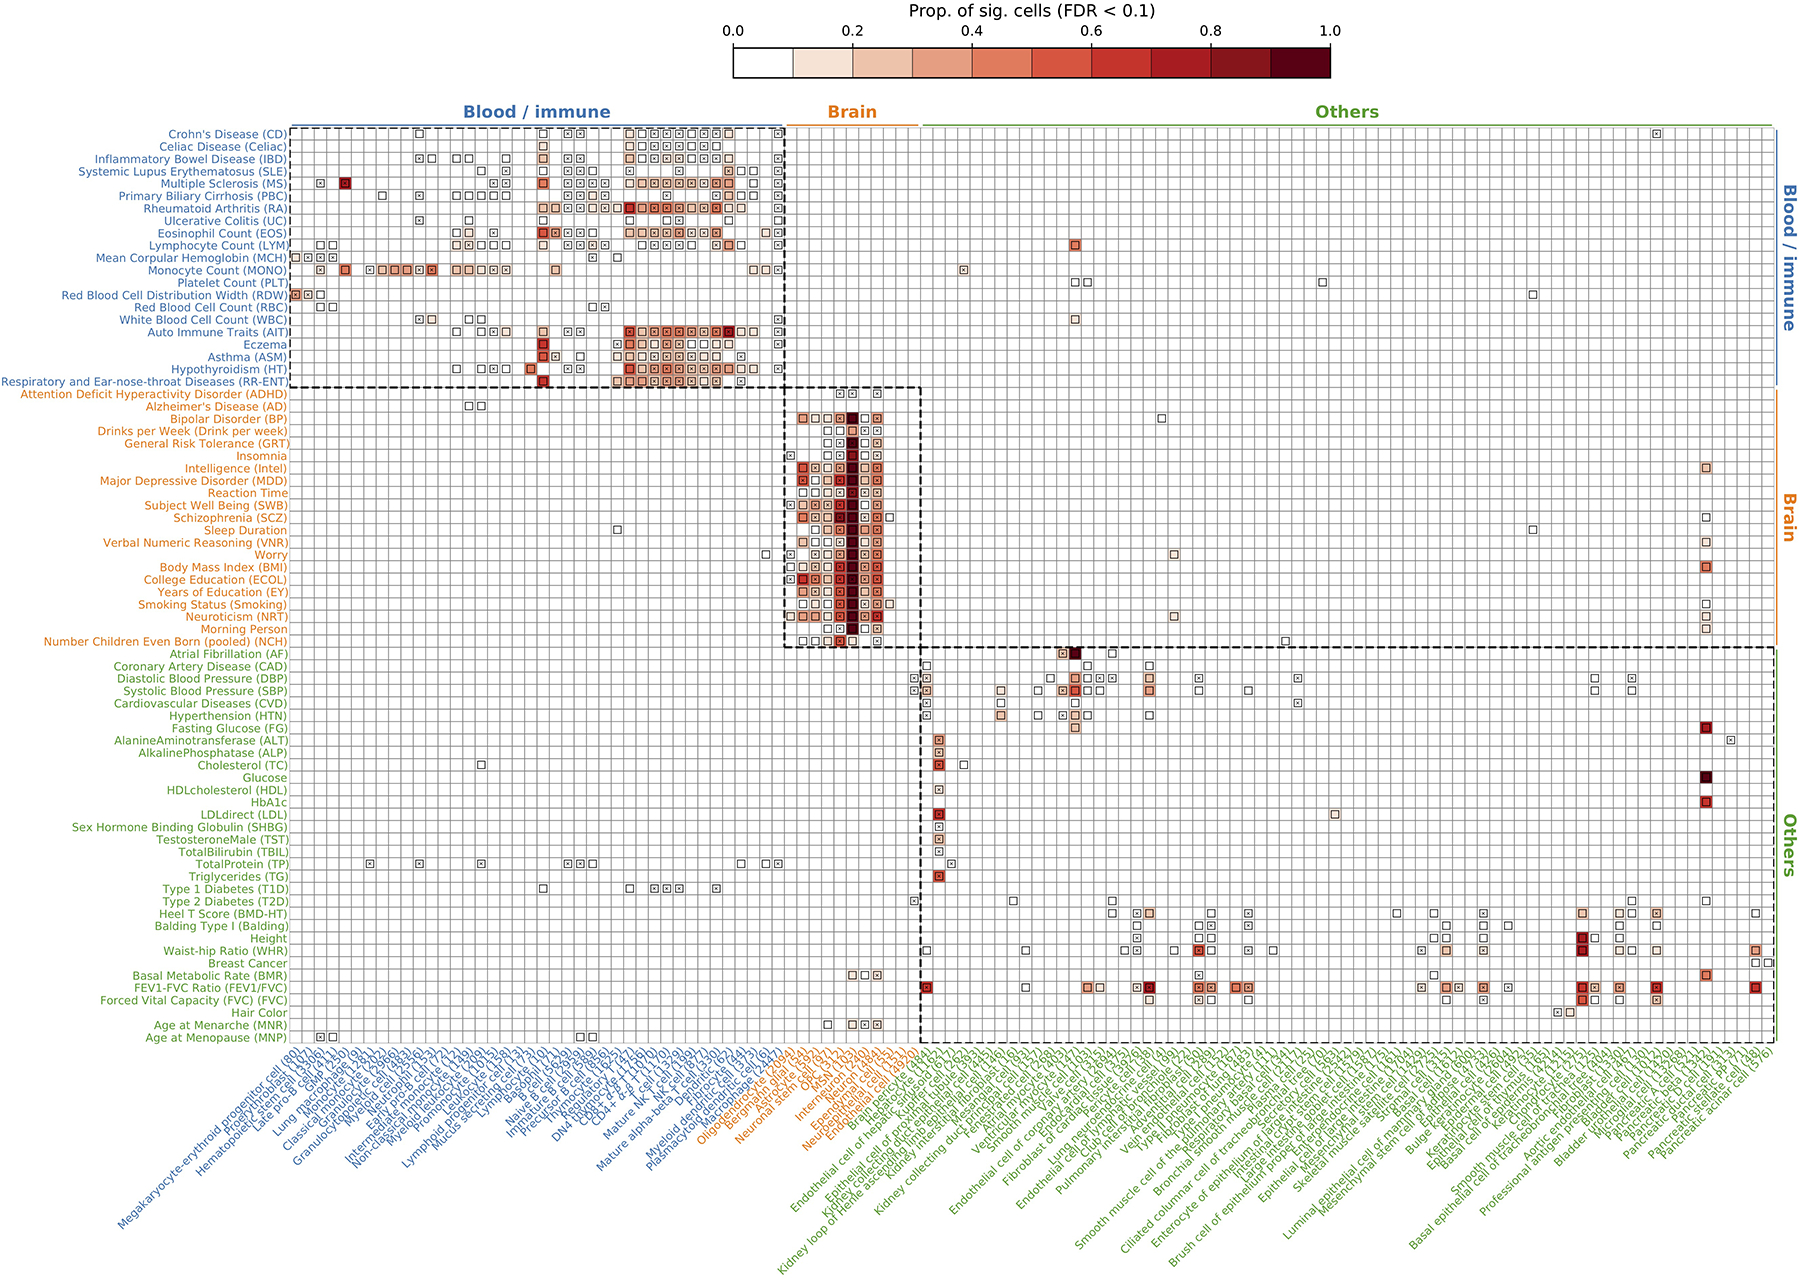
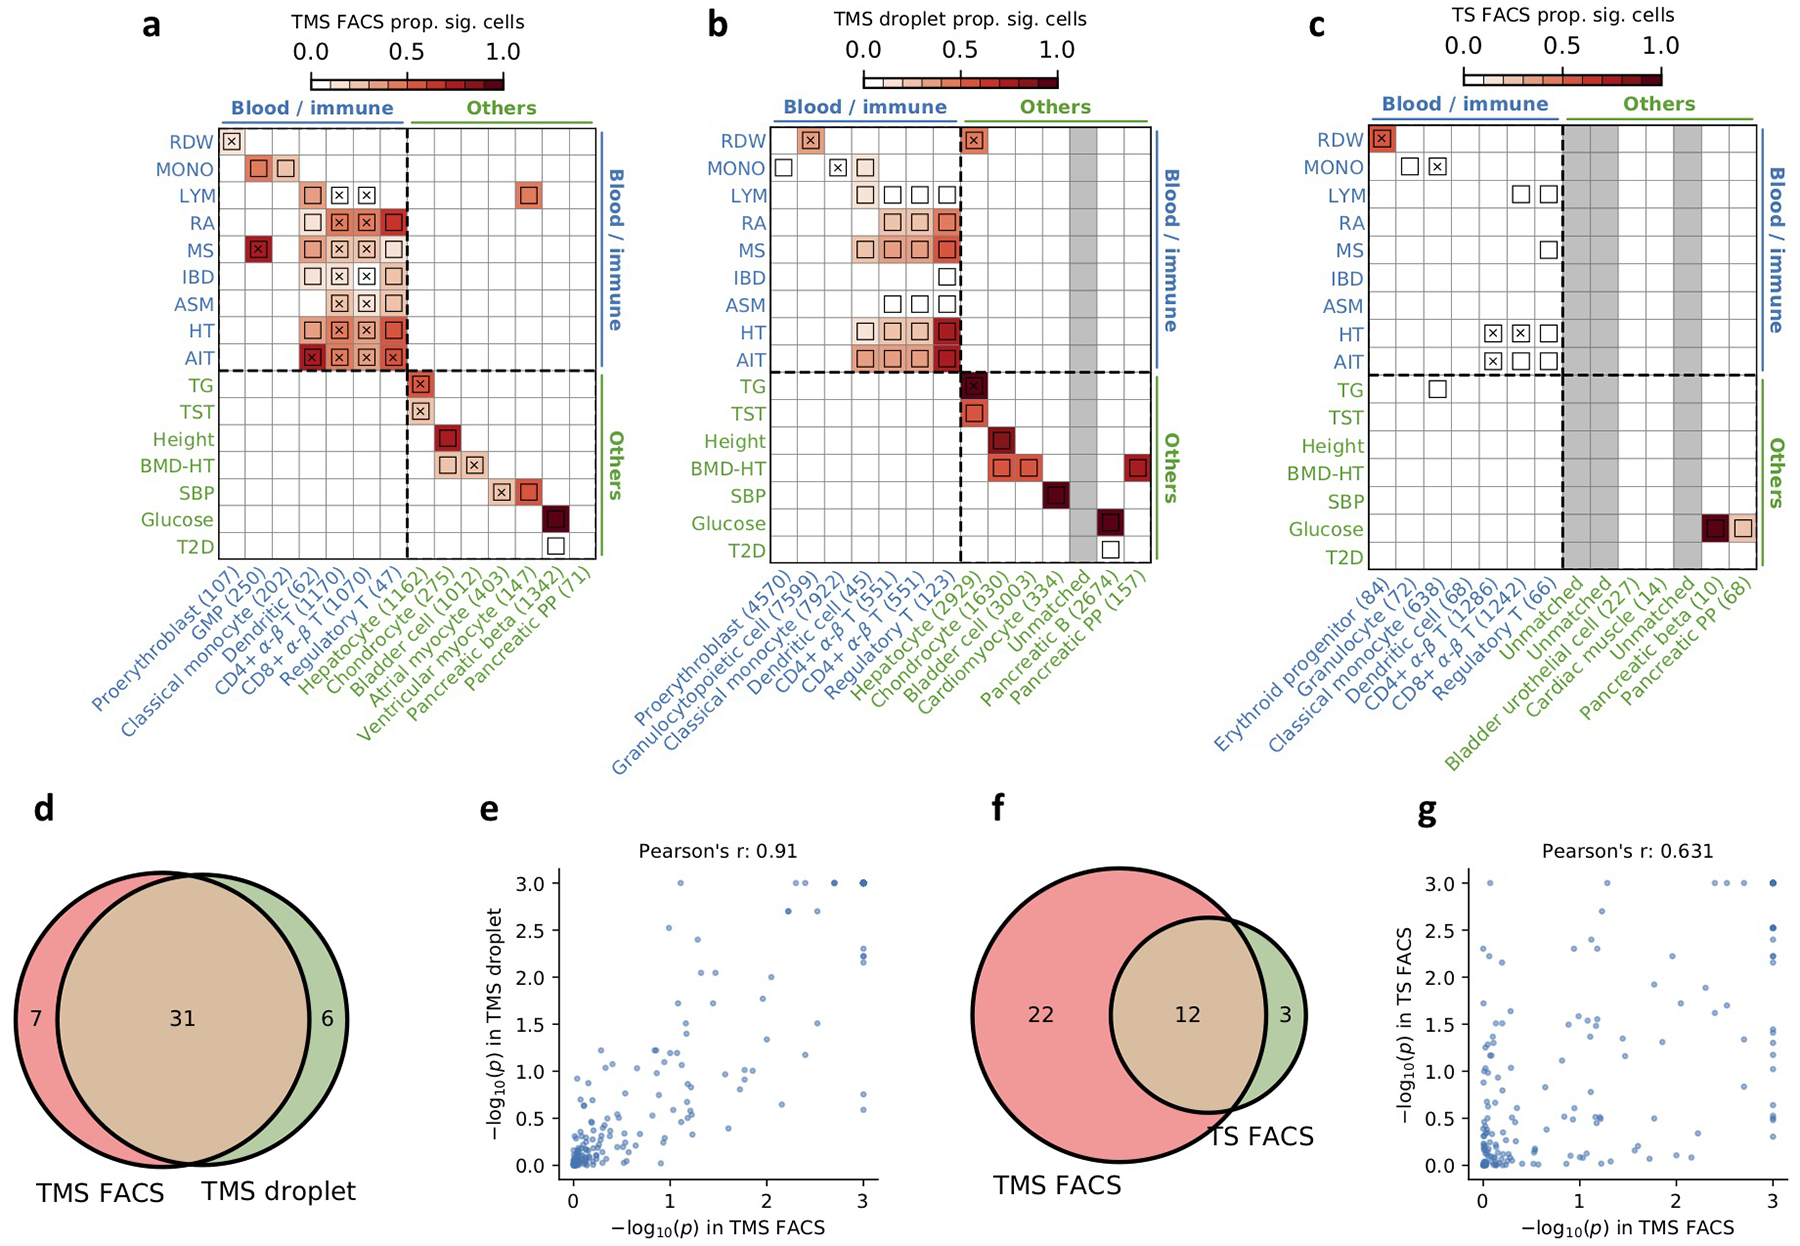
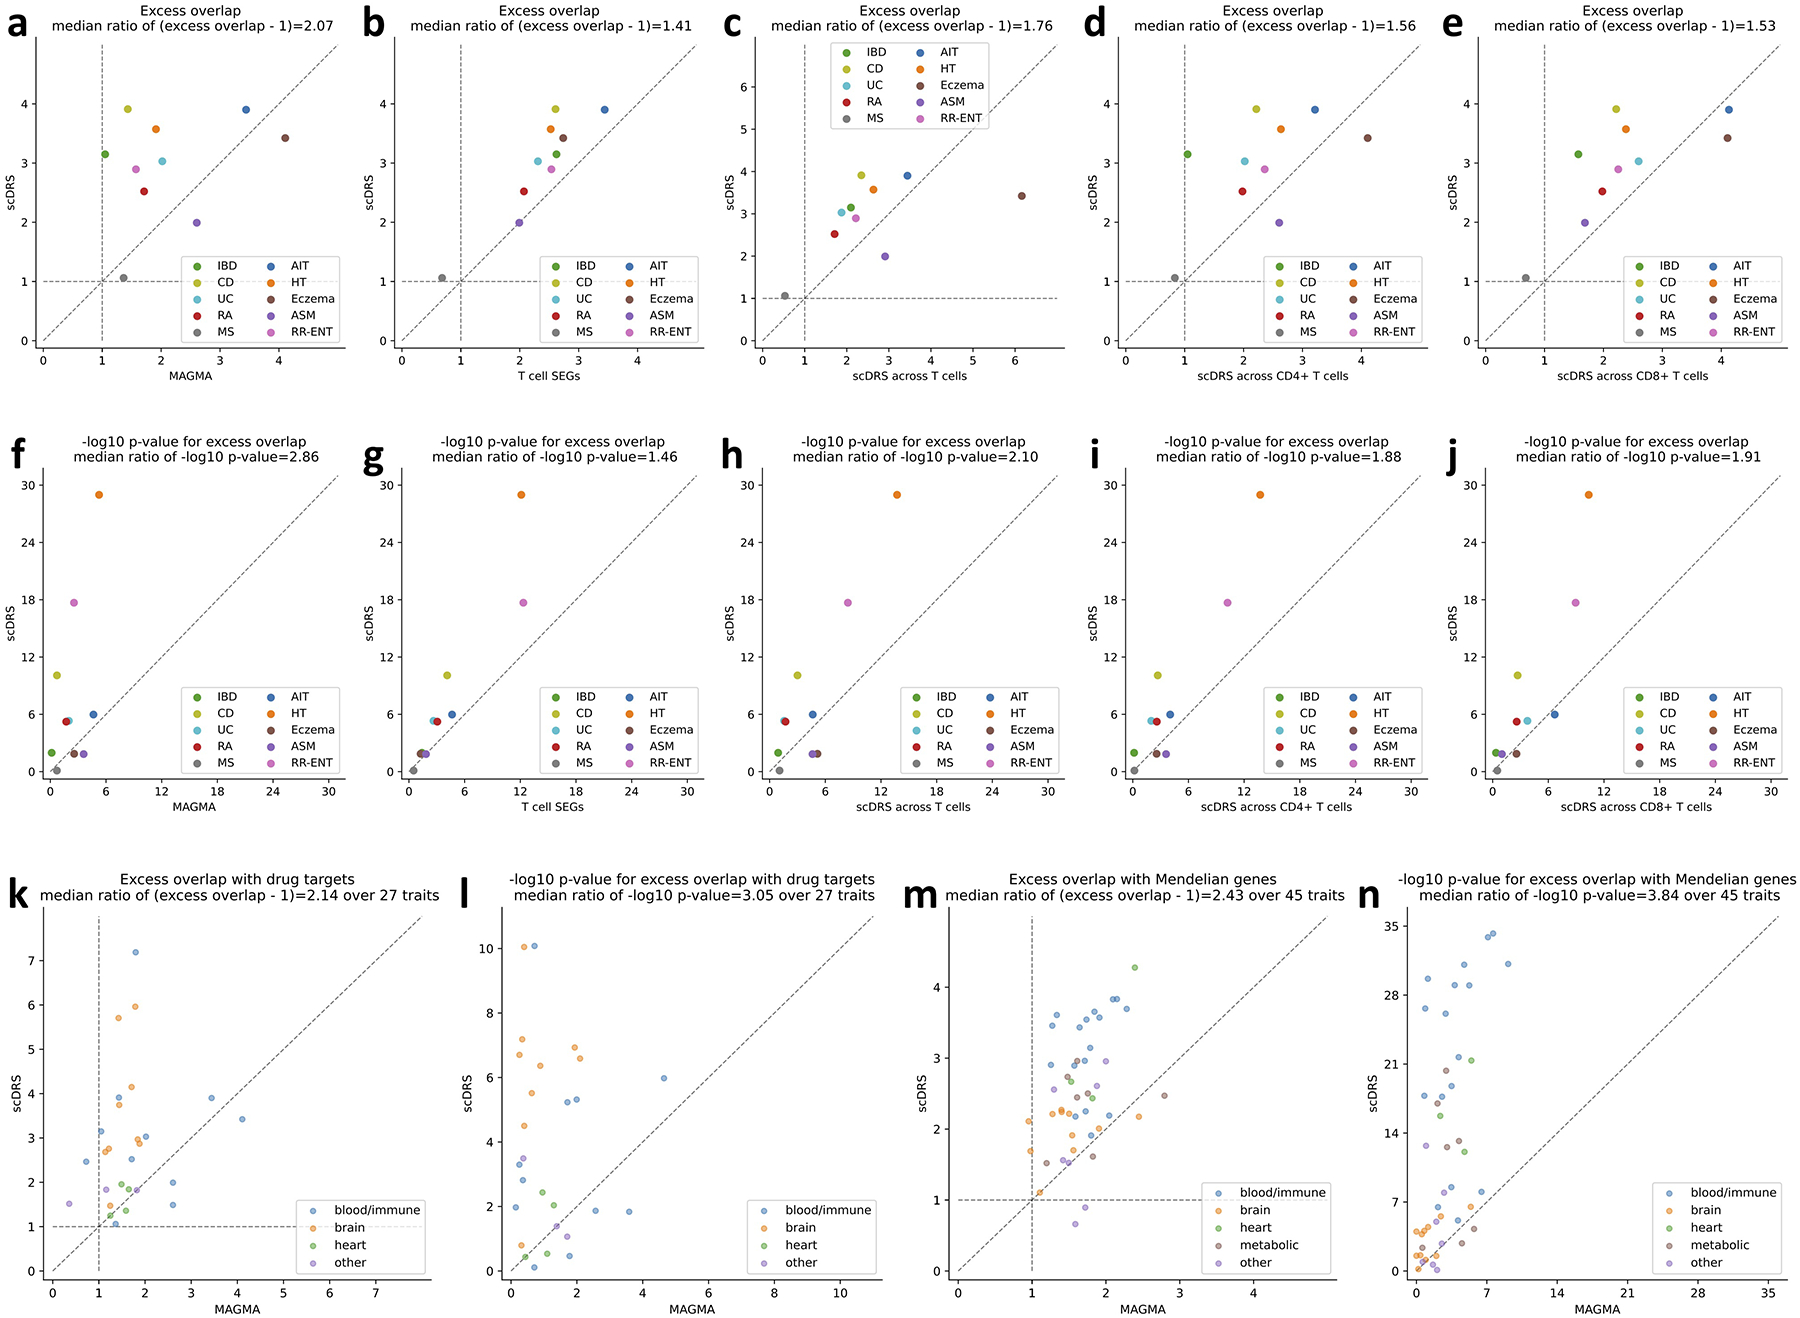
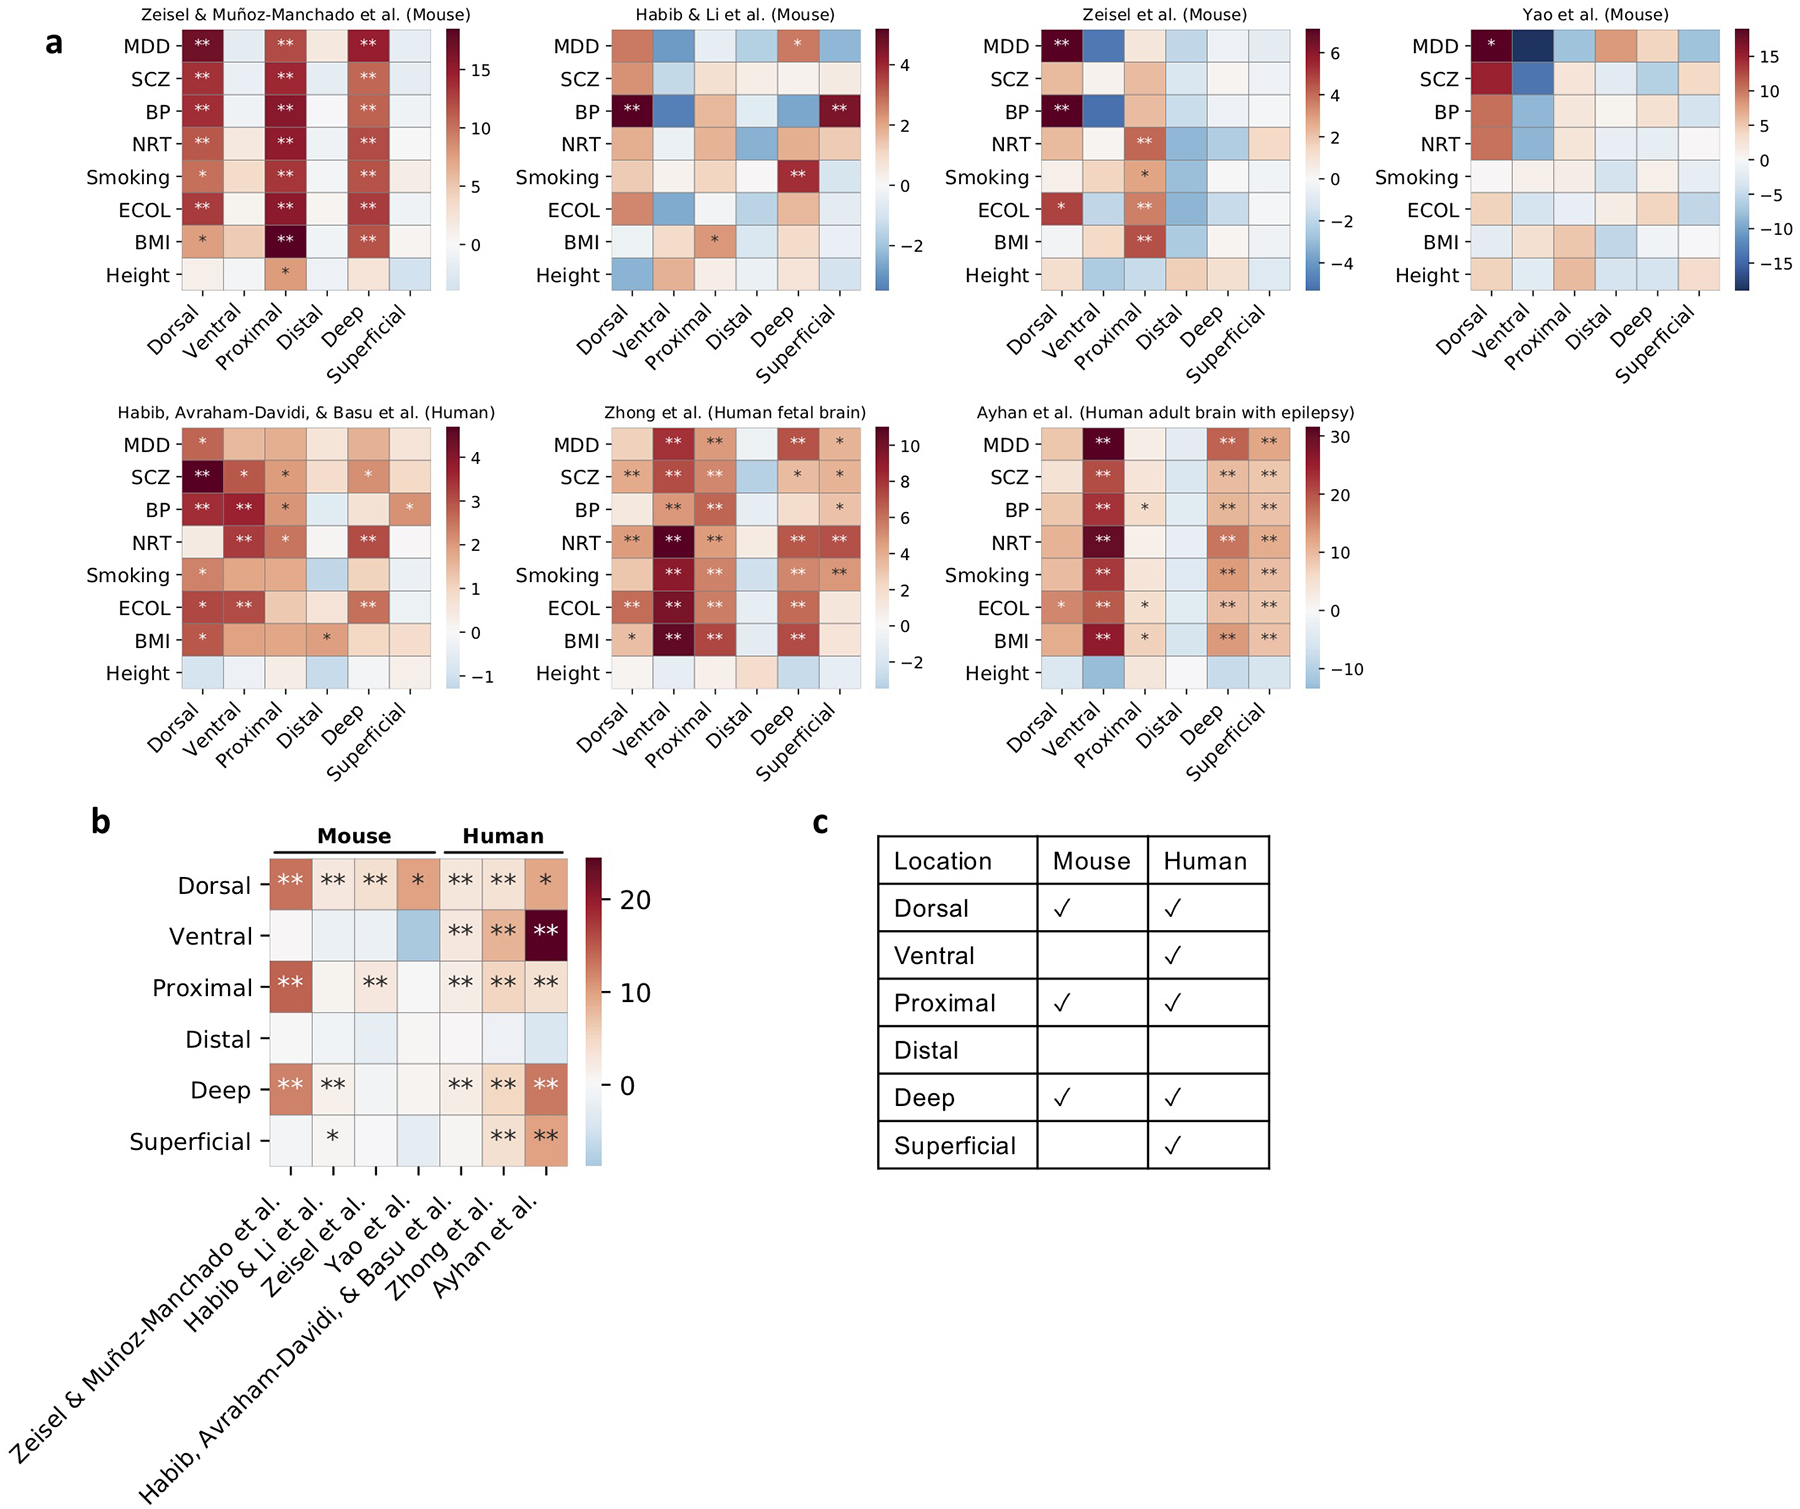
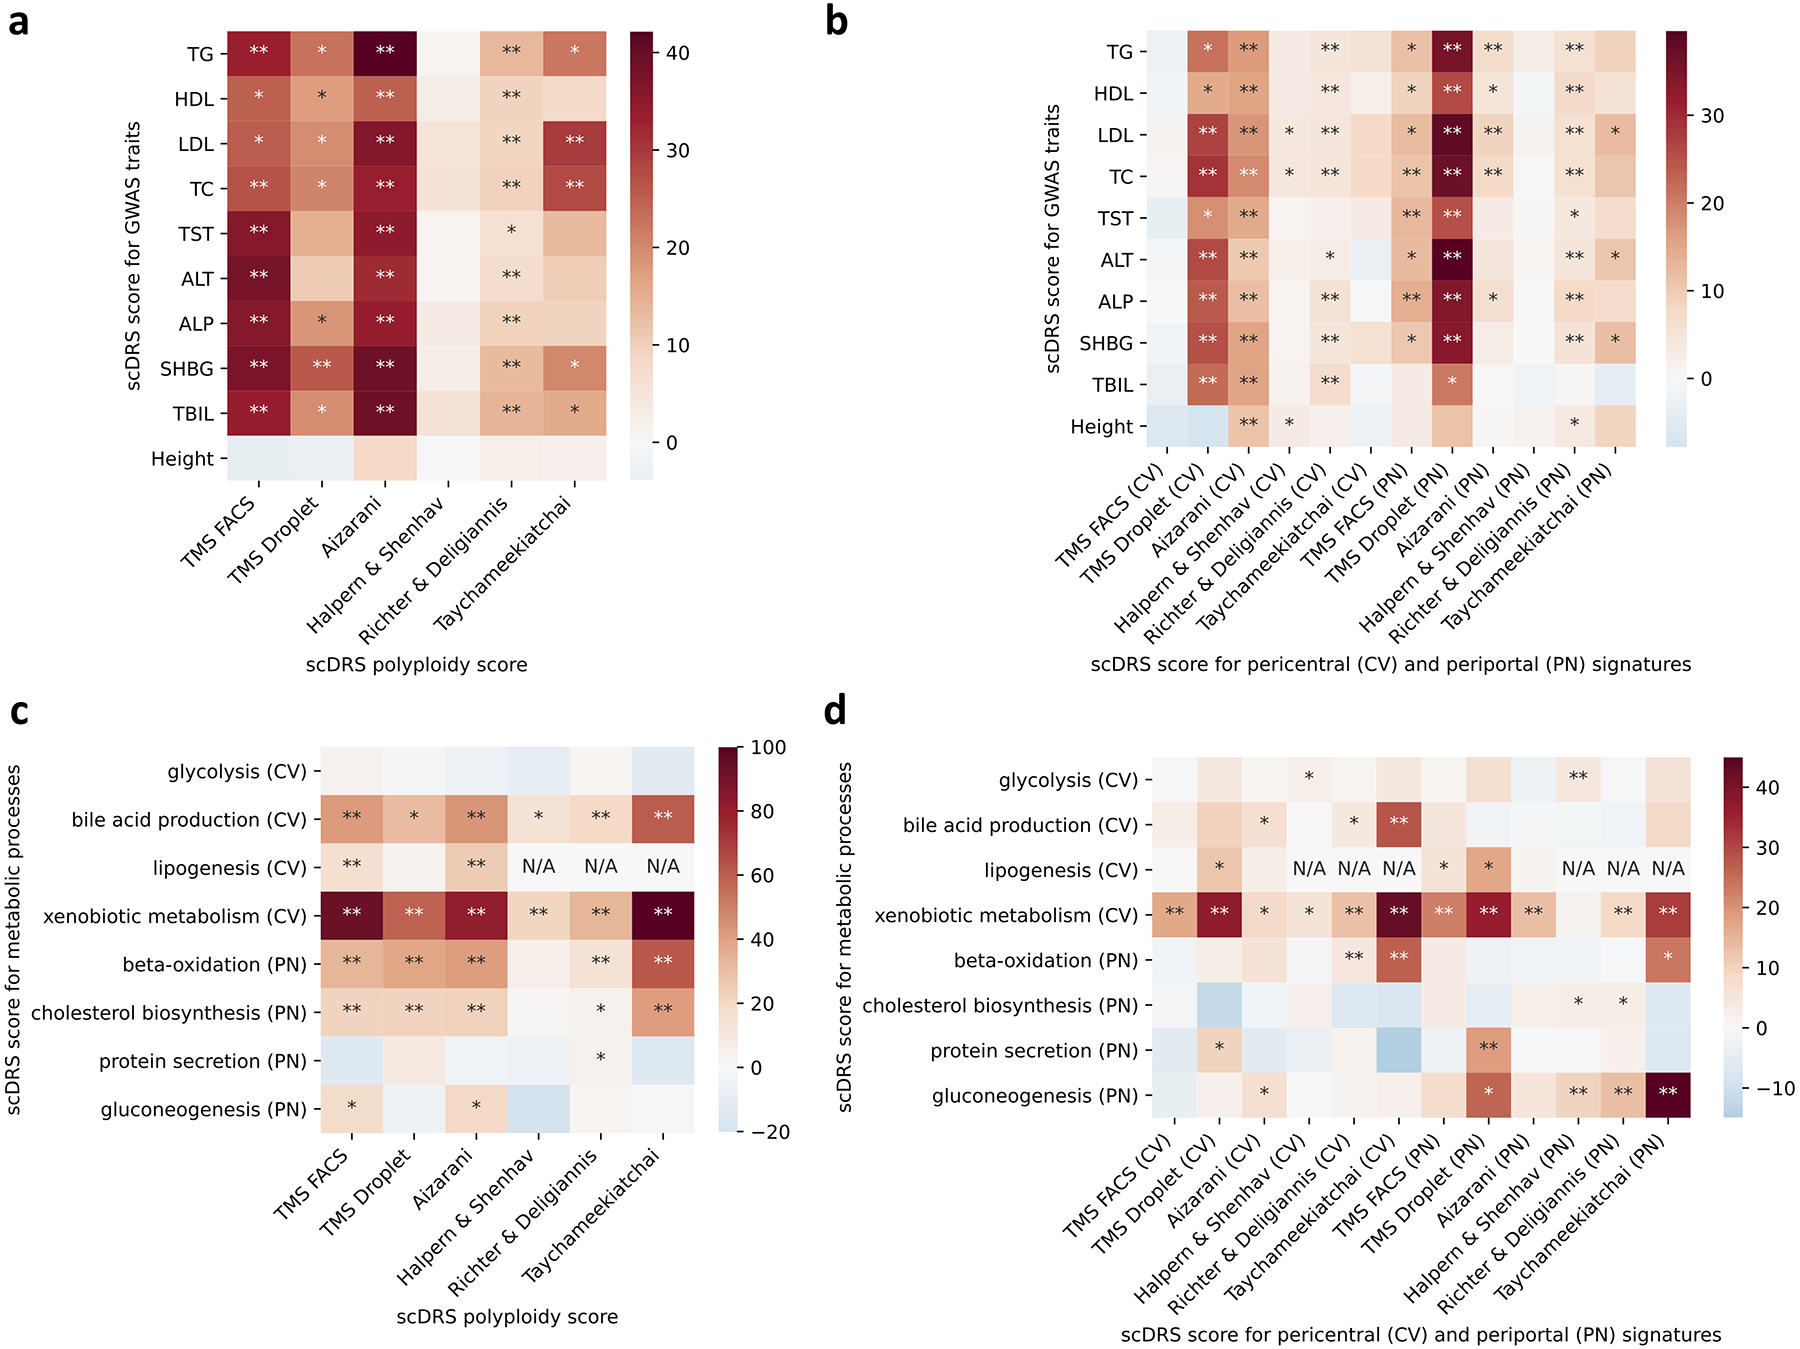
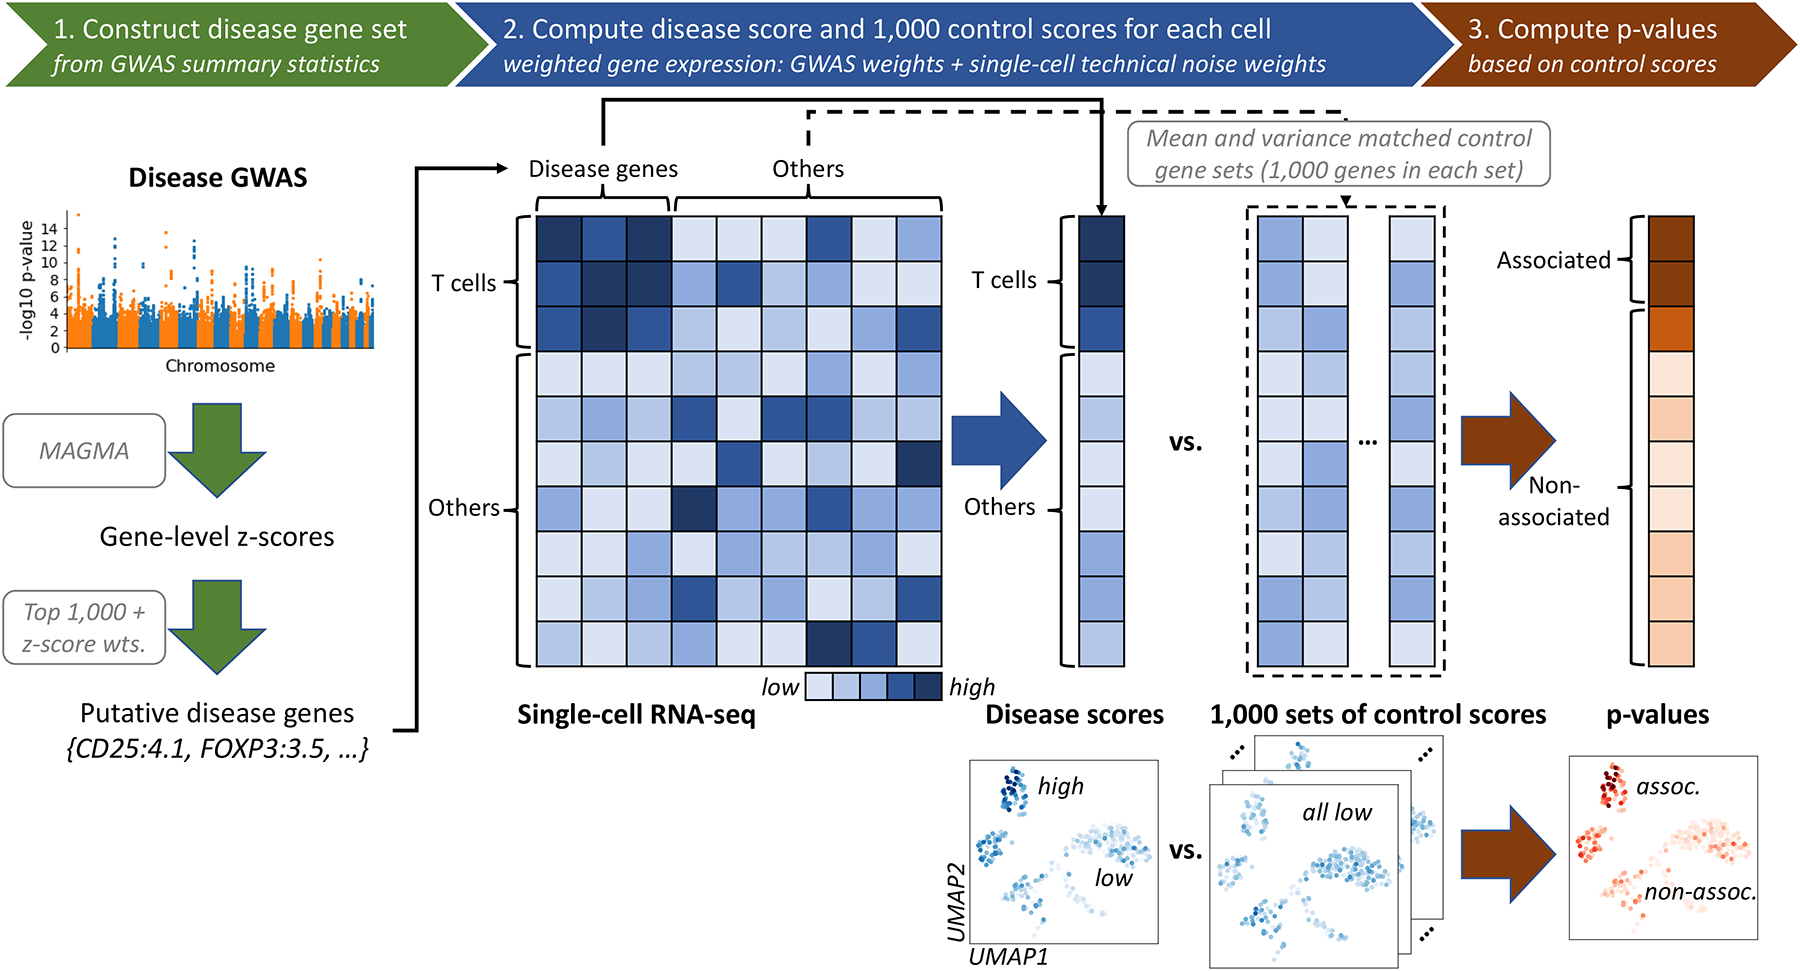
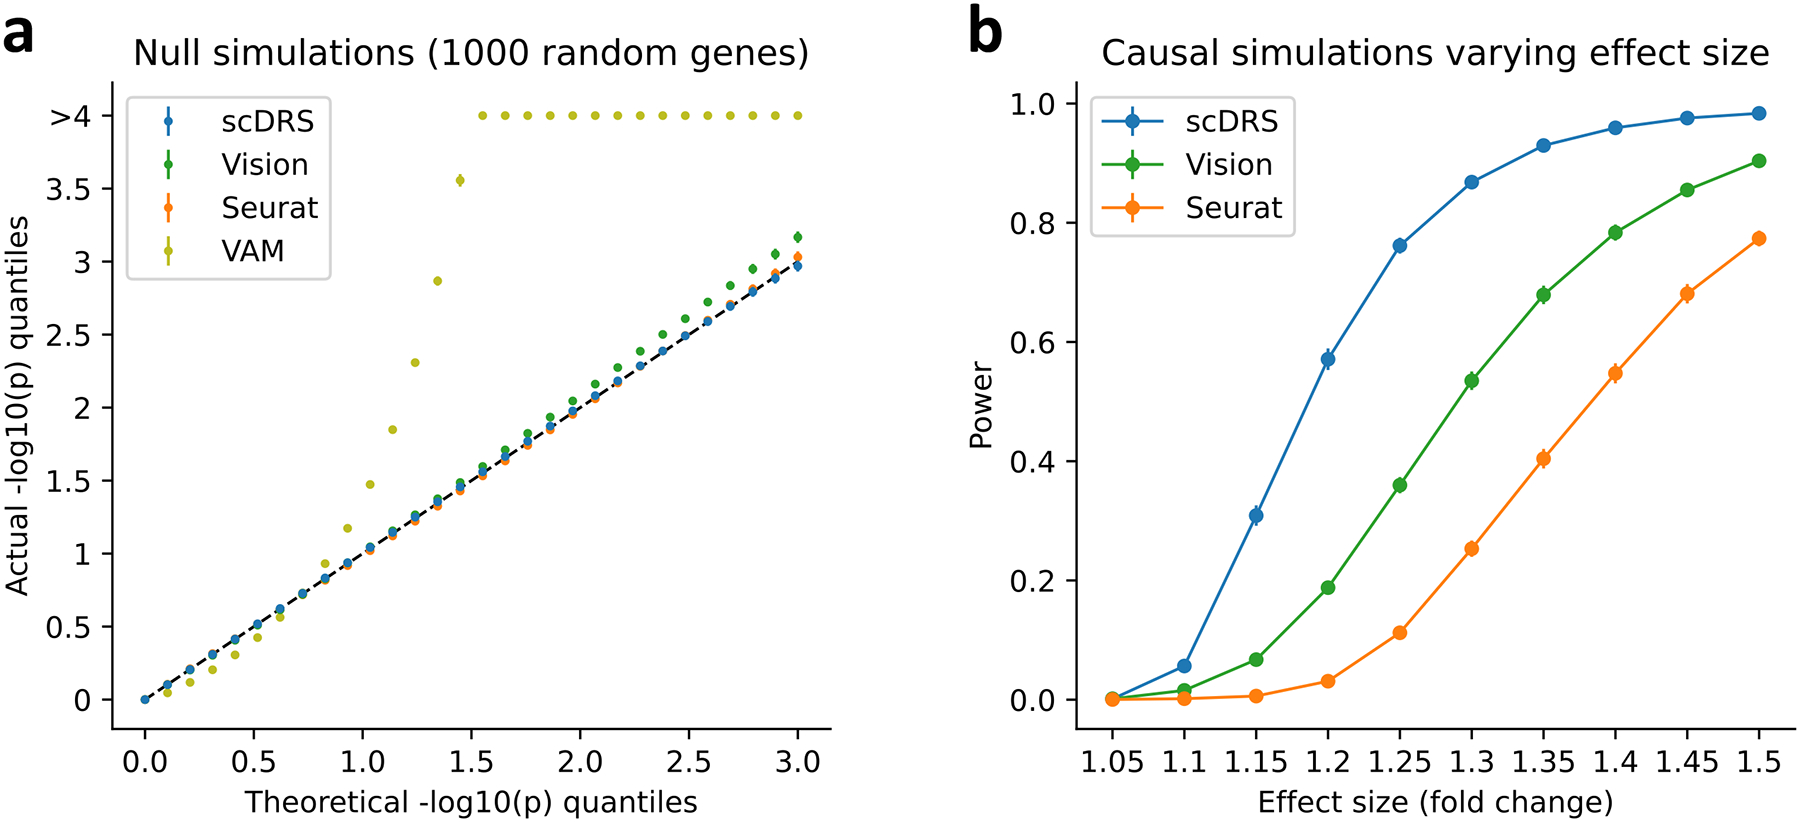
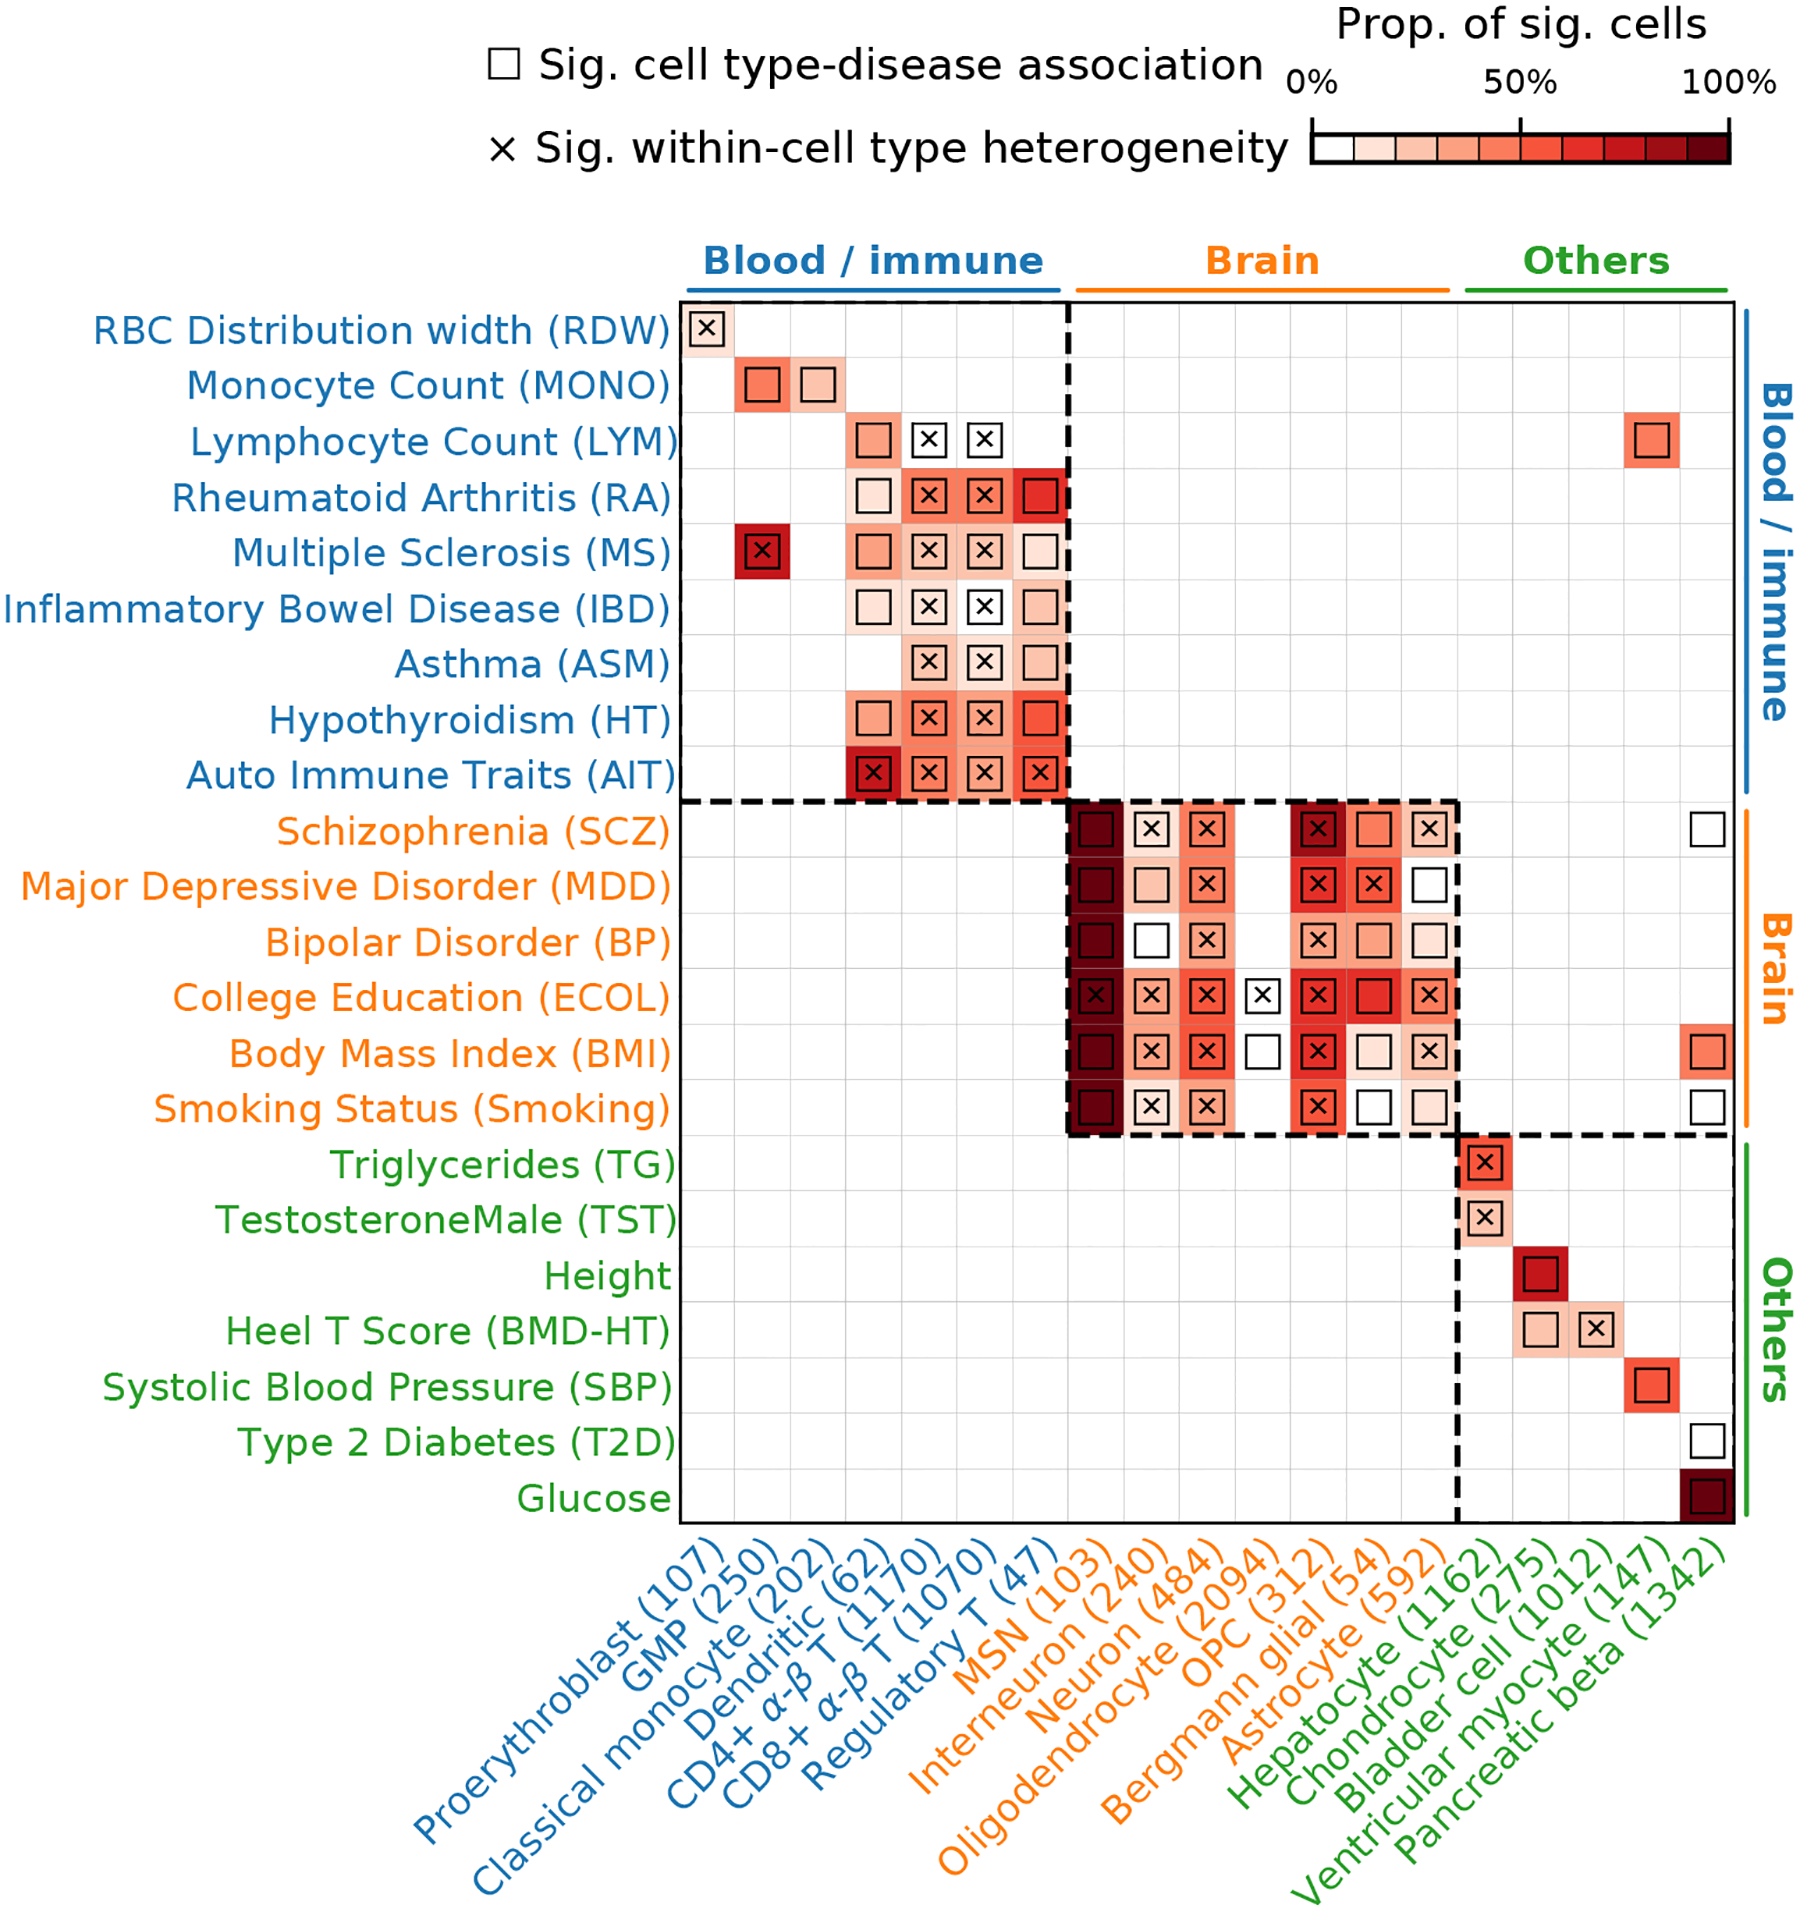
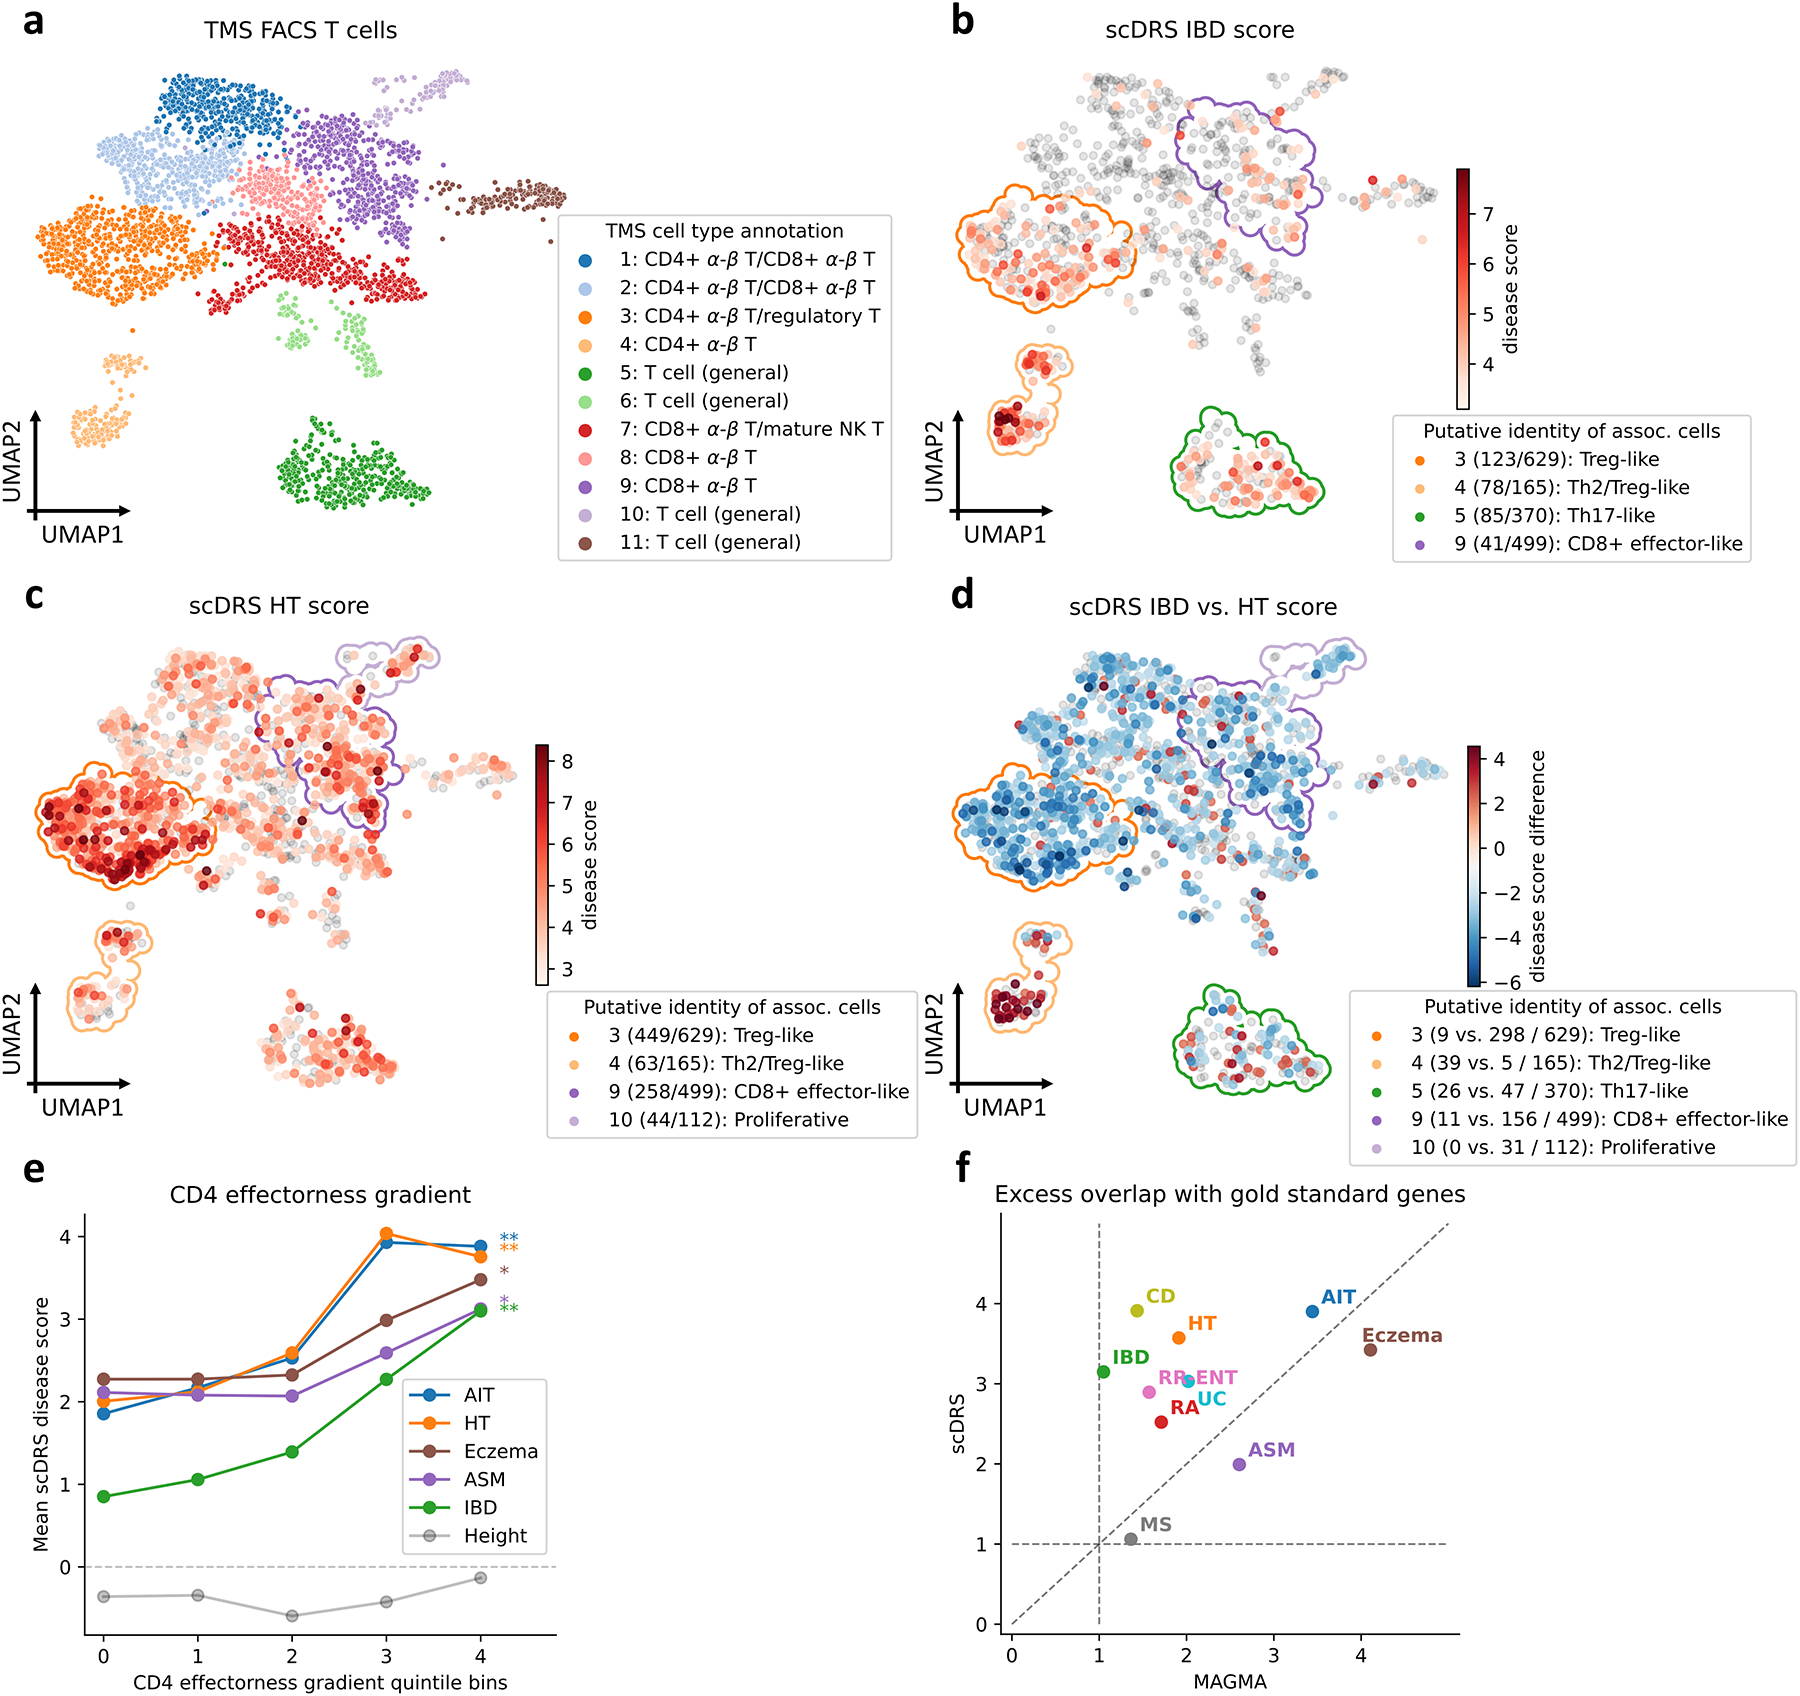
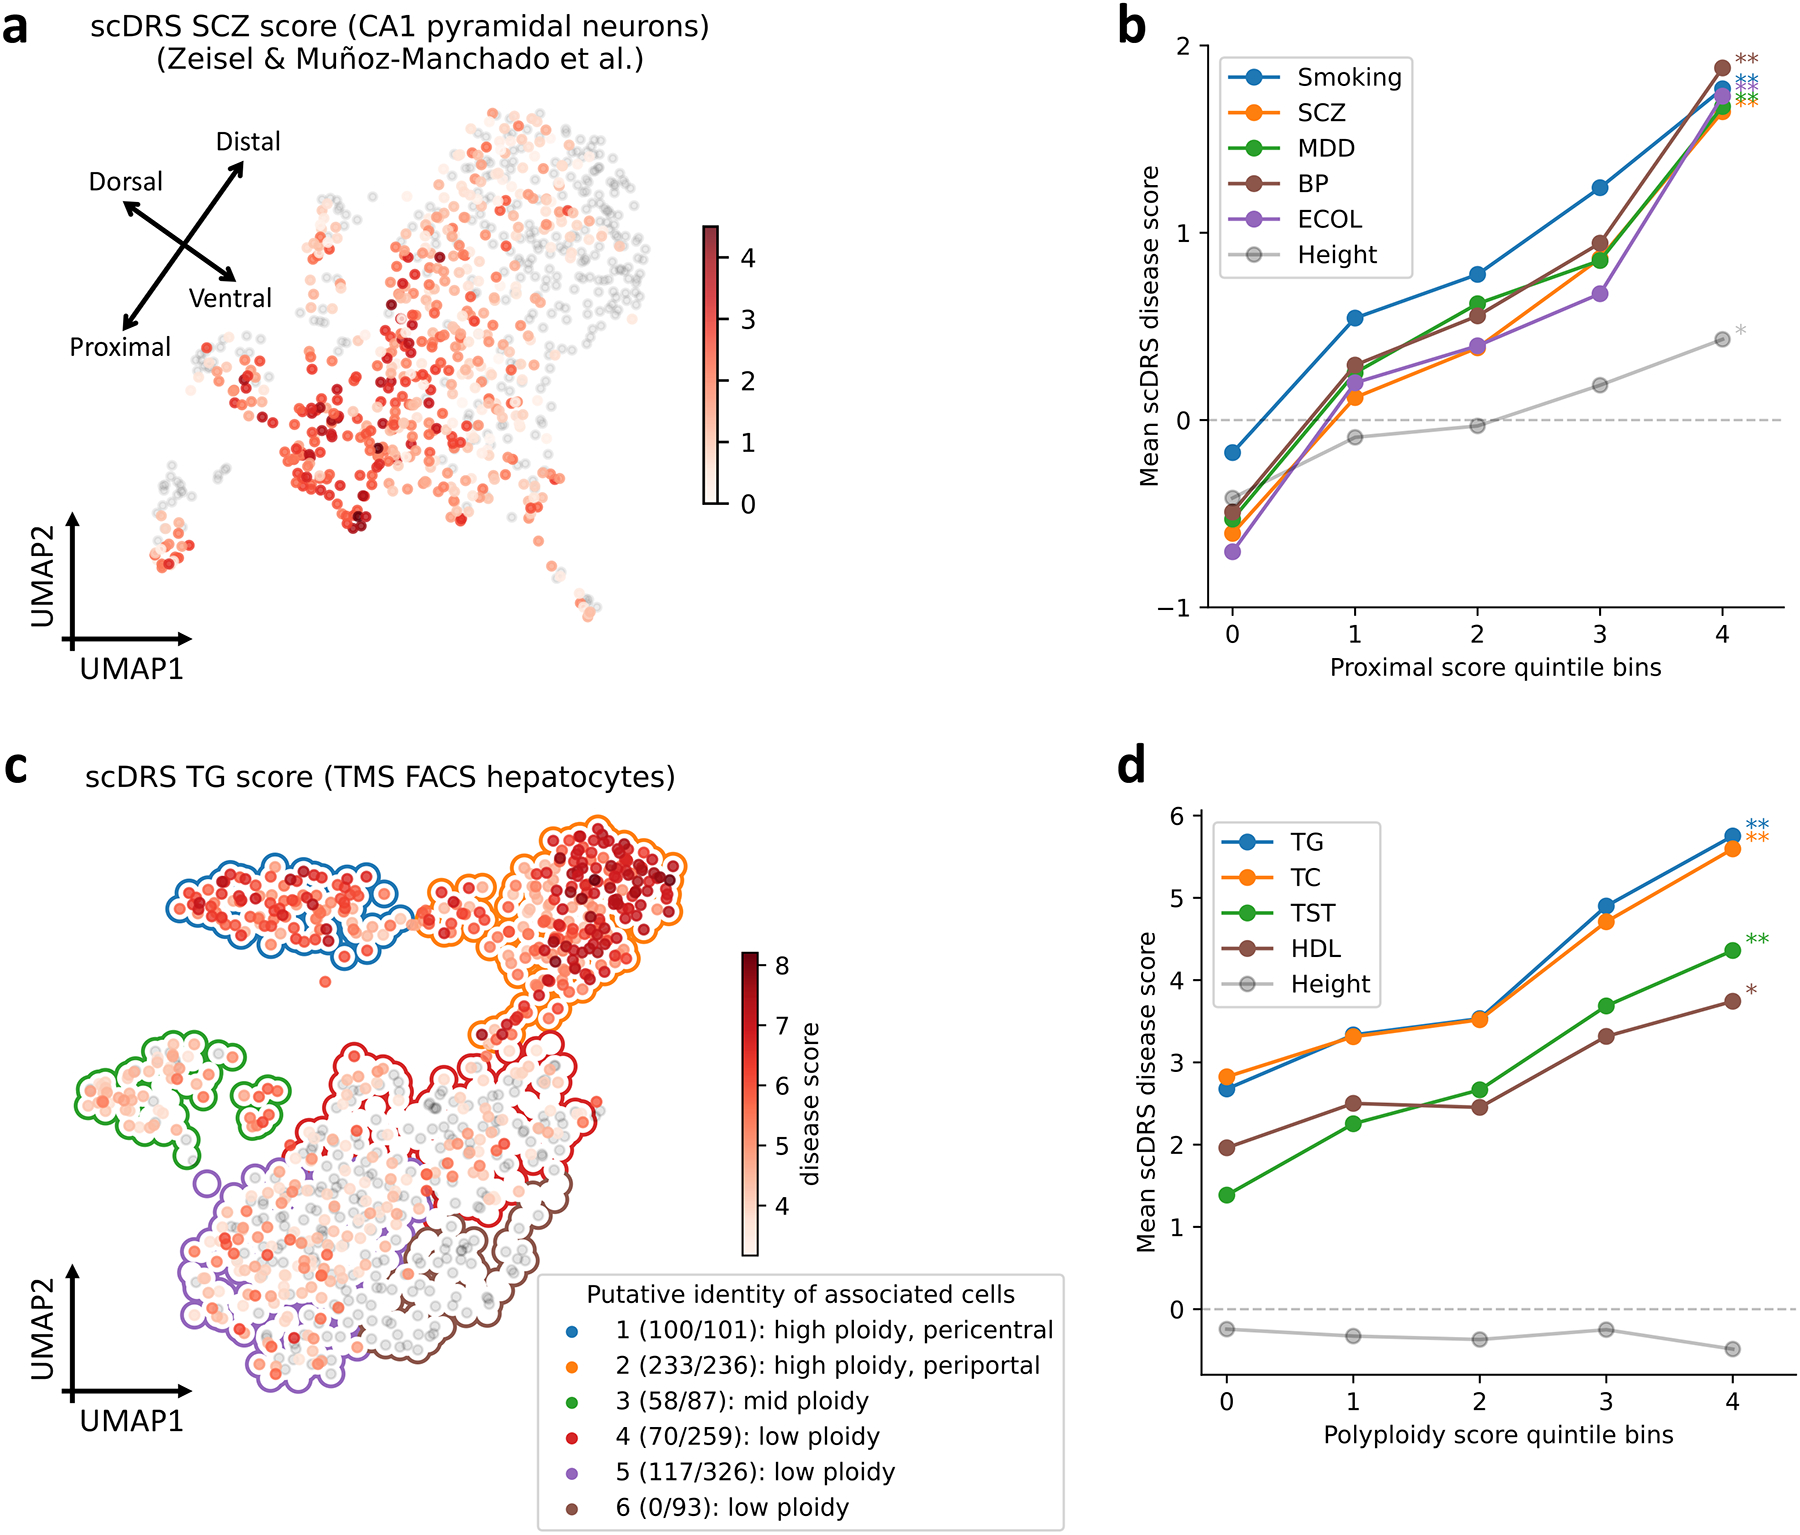
Single-cell RNA sequencing (scRNA-seq) provides unique insights into the pathology and cellular origin of disease. We introduce single-cell disease relevance score (scDRS), an approach that links scRNA-seq with polygenic disease risk at single-cell resolution, independent of annotated cell types. scDRS identifies cells exhibiting excess expression across disease-associated genes implicated by genome-wide association studies (GWASs). We applied scDRS to 74 diseases/traits and 1.3 million single-cell gene-expression profiles across 31 tissues/organs. Cell-type-level results broadly recapitulated known cell-type-disease associations. Individual-cell-level results identified subpopulations of disease-associated cells not captured by existing cell-type labels, including T cell subpopulations associated with inflammatory bowel disease, partially characterized by their effector-like states; neuron subpopulations associated with schizophrenia, partially characterized by their spatial locations; and hepatocyte subpopulations associated with triglyceride levels, partially characterized by their higher ploidy levels. Genes whose expression was correlated with the scDRS score across cells (reflecting coexpression with GWAS disease-associated genes) were strongly enriched for gold-standard drug target and Mendelian disease genes.


Conflict of interest statement

Competing Interests Statement

The authors declare no competing interests.

Figures

Extended Data Fig. 1
Extended Data Fig. 1. Additional null simulations.
We performed null simulations for various numbers of putative disease genes (100, 500, 1,000, and 2,000 for the four columns respectively) and various types of genes to randomly sample from: all genes (first row), and top 25% genes with high expression (second row), top 25% genes with high expression variance (third row), top 25% overdispersed genes (fourth row). We considered two additional versions of scDRS: scDRS-bin-gs (binary gene sets instead of MAGMA z-score gene weights) and scDRS-adj-ctp (adjusting for cell type proportion). For scDRS-adj-ctp, we simulated random biased gene sets (high-mean/high-variance/overdispersed) based on the balanced data (inversely weighting cells by cell type proportion) to better match the model assumption, namely testing for excess expression relative to cells in the balanced data. In each panel, the x-axis denotes theoretical −log10 p-value quantiles and the y-axis denotes actual −log10 p-value quantiles for different methods. The 3 versions of scDRS produced well-calibrated p-values in most settings and suffered slightly inflated type I error in panels o,p, possibly because it is hard to match a large number of overdispersed putative disease genes using the remaining set of genes. In comparison, all other methods are less well-calibrated and are particularly problematic when the numbers of putative disease genes are small. Error bars denote 95% confidence intervals around the mean of 100 simulation replicates.
Extended Data Fig. 2
Extended Data Fig. 2. Additional causal simulations.
We performed three sets of causal simulations: (1) varying effect size from 5% to 50% while fixing 25% overlap (first column), (2) varying level of overlap from 5% to 50% while fixing 25% effect size (second column), (3) assigning the 528 B cells in the subsampled data to be causal (instead of the 500 randomly selected cells; varying effect size while fixing 25% overlap; third column). We report the power (first row), FDR (second row), and AUC for classifying causal from non-causal cells based on the p-values (third row). scDRS outperformed other methods under all metrics. Error bars denote 95% confidence intervals around the mean of 100 simulation replicates.
Extended Data Fig. 3
Extended Data Fig. 3. Complete results for cell type-level disease associations for 74 diseases/traits and TMS FACS 120 cell types.
Each row represents a disease/trait and each column represents a cell type (number of cells in parentheses). Heatmap colors denote the proportion of significantly associated cells (FDR<0.1 across all cells for a given disease). Squares denote significant cell type-disease associations (FDR<0.05 across all pairs of the 120 cell types and 74 diseases/traits; 597 significant pairs; MC test; Methods). Cross symbols denote significant heterogeneity in association with disease across individual cells within a given cell type (FDR<0.05 across all pairs; 273 significant pairs; MC test; Methods). Heatmap colors and cross symbols are omitted for cell type-disease pairs with non-significant cell type-disease associations. Within the blood/immune block (40 cell types and 21 diseases/traits), 136 of 264 cell type-disease pairs with significant association also had significant heterogeneity. Within the brain block (11 cell types and 21 diseases/traits), 64 of 133 cell type-disease pairs with significant association also had significant heterogeneity. Within the other block (69 cell types and 32 diseases/traits), 54 of 146 cell type-disease pairs with significant association also had significant heterogeneity. We discuss the results for FEV1/FVC. We identified 20 cell types associated with FEV1/FVC (FDR<0.05), including 5 lung cell types and 15 cell types from other tissues. They can be categorized into 5 sets of associations: (1) type II pneumocyte (2) skin-related cells (3) smooth muscle cells (4) fibroblast-and-MSC-like cells (5) pericyte-like cells. The first 4 sets of associations are consistent with a previous work. The 5th set of pericyte associations is also plausible because pericytes are known to regulate lung morphogenesis. We note that the cell type associations from the lung are more likely to be causal and those from the other tissues are more likely tagging the causal cell types due to shared expression. Numerical results are reported in Supplementary Table 12.
Extended Data Fig. 4
Extended Data Fig. 4. Comparison of cell type-level disease association results between TMS FACS and TMS droplet (different technologies), TS FACS (different species).
(a-c) Results for disease association at the cell type-level for TMS FACS, TMS droplet, and TS FACS for diseases and cell types in the blood/immune block (upper left) and the other cell types/diseases block (lower right) in Figure 3 (TMS droplet and TS FACS do not contain brain data; Supplementary Tables 6,7). The plotting style is the same as Figure 3. Heatmap colors for each cell type-disease pair denote the proportion of significantly associated cells (FDR<0.1); squares denote significant cell type-disease associations (FDR<0.05); and cross symbols denote significant heterogeneity in association with disease across individual cells within a given cell type (FDR<0.05). Heatmap colors (>10% of cells associated) and cross symbols are omitted for cell type-disease pairs with non-significant cell type-disease associations via MC test. We matched each TMS FACS cell type using the closest cell type in the TMS droplet and TS FACS data; unmatched cell types were colored in grey. (d) Overlap of significant cell type-disease associations between TMS FACS and TMS droplet (P=2.8×10⁻²⁴, two-sided Fisher’s exact test). (e) Pearson’s correlation of −log10 p-values for cell type-disease associations between TMS FACS and TMS droplet. (f) Overlap of significant cell type-disease associations between TMS FACS and TS FACS (P=1.3×10⁻⁷, two-sided Fisher’s exact test). (g) Pearson’s correlation of −log10 p-values for cell type-disease associations between TMS FACS and TS FACS. We determined that the results are highly consistent between TMS FACS and TMS droplet, and are reasonably consistent between TMS FACS and TS FACS. Our method is underpowered in the TS FACS data, possibly due to the smaller sample size (27K cells in TS FACS vs. 110K cells in TMS FACS). The current TS FACS data corresponds to the initial data release and there will likely be more cells in future releases.
Extended Data Fig. 5
Extended Data Fig. 5. Optimizing parameters of scDRS based on expected and unexpected control cell types across 20 traits.
We considered different versions of scDRS by varying methods for selecting (1) putative disease genes (2) weights for the disease genes (3) MAGMA window size. We considered 6 methods for selecting putative disease genes, 4 methods for selecting gene weights, and 3 MAGMA gene window sizes (Supplementary Note). We applied each version of scDRS to the subsampled TMS FACS data (20 repetitions with 10K cells each) and a curated set of 20 traits with expected and unexpected disease-critical cell types (Supplementary Table 15). For a given scDRS version and a given trait, we computed the t-statistic between cells from the expected and unexpected cell types, and divided it by the average t-statistics of results of the given trait from all data sets and all scDRS versions to correct for trait-specific baseline. We evaluated each version by first computing the mean and SE of the normalized t-statistics for a given trait across the 20 repetitions and then combining the estimates across the 20 traits via random-effect meta-analysis. We compared the performance of a pair of scDRS versions by applying the same procedure to the difference of the normalized t-statistics between the two versions. (a) Varying gene selection methods while fixing other parameters as the default. (b) Varying gene weighting methods while fixing other parameters as the default. (c) Varying MAGMA gene window size while fixing other parameters as the default. The default version was denoted in dark blue. Error bars denote 95% confidence intervals around the mean based on meta-analysis across 20 sub-sampled data sets and 20 traits, using procedures as described above. * denotes P<0.05 and ** denotes P<0.001 for significant differences relative to the default configuration; one-sided tests based on the estimated mean and CIs. Numerical results are reported in Supplementary Table 16.
Extended Data Fig. 6
Extended Data Fig. 6. Numbers of overlapping genes (upper triangle) and correlations of the scDRS disease scores across all TMS FACS cells (lower triangle) between the 26 autoimmune, brain, and metabolic traits analyzed in the main paper.
Traits are ordered via hierarchical clustering of the scDRS score correlation and the clustering dendrogram was provided. The level of gene set overlap is moderate. scDRS disease score correlations distinguish diseases/traits from the 3 categories as well as subgroups of diseases/traits in the same category.
Extended Data Fig. 7
Extended Data Fig. 7. Additional results on disease gene prioritization.
(a-j) Comparison to alternative disease gene prioritization methods for the 10 autoimmune diseases. The first row shows levels of excess overlap between the prioritized disease genes and the gold standard gene sets while the second row shows the corresponding −log10 p-values for excess overlap. Each dot corresponds to a disease, the y-axis shows results for the proposed prioritization method (correlating gene expression levels with the scDRS disease score across all TMS FACS cells), and the x-axis shows results from comparison methods, including (from left to right) top 1,000 MAGMA genes, top 1,000 genes specifically expressed in T cells (vs. the rest of cells in TMS FACS), prioritization based on correlation across T cells (instead of all TMS FACS cells), prioritization based on correlation across CD4+ T cells (instead of all TMS FACS cells), and prioritization based on correlation across CD8+ T cells (instead of all TMS FACS cells). (k-l) Overlap with drug target genes for 27 diseases. (m-n) Overlap with Mendelian disease genes for 45 diseases. The median ratio of −log10 p-values and (excess overlap − 1) between the y- and x-values (median of ratios) was provided in the figure title. P-values are based on two-sided Fisher’s exact tests.
Extended Data Fig. 8
Extended Data Fig. 8. Complete results of correlations between scDRS disease scores and inferred spatial coordinates across CA1 pyramidal neurons in 7 single-cell data sets (extending results in Figure 5b).
(a) Results for regressing the scDRS disease scores against the inferred spatial coordinates for each disease/trait and each inferred spatial coordinate. Color represents the t-statistics and stars represent significant associations (* denotes P<0.05 and ** denotes P<0.005, one-sided MC test; Methods). For clarification, Zeisel & Muñoz-Manchado et al. refers to the data from Zeisel & Muñoz-Manchado et al. 2015 Science and Zeisel et al. refers to the data from Zeisel et al. 2018 Cell. (b) Summary of results in panel a. Heatmap color represent the average t-statistics across the 7 brain-related diseases/traits (excluding height) for each data set and stars represent significant associations by combining p-values across datasets using Fisher’s combined probability test. (c) Summary of the association between brain-related diseases and the inferred spatial coordinates for the mouse and human data sets in panel b.
Extended Data Fig. 9
Extended Data Fig. 9. Complete results of joint regression analysis for GWAS metabolic traits and putative zonated metablic processes across the 6 data sets (extending results in Figure 5d).
(a-b) Results for the 9 metabolic traits and height, a negative control trait. The polyploidy score (panel a) and both the pericentral and periportal score (panel b) were consistently associated with the 9 metabolic traits across the data sets. The strong association (P<0.005) between the pericentral score and height in the Aizarani et al. data may be because that we inferred the pericentral score using mouse gene signatures, which are less conserved in human (as also mentioned in the original paper). (c-d) Results for the 8 metabolic pathways. Overall, as shown in panel d, the pericentral score was associated with pericentral-specific pathways (first 4 rows) while the periportal score was associated with periportal-specific pathways (last 4 rows). * denotes P<0.05 and ** denotes P<0.005 based on one-sided MC tests.
Figure 1.
Figure 1.. Overview of scDRS method.
scDRS takes a disease GWAS and an scRNA-seq data set as input and outputs individual cell-level p-values for association with the disease. (1) scDRS constructs a set of putative disease genes from GWAS summary statistics by selecting the top 1,000 MAGMA genes; these putative disease genes are expected to have higher expression levels in the relevant cell population. (2) scDRS computes a raw disease score for each cell, quantifying the aggregate expression of the putative disease genes in that cell; to maximize power, each putative disease gene is weighted by its GWAS MAGMA z-score and inversely weighted by its gene-specific technical noise level in scRNA-seq. scDRS also computes a set of 1,000 Monte Carlo raw control scores for each cell, in each case using a random set of control genes matching the gene set size, mean expression, and expression variance of the putative disease genes. (3) scDRS normalizes the raw disease score and raw control scores across gene sets and across cells, and then computes a p-value for each cell based on the empirical distribution of the pooled normalized control scores across all control gene sets and all cells. The choice of 1,000 for the number of putative disease genes and the choice of 1,000 for the number of control scores are independent.
Figure 2.
Figure 2.. Results for null and causal simulations.
(a) Q-Q plot for null simulations using 1,000 randomly selected genes as the putative disease genes. Random GWAS gene weights were used for scDRS matching the MAGMA z-score distributions in real traits while binary gene sets were used for the other 3 methods. X-axis denotes theoretical −log10 p-value quantiles and y-axis denotes actual −log10 p-value quantiles for different methods. Error bars denote 95% confidence intervals around the mean of 100 simulation replicates (with 10,000 cells per simulation replicate); all error bars are <0.05 from the point estimate. Numerical results are reported in Supplementary Table 8 and additional results are reported in Extended Data Figure 1 and Supplementary Figure 5. (b) Power for casual simulations with perturbed expression of causal genes in causal cells. We report the power at FDR=0.1 for different methods and different effect sizes. Error bars denote 95% confidence intervals around the mean of 100 simulation replicates (with 10,000 cells per simulation replicate); all error bars are <0.02 from the point estimate. Numerical results are reported in Supplementary Table 9 and additional results are reported in Extended Data Figure 2.
Figure 3.
Figure 3.. Disease associations at the cell type-level.
We report scDRS results for individual cells aggregated at the cell type-level for a subset of 19 cell types and 22 diseases/traits in the TMS FACS data. Each row represents a disease/trait and each column represents a cell type (with number of cells indicated in parentheses). Heatmap colors for each cell type-disease pair denote the proportion of significantly associated cells (FDR<0.1 across all cells for a given disease). Squares denote significant cell type-disease associations (FDR<0.05 across all pairs of the 120 cell types and 74 diseases/traits; p-values via MC test; Methods). Cross symbols denote significant heterogeneity in association with disease across individual cells within a given cell type (FDR<0.05 across all pairs; p-values via MC test; Methods). Heatmap colors (>10% of cells associated) and cross symbols are omitted for cell type-disease pairs with non-significant cell type-disease associations via MC test (heatmap colors omitted for 1 pair (Dendritic-ASM) and cross symbols omitted for 6 pairs (CD4+ α-β T-MONO, CD8+ α-β T-MONO, bladder cell-RA, bladder cell-ASM, oligodendrocyte-BP, and dendritic-BMD-HT)). Auto Immune Traits (AIT) represents a collection of diseases in the UK Biobank that characterize autoimmune physiopathogenic etiology(Supplementary Table 1). Abbreviated cell type names include red blood cell (RBC), granulocyte monocyte progenitor (GMP), medium spiny neuron (MSN), and oligodendrocyte precursor cell (OPC). Neuron refers to neuronal cells with undetermined subtypes (whereas MSN and interneuron (non-overlapping with neuron) refer to neuronal cells with those inferred subtypes). Complete results for 120 cell types and 74 diseases/traits are reported in Extended Data Figure 3 and Supplementary Table 12.
Figure 4.
Figure 4.. Associations of T cells with autoimmune diseases.
(a) UMAP visualization of T cells in TMS FACS. Cluster labels are based on annotated TMS cell types in the cluster. (b-c) Subpopulations of T cells associated with IBD and HT, respectively. Significantly associated cells (FDR<0.1) are denoted in red, with shades of red denoting scDRS disease scores; other cells are denoted in grey. Cluster boundaries indicate the corresponding T cell clusters from panel a. Clusters are annotated based on the putative identities of associated cells in the cluster, for the top 4 clusters (out of 11) with the strongest level of association (highest average disease score for associated cells in the cluster); number of disease-associated cells and number of all cells in the cluster are provided in parentheses. (d) Differences in individual cell-level associations between IBD and HT. Differentially associated cells (absolute scDRS disease score difference>2) are denoted in red and blue, with shades of colors denoting scDRS disease score differences; other cells are denoted in grey. Cluster boundaries indicate the corresponding T cell clusters from panel a. Clusters are annotated the same as in panels b,c; number of IBD-enriched cells, HT-enriched cells, and all cells in the cluster are provided in parentheses. For panels b-d, results for the other 8 autoimmune diseases are reported in Supplementary Figures 13,18. (e) Association between scDRS disease score and CD4 effectorness gradient across CD4+ T cells for 5 representative autoimmune diseases and height, a negative control trait. X-axis denotes CD4 effectorness gradient quintile bins and y-axis denotes the average scDRS disease score in each bin for each disease. * denotes P<0.05 and ** denotes P<0.005 (one-sided MC test). Numerical results for all 10 autoimmune diseases are reported in Supplementary Table 20. (f) Excess overlap with gold standard gene sets. X-axis denotes excess overlap of genes prioritized by MAGMA and y-axis denotes excess overlap of genes prioritized by scDRS, for each of the 10 autoimmune diseases. Median ratio of (excess overlap − 1) for scDRS vs. MAGMA was 2.07. Numerical results are reported in Supplementary Table 22.
Figure 5.
Figure 5.. Associations of neurons with brain-related disease/traits and hepatocytes with metabolic traits.
(a) Subpopulations of CA1 pyramidal neurons associated with SCZ in the Zeisel & Muñoz-Manchado et al. data. Colors of cells denote scDRS disease scores (negative disease scores are denoted in grey). We include a visualization of putative dorsal-ventral and proximal-distal axes (see text). Results for all 7 brain-related diseases/traits and height are reported in Supplementary Figure 23b. (b) Association between scDRS disease score and proximal score across CA1 pyramidal neurons for 5 representative brain-related disease/traits and height, a negative control trait. The x-axis denotes proximal score quintile bins and the y-axis denotes average scDRS disease score in each bin for each disease. * denotes P<0.05 and ** denotes P<0.005 (one-sided MC test). Results for all 6 spatial scores and all 7 brain traits (and height) are reported in Extended Data Figure 8 and Supplementary Table 25. (c) Subpopulations of hepatocytes associated with TG in the TMS FACS data. Significantly associated cells (FDR<0.1) are denoted in red, with shades of red denoting scDRS disease scores; non-significant cells are denoted in grey. Cluster boundaries indicate the corresponding hepatocyte clusters. In the legend, numbers in parentheses denote the number of TG-associated cells vs. the total number of cells. Cluster labels are based on the putative identity of cells in the cluster. Results for the other 8 metabolic traits and height are reported in Supplementary Figure 25. (d) Association between scDRS disease score and polyploidy score for 4 representative metabolic traits and height, a negative control trait. The x-axis denotes polyploidy score quintile bins and the y-axis denotes average scDRS disease score in each bin for each disease. * denotes P<0.05 and ** denotes P<0.005 (one-sided MC test). Results for all 3 scores (polyploidy score, pericentral score, periportal score) and all 9 metabolic traits (and height) are reported in Extended Data Figure 9 and Supplementary Table 26.

References

    1. Visscher Peter M, Wray Naomi R, Zhang Qian, Sklar Pamela, McCarthy Mark I, Brown Matthew A, and Yang Jian. 10 years of gwas discovery: biology, function, and translation. The American Journal of Human Genetics, 101(1):5–22, 2017. - PMC - PubMed
    1. Hekselman Idan and Yeger-Lotem Esti. Mechanisms of tissue and cell-type specificity in heritable traits and diseases. Nature Reviews Genetics, 21(3):137–150, 2020. - PubMed
    1. Regev Aviv, Teichmann Sarah A, Lander Eric S, Amit Ido, Benoist Christophe, Birney Ewan, Bodenmiller Bernd, Campbell Peter, Carninci Piero, Clatworthy Menna, et al. Science forum: the human cell atlas. elife, 6:e27041, 2017. - PMC - PubMed
    1. Calderon Diego, Bhaskar Anand, Knowles David A, Golan David, Raj Towfique, Fu Audrey Q, and Pritchard Jonathan K. Inferring relevant cell types for complex traits by using single-cell gene expression. The American Journal of Human Genetics, 101(5):686–699, 2017. - PMC - PubMed
    1. Watanabe Kyoko, Mirkov Maša Umicevic, de Leeuw Christiaan A, van den Heuvel Martijn P, and Posthuma Danielle. Genetic mapping of cell type specificity for complex traits. Nature communications, 10(1):1–13, 2019. - PMC - PubMed

Method-only references

    1. Sakornsakolpat Phuwanat, Prokopenko Dmitry, Lamontagne Maxime, Reeve Nicola F, Guyatt Anna L, Jackson Victoria E, Shrine Nick, Qiao Dandi, Bartz Traci M, Kim Deog Kyeom, et al. Genetic landscape of chronic obstructive pulmonary disease identifies heterogeneous cell-type and phenotype associations. Nature genetics, 51(3):494–505, 2019. - PMC - PubMed
    1. Kato Katsuhiro, Diéguez-Hurtado Rodrigo, Park Do Young, Hong Seon Pyo, Kato-Azuma Sakiko, Adams Susanne, Stehling Martin, Trappmann Britta, Wrana Jeffrey L, Koh Gou Young, et al. Pulmonary pericytes regulate lung morphogenesis. Nature communications, 9(1):1–14, 2018. - PMC - PubMed
    1. Geary Robert C. The contiguity ratio and statistical mapping. The incorporated statistician, 5(3):115–146, 1954.
    1. Wolf F Alexander, Angerer Philipp, and Theis Fabian J. Scanpy: large-scale single-cell gene expression data analysis. Genome biology, 19(1):1–5, 2018. - PMC - PubMed
    1. Benjamini Yoav and Hochberg Yosef. Controlling the false discovery rate: a practical and powerful approach to multiple testing. Journal of the Royal statistical society: series B (Methodological), 57(1):289–300, 1995.

Publication types

MeSH terms