. 2022 Sep 1;20(1):196.
doi: 10.1186/s12915-022-01395-z.

Multidimensional associations between nutrient intake and healthy ageing in humans

Affiliations

Multidimensional associations between nutrient intake and healthy ageing in humans

Alistair M Senior et al. BMC Biol. .

Abstract

Background: Little is known about how normal variation in dietary patterns in humans affects the ageing process. To date, most analyses of the problem have used a unidimensional paradigm, being concerned with the effects of a single nutrient on a single outcome. Perhaps then, our ability to understand the problem has been complicated by the fact that both nutrition and the physiology of ageing are highly complex and multidimensional, involving a high number of functional interactions. Here we apply the multidimensional geometric framework for nutrition to data on biological ageing from 1560 older adults followed over four years to assess on a large-scale how nutrient intake associates with the ageing process.

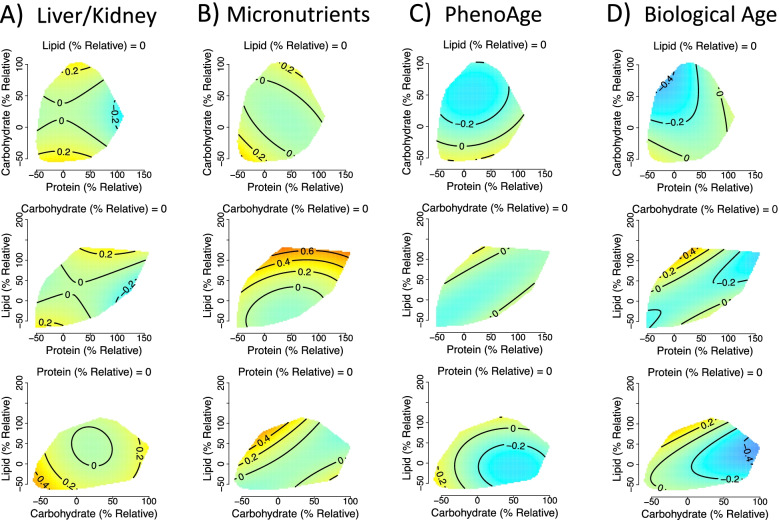
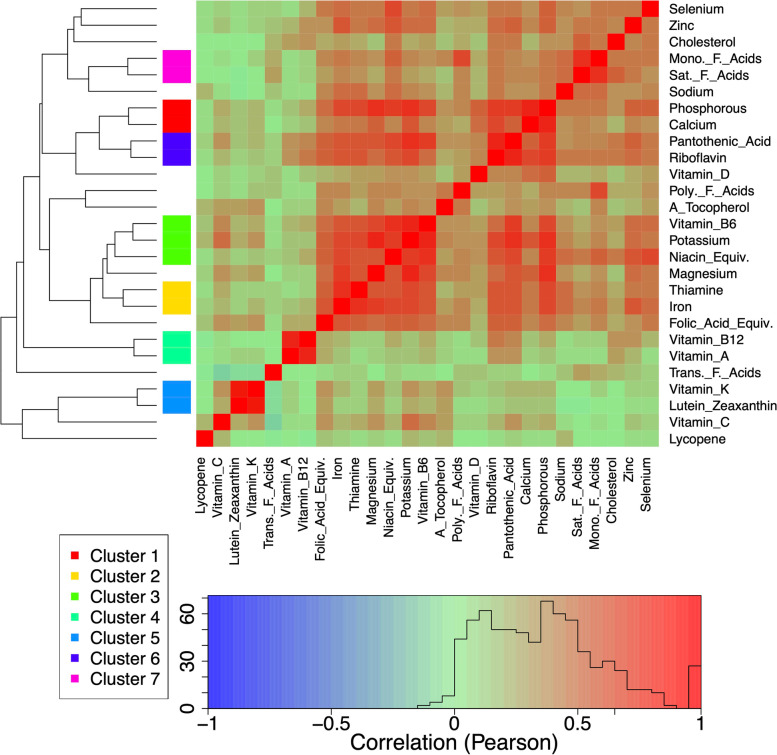
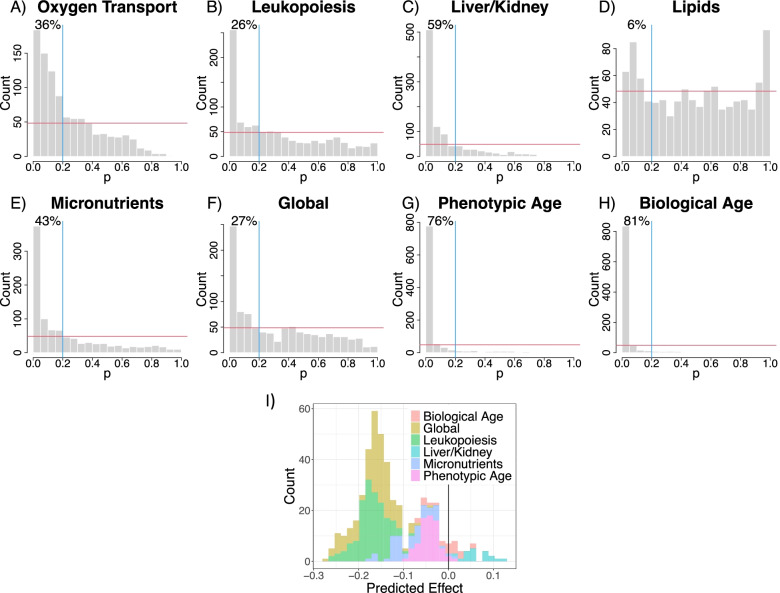
Results: Ageing and age-related loss of homeostasis (physiological dysregulation) were quantified via the integration of blood biomarkers. The effects of diet were modelled using the geometric framework for nutrition, applied to macronutrients and 19 micronutrients/nutrient subclasses. We observed four broad patterns: (1) The optimal level of nutrient intake was dependent on the ageing metric used. Elevated protein intake improved/depressed some ageing parameters, whereas elevated carbohydrate levels improved/depressed others; (2) There were non-linearities where intermediate levels of nutrients performed well for many outcomes (i.e. arguing against a simple more/less is better perspective); (3) There is broad tolerance for nutrient intake patterns that don't deviate too much from norms ('homeostatic plateaus'). (4) Optimal levels of one nutrient often depend on levels of another (e.g. vitamin E and vitamin C). Simpler linear/univariate analytical approaches are insufficient to capture such associations. We present an interactive tool to explore the results in the high-dimensional nutritional space.

Conclusion: Using multidimensional modelling techniques to test the effects of nutrient intake on physiological dysregulation in an aged population, we identified key patterns of specific nutrients associated with minimal biological ageing. Our approach presents a roadmap for future studies to explore the full complexity of the nutrition-ageing landscape.

Keywords: Ageing; Dysregulation; Geometric framework; Healthspan; Nutrition; Systems epidemiology.


Conflict of interest statement

AAC declares a conflict of interest as founder and CEO at Oken Health. The other authors declare that they have no competing interests.

Figures

Fig. 1
Fig. 1
The geometric framework for nutrition (GFN) provides a multi-dimensional perspective on nutrition, by considering the intake of multiple nutrients simultaneously. A A 2-dimensional nutrient space with intake of nutrient 1 on the x-axis and intake of nutrient 2 on the y-axis. B Each point within the nutrient space represents some level of intake of the two nutrients. The effects of the two nutrients on an outcome of interest can be estimated using a statistical model fitted from data gathered on intake of the nutrients and the outcome. Predictions from the model can then be shown as a coloured topology surface overlaid on the nutrient space. Here generalised additive models are used to look at nutrient intake and ageing/dysregulation in a cohort of people aged 67+. C An example surface showing a linear additive effect of intake of both nutrients on the outcome, where low intakes lead to low-value outcome (blue colour) and high intakes lead to a high value of the outcome (red colour). D An example surface showing a non-linear effect of intake of both nutrients on the outcome, where moderate intakes lead to low-value outcomes. These surfaces could be adjusted for other factors (e.g. age) by including covariates in the statistical model
Fig. 2
Fig. 2
Effects of total dietary intake (kJ/day) of protein, carbohydrates, and fats on A liver/kidney function dysregulation (GAM three-way smooth term: edf=9, Ref. df=9, F=2.66, p<0.01, Dev. Expl.=1.5%, n=1834), B micronutrient dysregulation (GAM three-way smooth term: edf=14.6, Ref. df=18.1, F=1.8, p<0.05, Dev. Expl.=2.21%, n=1750) and C biological age score as predicted by model 1 (GAM three-way smooth term: edf=9, Ref. df=9, F=4.06, p<0.001, Dev. Expl.=2.79%, n=1796). Surfaces across the top row show effects of protein (x-axis), and carbohydrate (y-axis) intake, those across the middle row protein and lipid, and the bottom row is carbohydrate and lipid. The third macronutrient is held at the values given on all panels (population median). Warm colours indicate high dysregulation, and cool colours low dysregulation. All scores were Z-transformed to one SD, and surfaces colours are scaled such that deep blue and red represent values of at least −0.8 and 0.8 (conventionally considered an effect of large biological magnitude [46])
Fig. 3
Fig. 3
Effects of relative dietary macronutrient intake (relative to the required intake based on age, weight, height, sex and physical activity level; see Additional file 1: Text S4) on A liver/kidney function dysregulation, (GAM three-way smooth term: edf=9, Ref. df=9, F=3.8, p<0.001, Dev. Expl.=1.8%, n=1834), B micronutrient dysregulation, (GAM three-way smooth term: edf=9, Ref. df=9, F=2, p<0.05, Dev. Expl.=0.9%, n=1750), C PhenoAge (GAM three-way smooth term: edf=9, Ref. df=9, F=2, p<0.05, Dev. Expl.=0.9%, n=1834) and D biological age (GAM three-way smooth term: edf=9, Ref. df=9, F=2, p<0.05, Dev. Expl.=0.9%, n=1796) score as predicted by model 2. Surfaces across the top row show effects of protein (x-axis), and carbohydrate (y-axis) intake, those across the middle row protein and lipid, and the bottom row is carbohydrate and lipid. The third macronutrient is held at the values given on all panels. Warm colours indicate high dysregulation, and cool colours low dysregulation. All scores were Z-transformed to one SD, and surface colours are scaled such that deep blue and red represent values of at least −0.8 and 0.8 (conventionally considered an effect of large biological magnitude [46]). Individuals with a relative intake value of 100, eat 100% more of that macronutrient per day (in kJ) than is predicted to be typical for the population given their age, sex, weight, height and level of physical activity level. Conversely, individuals with a relative intake value of 0 would eat the required amount of that macronutrient per day
Fig. 4
Fig. 4
Correlogram of the strength of correlations (Pearson’s correlation) between intakes of micronutrients (n=3569). Correlations have been clustered hierarchically based on correlation distance (dendrogram). On the basis of this clustering, we grouped micronutrients with highly correlated intakes (> 0.65) for subsequent dimension reduction using principle components analysis
Fig. 5
Fig. 5
Frequency histograms for the p-values for smooth terms for the 969 unique three-way combinations of micronutrient intakes as given by GAMs (micronutrient-specific models; see Additional file 1: Text S1) where A oxygen transport (n=3332), B leukopoiesis (n=3334), C liver/kidney function (n=1834), D lipids (n=1991), E micronutrients (n=1750), F global dysregulation (n=1718), G PhenoAge (n=1834) and H biological age (n=1796) score was treated as an outcome. The red horizontal line indicates the expected frequency under the null hypothesis (that the outcome is unaffected by micronutrient intake) and the blue vertical line demarks p=0.2. The percentage of p-values falling into the upper left quadrant is given. I Frequency histogram of the effects of an increase in α-tocopherol intake of 2 SD from the population average as predicted by different models. Predictions come from all models containing significant three-way micronutrient smooth terms involving α-tocopherol and make adjustments as per model 6. Predictions assume population average values for all other intakes (including alcohol), income, education level, age, physical activity level (PASE), number of comorbidities, men and non-smoker
Fig. 6
Fig. 6
Effects of total dietary micronutrient (α-tocopherol, vitamin C and trans-fatty acid intake) intake on A leukopoiesis (GAM three-way smooth term: edf=9, Ref. df=9, F=3.8, p<0.001, Dev. Expl.=6.7%, n=3334), B liver/kidney function (GAM three-way smooth term: edf=9, Ref. df=9, F=1.9, p<0.05, Dev. Expl.=3.7%, n=1834), C micronutrients (GAM three-way smooth term: edf=9, Ref. df=9, F=2.3, p=0.01, Dev. Expl.=3.8%, n=1750) and D global (GAM three-way smooth term: edf=9.2, Ref. df=9.5, F=2.5, p<0.01, Dev. Expl.=7.5%, n=1718) dysregulation score as predicted by model 6. Intakes have been Z-transformed and are thus in units of SD. In all cases, predictions assume the micronutrient not displayed on either the x- or y-axis is held at the population mean. Numeric confounding variables included in model 6 were alcohol intake, income, education level, age, physical activity level (PASE) and the number of comorbidities, and predictions assume population mean values. Predictions are for men and assume a non-smoker

References

    1. Raubenheimer D, Simpson SJ. Nutritional ecology and human health. Ann Rev Nutr. 2016;36:603–626. doi: 10.1146/annurev-nutr-071715-051118. - DOI - PubMed
    1. Hoffmann I. Transcending reductionism in nutrition research. Am J Clin Nutr. 2003;78(3):514S–516S. doi: 10.1093/ajcn/78.3.514S. - DOI - PubMed
    1. Samieri C, Sun Q, Townsend MK, Chiuve SE, Okereke OI, Willett WC, et al. The association between dietary patterns at midlife and health in aging. Ann Intern Med. 2013;159(9):584–591. doi: 10.7326/0003-4819-159-9-201311050-00004. - DOI - PMC - PubMed
    1. Solon-Biet SM, McMahon AC, Ballard JWO, Ruohonen K, Wu L, Cogger VC, et al. The ratio of macronutrients, not caloric intake, dictates cardiometabolic health, aging, and longevity in ad libitum-fed mice. Cell Metab. 2014;19(3):418–430. doi: 10.1016/j.cmet.2014.02.009. - DOI - PMC - PubMed
    1. Fischer K, Colombani PC, Langhans W, Wenk C. Cognitive performance and its relationship with postprandial metabolic changes after ingestion of different macronutrients in the morning. Brit J Nutr. 2001;85(3):393–405. doi: 10.1079/BJN2000269. - DOI - PubMed

Publication types