. 2022 Sep 1;17(1):402.
doi: 10.1186/s13018-022-03291-2.

A gene expression profile for the lower osteogenic potent of bone-derived MSCs from osteoporosis with T2DM and the potential mechanism

Affiliations

A gene expression profile for the lower osteogenic potent of bone-derived MSCs from osteoporosis with T2DM and the potential mechanism

Sheng-Li Xia et al. J Orthop Surg Res. .

Abstract

Background: Osteoporosis (OP) patients complicated with type II diabetes mellitus (T2DM) has a higher fracture risk than the non-diabetic patients, and mesenchymal stem cells (MSCs) from T2DM patients also show a weaker osteogenic potent. The present study aimed to provide a gene expression profile in MSCs from diabetic OP and investigated the potential mechanism.

Methods: The bone-derived MSC (BMSC) was isolated from OP patients complicated with or without T2DM (CON-BMSC, T2DM-BMSC). Osteogenic differentiation was evaluated by qPCR analysis of the expression levels of osteogenic markers, ALP activity and mineralization level. The differentially expressed genes (DEGs) in T2DM-BMSC was identified by RNA-sequence, and the biological roles of DEGs was annotated by bioinformatics analyses. The role of silencing the transcription factor (TF), Forkhead box Q1 (FOXQ1), on the osteogenic differentiation of BMSC was also investigated.

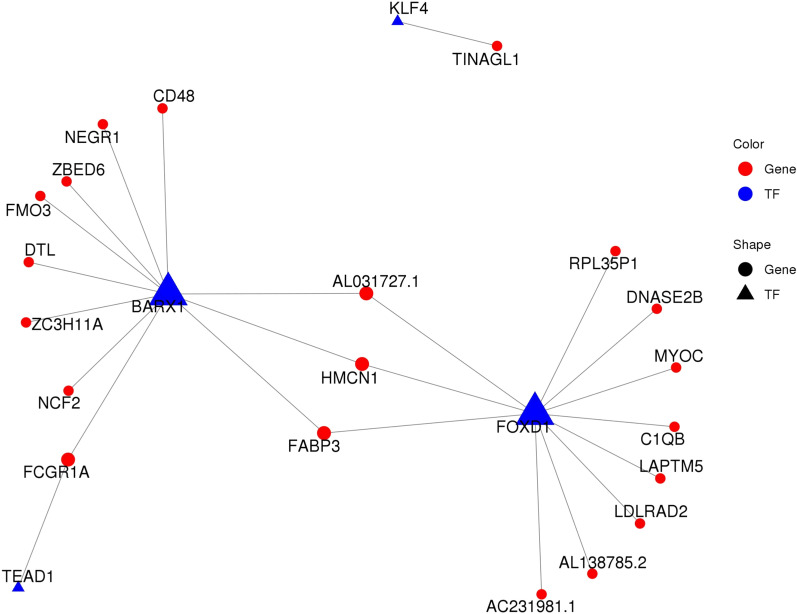
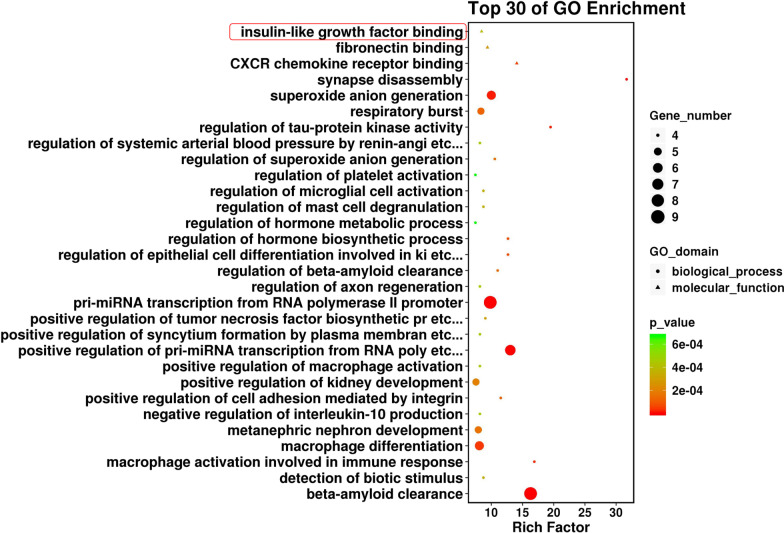
Results: T2DM-BMSC showed a significantly reduced osteogenic potent compare to the CON-BMSC. A total of 448 DEGs was screened in T2DM-BMSC, and bioinformatics analyses showed that many TFs and the target genes were enriched in various OP- and diabetes-related biological processes and pathways. FOXQ1 had the highest verified fold change (abs) among the top 8 TFs, and silence of FOXQ1 inhibited the osteogenic differentiation of CON-BMSC.

Conclusions: Our study provided a comprehensive gene expression profile of BMSC in diabetic OP, and found that downregulated FOXQ1 was responsible for the reduced osteogenic potent of T2DM-BSMC. This is of great importance for the special mechanism researches and the treatment of diabetic OP.

Keywords: FOXQ1; Mesenchymal stem cells; Osteogenic differentiation; Osteoporosis; T2DM.


Conflict of interest statement

The authors declare no competing interests.

Figures

Fig. 1
Fig. 1
Osteogenic differentiation is inhibited in T2DM-BMSC. A Morphology of BMSC from CON and T2DM groups. B qPCR was used to detect the expression levels of three osteogenic markers after BMSC underwent a 7-day osteogenic induction. C ALP staining (left) and activity detection (right) were performed to detect ALP expression level of BMSC after osteogenic induction for 7 days. D ARS staining was used for the evaluation of mineralization level after BMSC underwent a 21-day osteogenic induction
Fig. 2
Fig. 2
RNA-seq analysis of DEGs in T2DM-BMSC. A Heap-map presented the overall expression of DEGs in each samples. CON: C_1, C_2, C_3; T2DM: T_1, T_2, T_3. Each line indicates a gene, and each column indicates a sample of BMSC. B Volcano pot of all DEGs in T2DM group, screened under the thresholds of FC(abs) > 1.5 and p value < 0.05. T: T2DM; C: CON. Each dot indicate a gene. Red indicate upregulation and but indicate downregulation
Fig. 3
Fig. 3
Transcription regulatory network of four transcription factors (blue triangle) and 19 genes (blue circle)
Fig. 4
Fig. 4
Top 30 GO terms. Circle and triangles represent biological process and molecular function, respectively. The size of the circle/triangle indicates the number of DEGs; the color of the circle indicates the p-value. Diabetes-related term is circled in red
Fig. 5
Fig. 5
Top 30 KEGG pathways. The size of the circle indicates the number of DEGs and the color of the circle indicates the p-value. Diabetes-related pathways are circled in red
Fig. 6
Fig. 6
Knockdown of FOXQ1 inhibits the osteogenic differentiation of CON-BMSC. A qPCR analysis of the fold change of the top 8 TFs in T2DM-BMSC. B The expression level of FOXQ1 in another 10 specimens-derived BMSCs was detected. C qPCR and western blot were used to detect the mRNA and protein levels of FOXQ1 after CON-BMSC transfected with siRNAs. D qPCR was used to analyze the expression levels of three osteogenic markers in CON-BMSC silenced of FOXQ1. E ALP staining (left) and activity detection (right) were performed to detect the role of silencing FOXQ1 on the ALP expression level of CON-BMSC. F ARS staining was used to evaluate the role of silencing FOXQ1 on the mineralization level in CON-BMSC

References

    1. Cosman F. Anabolic therapy and optimal treatment sequences for patients with osteoporosis at high risk for fracture. Endocr Pract. 2020;26(7):777–786. doi: 10.4158/EP-2019-0596. - DOI - PubMed
    1. Chen P, Li Z, Hu Y. Prevalence of osteoporosis in China: a meta-analysis and systematic review. BMC Public Health. 2016;16(1):1039. doi: 10.1186/s12889-016-3712-7. - DOI - PMC - PubMed
    1. Clynes MA, Harvey NC, Curtis EM, Fuggle NR, Dennison EM, Cooper C. The epidemiology of osteoporosis. Br Med Bull. 2020;133(1):105–117. doi: 10.1093/bmb/ldaa005. - DOI - PMC - PubMed
    1. Fang P, She Y, Han L, Wan S, Shang W, Zhang Z, et al. A promising biomarker of elevated galanin level in hypothalamus for osteoporosis risk in type 2 diabetes mellitus. Mech Ageing Dev. 2021;194:111427. doi: 10.1016/j.mad.2020.111427. - DOI - PubMed
    1. Si Y, Wang C, Guo Y, Xu G, Ma Y. Prevalence of osteoporosis in patients with type 2 diabetes mellitus in the Chinese Mainland: a systematic review and meta-analysis. Iran J Public Health. 2019;48(7):1203–1214. - PMC - PubMed

MeSH terms

Substances