. 2022 May 3;3(3):722-733.
doi: 10.1002/jha2.457. eCollection 2022 Aug.

An integrated prognostic model for diffuse large B-cell lymphoma treated with immunochemotherapy

Affiliations

An integrated prognostic model for diffuse large B-cell lymphoma treated with immunochemotherapy

Marta Rodríguez et al. EJHaem. .

Abstract

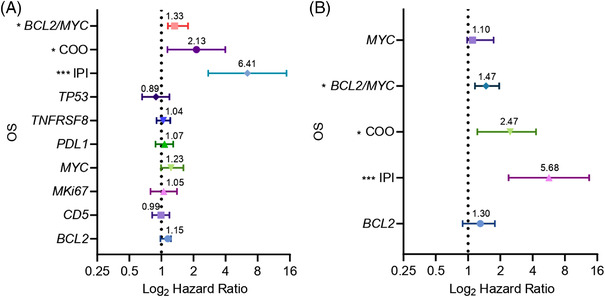
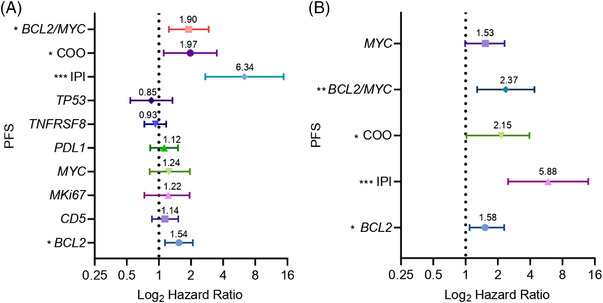
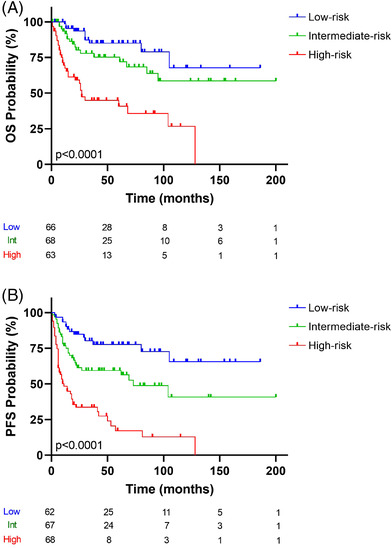
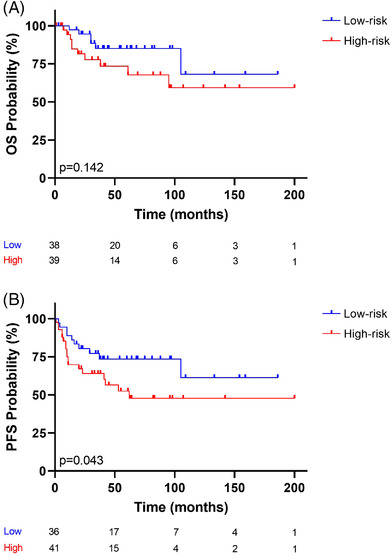
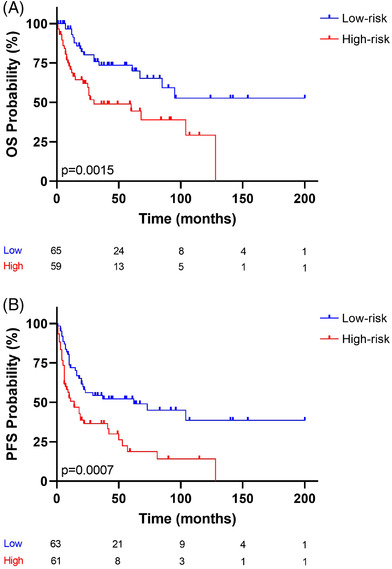
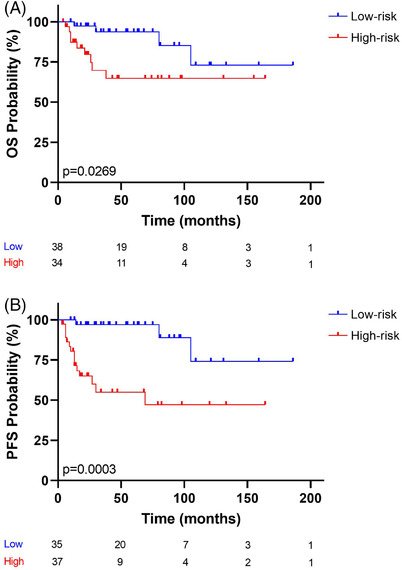
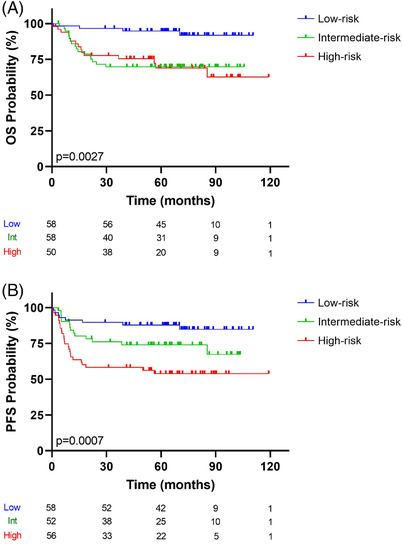
Diffuse large B-cell lymphoma (DLBCL), the most frequent non-Hodgkin's lymphoma subtype, is characterized by strong biological, morphological, and clinical heterogeneity, but patients are treated with immunochemotherapy in a relatively homogeneous way. Here, we have used a customized NanoString platform to analyze a series of 197 homogeneously treated DLBCL cases. The platform includes the most relevant genes or signatures known to be useful for predicting response to R-CHOP (Rituximab, Cyclophosphamide, Doxorubicin, Vincristine, and Prednisone) in DLBCL cases. We generated a risk score that combines the International Prognostic Index with cell of origin and double expression of MYC/BCL2, and stratified the series into three groups, yielding hazard ratios from 0.15 to 5.49 for overall survival, and from 0.17 to 5.04 for progression-free survival. Group differences were highly significant (p < 0.0001), and the scoring system was applicable to younger patients (<60 years of age) and patients with advanced or localized stages of the disease. Results were validated in an independent dataset from 166 DLBCL patients treated in two distinct clinical trials. This risk score combines clinical and biological data in a model that can be used to integrate biological variables into the prognostic models for DLBCL cases.

Keywords: DLBCL; diffuse large B‐cell lymphoma; gene expression; immunochemotherapy; prognosis.


Conflict of interest statement

M.A.P. declares having received lecture fees and advisory board fees from Millennium/Takeda, Jansen, NanoString, Kyowa Kirin, Gilead, and Celgene.The authors declare that they have no significant relationships with, or financial interests, in any commercial companies pertaining to this article.

Figures

FIGURE 1
FIGURE 1
Forest plots of OS status. Hazard ratio (HR) on a log scale values from univariate and multivariate Cox analyses are represented (*p < 0.05; **p < 0.01; ***p < 0.001). Error bars show the 95% confidence interval (95% CI) of the HR. (A) Univariate analysis of these variables: BCL2, CD5, MKi67, MYC, PDL1, TNFRSF8, TP53, COO, and double expression of MYC/BCL2 by NanoString gene‐expression analysis and IPI score. (B) Multivariate analysis of BCL2, MYC, double expression of MYC/BCL2, COO by NanoString gene‐expression analysis and IPI score
FIGURE 2
FIGURE 2
Forest plots of PFS status. Hazard ratio (HR) on a log scale values from univariate and multivariate Cox analyses are represented (*p < 0.05; **p < 0.01; ***p < 0.001). Error bars show the 95% confidence interval (95% CI) of the HR. (A) Univariate analysis of these variables: BCL2, CD5, MKi67, MYC, PDL1, TNFRSF8, TP53, COO, and double expression of MYC/BCL2 by NanoString gene‐expression analysis and IPI score. (B) Multivariate analysis of BCL2, MYC, double expression of MYC/BCL2, COO by NanoString gene‐expression analysis and IPI score
FIGURE 3
FIGURE 3
Kaplan–Meier analysis of (A) OS status and (B) PFS status. The risk‐prediction model of significant variables (IPI, COO, and double expression of MYC/BCL2). The discovery series was divided into three groups: blue, green, and red lines represent low‐, intermediate‐, and high‐risk, respectively. The vertical bar represents OS or PFS probability (%), while the horizontal bar indicates the follow‐up time in months. Patients at risk at the corresponding times are shown. Probabilities are those associated with a log‐rank test
FIGURE 4
FIGURE 4
Kaplan–Meier analysis curve of (A) OS status and (B) PFS status. The risk‐prediction model was applied to patients younger than 60 years of age. Two risk groups were observed: the blue and red lines represent low‐ and high‐risk, respectively. The vertical bar represents OS or PFS probability (%), while the horizontal bar indicates the follow‐up time in months. Patients at risk at the corresponding time are shown. Probabilities are those associated with a log‐rank test
FIGURE 5
FIGURE 5
Kaplan–Meier analysis curve of (A) OS status and (B) PFS status. The risk‐prediction model was applied to patients at advanced clinical stages (stages III–IV). Two risk groups were observed: the blue and red lines represent low‐ and high‐risk, respectively. The vertical bar represents OS or PFS probability (%), while the horizontal bar indicates the follow‐up time in months. Patients at risk at the corresponding time are shown. Probabilities are those associated with a log‐rank test
FIGURE 6
FIGURE 6
Kaplan–Meier analysis curve of (A) OS status and (B) PFS status. The risk‐prediction model was applied to patients with localized clinical stages (stages I–II). Two risk groups were observed: the blue and red lines represent low‐ and high‐risk, respectively. The vertical bar represents OS or PFS probability (%), while the horizontal bar indicates the follow‐up time in months. Patients at risk at the corresponding time are shown. Probabilities are those associated with a log‐rank test
FIGURE 7
FIGURE 7
Kaplan–Meier analysis for (A) OS status and (B) PFS status. The risk‐prediction model was applied in an independent series for validation. Three groups were observed: blue, green, and red lines represent low‐, intermediate‐, and high‐risk, respectively. The vertical bar represents OS or PFS probability (%), while the horizontal bar indicates the follow‐up time in months. Patients at risk at the corresponding time are shown. Probabilities are those associated with a log‐rank test

References

    1. Swerdlow SH, Campo E, Pileri SA, Harris NL, Stein H, Siebert R, et al. The 2016 revision of the World Health Organization classification of lymphoid neoplasms. Blood 2016;127(20):2375‐90. - PMC - PubMed
    1. Sujobert P, Salles G, Bachy E. Molecular classification of diffuse large B‐cell lymphoma: what iss clinically relevant? Hematology/Oncology Clinics 2016;30(6):1163‐77. - PubMed
    1. Alizadeh AA, Eisen MB, Davis RE, Ma C, Lossos IS, Rosenwald A, et al. Distinct types of diffuse large B‐cell lymphoma identified by gene expression profiling. Nature 2000;403(6769):503‐11. - PubMed
    1. Wright G, Tan B, Rosenwald A, Hurt EH, Wiestner A, Staudt LM. A gene expression‐based method to diagnose clinically distinct subgroups of diffuse large B cell lymphoma. Proc Natl Acad Sci U S A. 2003;100(17):9991‐96. - PMC - PubMed
    1. Lenz G, Wright GW, Emre NC, Kohlhammer H, Dave SS, Davis RE, et al. Molecular subtypes of diffuse large B‐cell lymphoma arise by distinct genetic pathways. Proc Natl Acad Sci U S A 2008;105(36):13520‐5. - PMC - PubMed