

Differences of core genes in liver fibrosis and hepatocellular carcinoma: Evidence from integrated bioinformatics and immunohistochemical analysis
- PMID: 36051101
- PMCID: PMC9305567
- DOI: 10.4251/wjgo.v14.i7.1265
Differences of core genes in liver fibrosis and hepatocellular carcinoma: Evidence from integrated bioinformatics and immunohistochemical analysis
Abstract
Background: Liver fibrosis and hepatocellular carcinoma (HCC) are common adverse consequences of chronic liver injury. The interaction of various risk factors may cause them to happen. Identification of specific biomarkers is of great significance for understanding the occurrence, development mechanisms, and determining the novel tools for diagnosis and treatment of both liver fibrosis and HCC.
Aim: To identify liver fibrosis-related core genes, we analyzed the differential expression pattern of core genes in liver fibrosis and HCC.
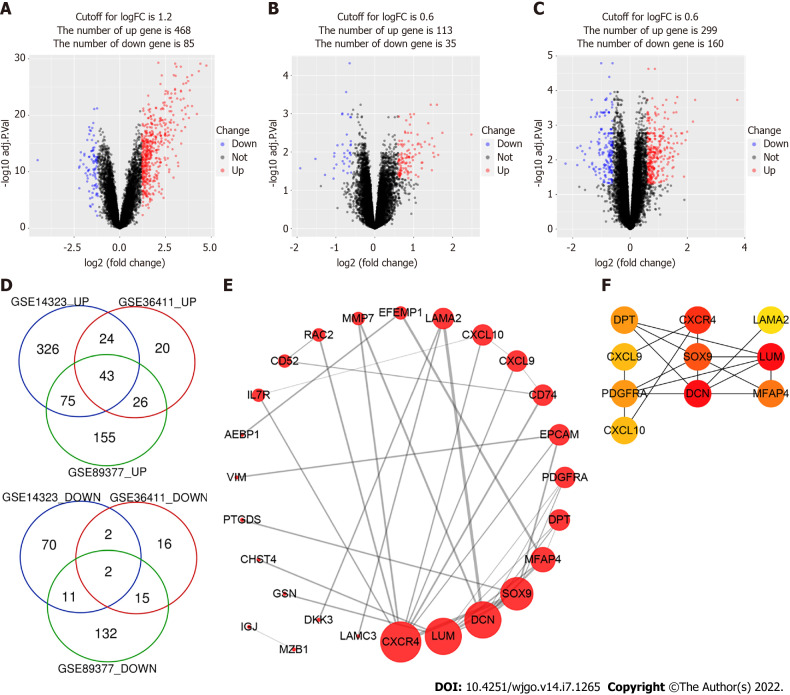
Methods: Gene expression profiles of three datasets, GSE14323, GSE36411, and GSE89377, obtained from the Gene Expression Omnibus (GEO) database, were analyzed, and differentially expressed genes (DEGs) between patients with liver cirrhosis and healthy controls were identified by screening via R software packages and online tool for Venn diagrams. The WebGestalt online tool was used to identify DEGs enriched in biological processes, molecular functions, cellular components, and Kyoto Encyclopedia of Genes and Genomes pathways. The protein-protein interactions of DEGs were visualized using Cytoscape with STRING. Next, the expression pattern of core genes was analyzed using Western blot and immunohistochemistry in a carbon tetrachloride (CCl4)-induced liver cirrhosis mouse model and in patient liver samples. Finally, Kaplan-Meier curves were constructed using the Kaplan-Meier plotter online server.
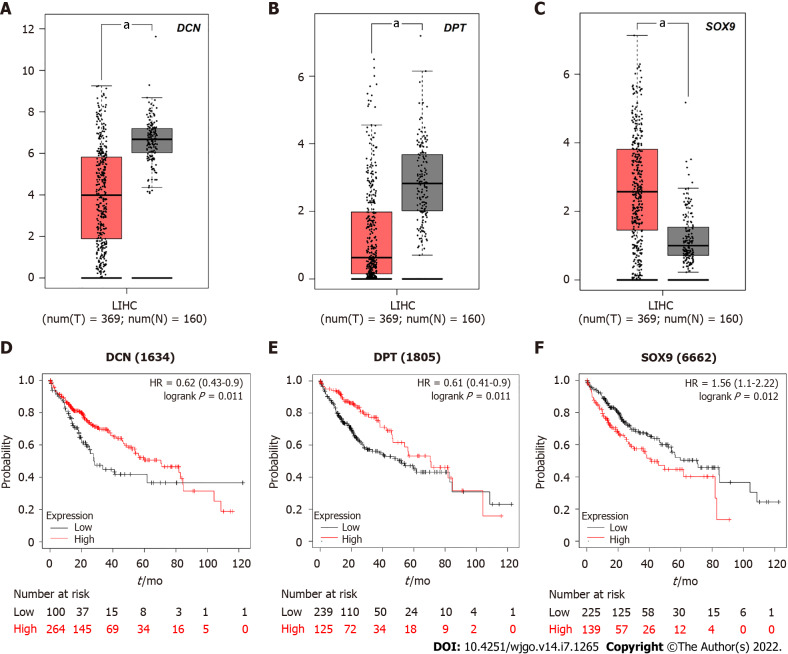
Results: Forty-five DEGs (43 upregulated and 2 downregulated genes) associated with liver cirrhosis were identified from three GEO datasets. Ten hub genes were identified, which were upregulated in liver cirrhosis. Western blot and immunohistochemical analyses of the three core genes, decorin (DCN), dermatopontin (DPT), and SRY-box transcription factor 9 (SOX9), revealed that they were highly expressed in the CCl4-induced liver cirrhosis mouse model. The expression levels of DCN and SOX 9 were positively correlated with the degree of fibrosis, and SOX 9 level in HCC patients was significantly higher than that in fibrosis patients. However, high expression of DPT was observed only in patients with liver fibrosis, and its expression in HCC was low. The gene expression profiling interactive analysis server (GEPIA) showed that SOX9 was significantly upregulated whereas DCN and DPT were significantly downregulated in patients with HCC. In addition, the Kaplan-Meier curves showed that HCC patients with higher SOX9 expression had significantly lower 5-year survival rate, while patients with higher expression of DCN or DPT had significantly higher 5-year survival rates.
Conclusion: The expression levels of DCN, DPT, and SOX9 were positively correlated with the degree of liver fibrosis but showed different correlations with the 5-year survival rates of HCC patients.
Keywords: Bioinformatical analysis; Decorin; Dermatopontin; Hepatocellular carcinoma; Liver cirrhosis; SRY-box transcription factor 9.
©The Author(s) 2022. Published by Baishideng Publishing Group Inc. All rights reserved.
Conflict of interest statement
Conflict-of-interest statement: All the authors report no relevant conflicts of interest for this article.
Figures


Similar articles
-
Screening Hub Genes as Prognostic Biomarkers of Hepatocellular Carcinoma by Bioinformatics Analysis.Cell Transplant. 2019 Dec;28(1_suppl):76S-86S. doi: 10.1177/0963689719893950. Epub 2019 Dec 11. Cell Transplant. 2019. PMID: 31822116 Free PMC article.
-
Identification of core genes and outcomes in hepatocellular carcinoma by bioinformatics analysis.J Cell Biochem. 2019 Jun;120(6):10069-10081. doi: 10.1002/jcb.28290. Epub 2018 Dec 7. J Cell Biochem. 2019. PMID: 30525236
-
Bioinformatics-based screening of key genes for transformation of liver cirrhosis to hepatocellular carcinoma.J Transl Med. 2020 Jan 30;18(1):40. doi: 10.1186/s12967-020-02229-8. J Transl Med. 2020. PMID: 32000807 Free PMC article.
-
Bioinformatics Analysis of Candidate Genes and Pathways Related to Hepatocellular Carcinoma in China: A Study Based on Public Databases.Pathol Oncol Res. 2021 Mar 26;27:588532. doi: 10.3389/pore.2021.588532. eCollection 2021. Pathol Oncol Res. 2021. PMID: 34257537 Free PMC article.
-
Expression and functions of transient receptor potential channels in liver diseases.Acta Pharm Sin B. 2023 Feb;13(2):445-459. doi: 10.1016/j.apsb.2022.09.005. Epub 2022 Sep 15. Acta Pharm Sin B. 2023. PMID: 36873177 Free PMC article. Review.
Cited by
-
Cellular and Molecular Mechanisms of Toxic Liver Fibrosis in Rats Depending on the Stages of Its Development.Sovrem Tekhnologii Med. 2023;15(4):50-63. doi: 10.17691/stm2023.15.4.05. Epub 2023 Jul 28. Sovrem Tekhnologii Med. 2023. PMID: 38434195 Free PMC article.
-
SOX9: a key transcriptional regulator in organ fibrosis.Front Pharmacol. 2025 Feb 5;16:1507282. doi: 10.3389/fphar.2025.1507282. eCollection 2025. Front Pharmacol. 2025. PMID: 39974732 Free PMC article. Review.
-
OncomiR-181a promotes carcinogenesis by repressing the extracellular matrix proteoglycan decorin in hepatocellular carcinoma.BMC Gastroenterol. 2024 Sep 30;24(1):337. doi: 10.1186/s12876-024-03413-6. BMC Gastroenterol. 2024. PMID: 39350070 Free PMC article.
-
Single-cell transcriptomics of hepatic stellate cells uncover crucial pathways and key regulators involved in non-alcoholic steatohepatitis.Endocr Connect. 2023 Jan 18;12(2):e220502. doi: 10.1530/EC-22-0502. Print 2023 Feb 1. Endocr Connect. 2023. PMID: 36562664 Free PMC article.
-
Molecular Basis of Na, K-ATPase Regulation of Diseases: Hormone and FXYD2 Interactions.Int J Mol Sci. 2024 Dec 13;25(24):13398. doi: 10.3390/ijms252413398. Int J Mol Sci. 2024. PMID: 39769162 Free PMC article. Review.
References
LinkOut - more resources
Full Text Sources
Research Materials
Miscellaneous
