. 2022 Jul 16;10(20):6825-6844.
doi: 10.12998/wjcc.v10.i20.6825.

Longitudinal changes in personalized platelet count metrics are good indicators of initial 3-year outcome in colorectal cancer

Affiliations

Longitudinal changes in personalized platelet count metrics are good indicators of initial 3-year outcome in colorectal cancer

Zoltan Herold et al. World J Clin Cases. .

Abstract

Background: Platelet count or complete blood count (CBC)-based ratios including lymphocyte-to-monocyte (LMR), neutrophil-to-lymphocyte (NLR), hemoglobin-to-platelet (HPR), red blood cell count distribution width-to-platelet (RPR), and platelet-to-lymphocyte (PLR) ratio are good predictors of colorectal cancer (CRC) survival. Their change in time is not well documented, however.

Aim: To investigate the effect of longitudinal CBC ratio changes on CRC survival and their possible associations with clinicopathological properties, comorbidities, and anamnestic data.

Methods: A retrospective longitudinal observational study was conducted with the inclusion of 835 CRC patients, who attended at Semmelweis University, Budapest. CBC ratios and two additional newly defined personalized platelet count metrics (pPLTD and pPLTS, the platelet counts relative to the measurement at the time of CRC diagnosis and to the one 4-6 wk after tumor removal surgery, respectively) were recorded.

Results: The 835 CRC patients had a total of 4608 measurements (5.52 visits/patient, in average). Longitudinal survival models revealed that the increases/decreases in LMR [hazard ratio (HR): 0.4989, P < 0.0001], NLR (HR: 1.0819, P < 0.0001), HPR (HR: 0.0533, P = 0.0038), pPLTD (HR: 4.9229, P < 0.0001), and pPLTS (HR: 4.7568, P < 0.0001) values were poor prognostic signs of disease-specific survival. The same was obtained for all-cause mortality. Most abnormal changes occurred within the first 3 years after the diagnosis of CRC. RPR and PLR had an only marginal effect on disease-specific (P = 0.0675) and all-cause mortality (Bayesian 95% credible interval: 0.90-186.05), respectively.

Conclusion: LMR, NLR, and HPR are good metrics to follow the prognosis of the disease. pPLTD and pPLTS perform just as well as the former, while the use of RPR and PLR with the course of the disease is not recommended. Early detection of the abnormal changes in pPLTD, pPLTS, LMR, NLR, or HPR may alert the practicing oncologist for further therapy decisions in a timely manner.

Keywords: Colorectal neoplasms; Hemoglobin-to-platelet ratio; Lymphocyte-to-monocyte ratio; Neutrophil-to-lymphocyte ratio; Personalized platelet count; Platelet-to-lymphocyte ratio.


Conflict of interest statement

Conflict-of-interest statement: All the authors report no relevant conflicts of interest for this article.

Figures

Figure 1
Figure 1
Schematic structure of the study. ICD-10: International Statistical Classification of Diseases and Related Health Problems.
Figure 2
Figure 2
Forest plot of univariate competing risk survival models. Colorectal cancer-specific hazard was higher if a patient had a lower lymphocyte-to-monocyte ratio, hemoglobin-to-platelet ratio, or platelet-to-lymphocyte ratio and higher neutrophil-to-lymphocyte ratio or personalized platelet count relative to “at-diagnosis”. Red blood cell distribution width-to-platelet ratio did not affect neither pre- nor post-operative survival. CI: Confidence interval; HR: Hazard ratio; LMR: Lymphocyte-to-monocyte ratio; PLR: Platelet-to-lymphocyte ratio; NLR: Neutrophil-to-lymphocyte ratio; HPR: hemoglobin-to-platelet ratio; RPR: red blood cell distribution width-to-platelet ratio; pPLTD: Personalized platelet count relative to “at-diagnosis”.
Figure 3
Figure 3
Naïve Kaplan-Meier survival curves of preoperative complete blood count ratios of colorectal cancer patients, which were dichotomized based on optimal thresholds available from receiver operating characteristic models. AUC: Area under curve; CI: Confidence interval; RDW: Red blood cell distribution width.
Figure 4
Figure 4
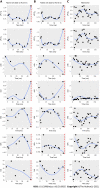
Characteristic changes of complete blood count ratios in patients who died or were alive at the end of our observation. Dotted vertical line represents time of death. pPLTD: Personalized platelet count relative to “at-diagnosis”; pPLTS: Personalized platelet count relative to “after-surgery”; LMR: Lymphocyte-to-monocyte ratio; NLR: Neutrophil-to-lymphocyte ratio; HPR: Hemoglobin-to-platelet ratio; RPR: Red blood cell distribution width-to-platelet ratio; PLR: Platelet-to-lymphocyte ratio.
Figure 5
Figure 5
All recorded personalized platelet count relative to “at-diagnosis” (pPLTD), lymphocyte-to-monocyte ratio, and platelet-to-lymphocyte ratio values of the 835 study participants, which have been stratified by American Joint Committee on Cancer staging[21]. For better view, the remaining complete blood count ratios are drawn on Supplementary Figure 1. Regression curves are not drawn from the actual spline adjusted mixed effect model, but the automatic smoothing curve of the plotting process.
Figure 6
Figure 6
Forest plot of univariate Bayesian joint-models. Higher risk of all-cause mortality was associated with a lower lymphocyte-to-monocyte ratio, hemoglobin-to-platelet ratio, and platelet-to-lymphocyte ratio and higher neutrophil-to-lymphocyte ratio, personalized platelet count relative to “at-diagnosis”, and personalized platelet count relative to “after-surgery”. Red blood cell distribution width-to-platelet ratio did not affect all-cause mortality of study participants. CrI: Credible interval; HR: Hazard ratio; LMR: Lymphocyte-to-monocyte ratio; PLR: Platelet-to-lymphocyte ratio; NLR: Neutrophil-to-lymphocyte ratio; HPR: hemoglobin-to-platelet ratio; RPR: red blood cell distribution width-to-platelet ratio; pPLTD: Personalized platelet count relative to “at-diagnosis”; pPLTS: Personalized platelet count relative to “after-surgery”. Bayesian statistical methods do not give P values, and evaluation of results was detailed in methods.
Figure 7
Figure 7
Forest plot of univariate competing risk models with time-dependent covariate. Higher risk of disease-specific mortality was associated with a lower lymphocyte-to-monocyte ratio, hemoglobin-to-platelet ratio, and platelet-to-lymphocyte ratio, and higher red blood cell distribution width-to-platelet ratio, personalized platelet count relative to “at-diagnosis”, and personalized platelet count relative to “after-surgery”. Neutrophil-to-lymphocyte ratio did not affect disease-specific mortality of study participants. CI: Confidence interval; HR: Hazard ratio. LMR: Lymphocyte-to-monocyte ratio; PLR: Platelet-to-lymphocyte ratio; NLR: Neutrophil-to-lymphocyte ratio; HPR: hemoglobin-to-platelet ratio; RPR: red blood cell distribution width-to-platelet ratio; pPLTD: Personalized platelet count relative to “at-diagnosis”; pPLTS: Personalized platelet count relative to “after-surgery”.
Figure 8
Figure 8
Survival curves for two competing events, stratified by American Joint Committee on Cancer staging[21], in colorectal cancer patients. Solid and dashed lines represent disease-specific death and non-cancer related death, respectively. A: The effect of the stage on patient survival was marginal in the case of personalized platelet count relative to “at-diagnosis” (pPLTD, Stage I vs Stage II: P = 0.0847); B: A significant difference was found in personalized platelet count relative to “after-surgery” (pPLTS, Stage I vs Stage II: P = 0.0314; Stage I vs Stage III: P = 0.0594; Stage I vs Stage IV: P = 0.0335). pPLTD: Personalized platelet count relative to “at-diagnosis”; pPLTS: Personalized platelet count relative to “after-surgery”.

References

    1. Sung H, Ferlay J, Siegel RL, Laversanne M, Soerjomataram I, Jemal A, Bray F. Global Cancer Statistics 2020: GLOBOCAN Estimates of Incidence and Mortality Worldwide for 36 Cancers in 185 Countries. CA Cancer J Clin. 2021;71:209–249. - PubMed
    1. Tan D, Fu Y, Tong W, Li F. Prognostic significance of lymphocyte to monocyte ratio in colorectal cancer: A meta-analysis. Int J Surg. 2018;55:128–138. - PubMed
    1. Chen XQ, Xue CR, Hou P, Lin BQ, Zhang JR. Lymphocyte-to-monocyte ratio effectively predicts survival outcome of patients with obstructive colorectal cancer. World J Gastroenterol. 2019;25:4970–4984. - PMC - PubMed
    1. Jakubowska K, Koda M, Grudzińska M, Kańczuga-Koda L, Famulski W. Monocyte-to-lymphocyte ratio as a prognostic factor in peripheral whole blood samples of colorectal cancer patients. World J Gastroenterol. 2020;26:4639–4655. - PMC - PubMed
    1. Wu Q, Hu T, Zheng E, Deng X, Wang Z. Prognostic role of the lymphocyte-to-monocyte ratio in colorectal cancer: An up-to-date meta-analysis. Medicine (Baltimore) 2017;96:e7051. - PMC - PubMed

LinkOut - more resources